More Related Content Similar to Study on Stress-Strain behaviour of M50 Grade High Strength Glass Fibre Reinforced Self-Compacting Concrete at Different Percentages of Confinements.pdf (20) More from Venkataraju Badanapuri (10) 1. International Journal of Scientific Research in Engineering and Management (IJSREM)
Volume: 05 Issue: 09 | Sept - 2021 ISSN: 2582-3930
© 2021, IJSREM | www.ijsrem.com | Page 1
Study on Stress-Strain behaviour of M50 Grade High
Strength Glass Fibre Reinforced Self-Compacting
Concrete at Different Percentages of Confinements
Venkata Raju Badanapuri
Executive Engineer, Water Resources Department, Government of Andhra Pradesh, India
Abstract: Self-compacting concrete (SCC) can be defined as a fresh concrete which possesses superior flowability under maintained stability
(i.e., no segregation) thus allowing self-compaction—that is, material consolidation without addition of energy. It was first developed in Japan
in 1988 in order to achieve durable concrete structures by improving quality in the construction process. This was also partly in response to the
reduction in the numbers of skilled workers available in the industry. This paper outlines a brief history of SCC from its origins in Japan to the
development of the material throughout Europe. Research and development into SCC in the UK and Europe are discussed, together with a look
at the future for the material in Europe and the rest of the world. Research and development of SCC is being conducted by private companies
(mainly product development), by universities (mainly pure research into the material’s properties), by national bodies and working groups
(mainly the production of national guidelines and specifications) and at European level (Brite-EuRam and RILEM projects on test methods and
the casting of SCC, respectively). Although SCC is not expected too ever completely replace conventionally vibrated concrete, the use of the
material in both the precast and ready-mix markets in the UK, Europe and the rest of the world is expected to continue to increase as the
experience and technology improves, the clients demand a higher quality finished product and the availability of skilled labour continues to
decrease. In this work an attempt has been made to study Stress – Strain behaviour of Glass fibre Self–Compacting Concrete M50 grade under
confined and unconfined states with different percentages of confinement (in the form of hoops). Since the confinement provided by lateral
circular-hoop reinforcement, is a reaction to the lateral expansion of concrete, lateral reinforcement becomes effective only after considerable
deformation in the axial direction. Complete Stress – Strain behaviour has been presented and an empirical equation based on rational
polynomial is proposed to predict the stress – strain behaviour of such concrete under compression. The proposed empirical equation shows
good correlation with the experimental results. There is an improvement in the Compressive Strength, Secant modulus and this is due to the
addition of the glass – fibres to the Self- Compacting concrete and also confinement in the form of hoops in Self-Compacting Concrete mix.
Key words: Glass-fibre, Reinforced Self – Compacting M50 grade Concrete, 6 mm diameter Mild steel, admixtures, Stress – Strain behaviour,
A single Polynomial empirical equation.
1. Introduction
Self-compacting concrete (SCC) can be defined as a fresh
concrete which possesses superior flowability under maintained
stability (i.e., no segregation), thus allowing self-compaction
that is, material consolidation without addition of energy. The
three properties that characterise a concrete as self-compacting
are
flowing ability, the ability to completely fill all areas
and corners of the formwork.
passing ability, the ability to pass through congested
reinforcement without separation of the constituents or
blocking.
resistance to segregation the ability to retain the coarse
components of the mix in suspension in order to
maintain a homogeneous material.
These properties must all be satisfied in order to design an
adequate SCC, together with other requirements including
those for hardened performance.
Self-compacting concrete (SCC) was first developed in Japan
in 1988 in order to achieve durable concrete structures by
improving quality in the construction process. It was also found
to offer economic, social and environmental benefits over
traditional vibrated concrete construction. Research and
development work into SCC in Europe began in Sweden in the
1990s and now nearly all the countries in Europe conduct some
form of research and development into the material.
In addition to the benefits described above, SCC is also able to
provide a more consistent and superior finished product for the
client, with less defects. Another advantage is that less skilled
labour is required in order for it to be placed, finished and made
good after casting. As the shortage of skilled site labour in
construction continues to increase in the UK and many other
countries, this is an additional advantage of the material which
will become increasingly important.
This paper outlines the history of the development of SCC from
its origins in Japan to its development in Sweden and the rest of
Europe. The development of the material in Europe is then
discussed, with particular reference to the UK.
2. International Journal of Scientific Research in Engineering and Management (IJSREM)
Volume: 05 Issue: 09 | Sept - 2021 ISSN: 2582-3930
© 2021, IJSREM | www.ijsrem.com | Page 2
2. Objective of the Study
In the present study, confinement in the form of hoops of 6 mm
diameter was used. The mechanical properties and Stress-Strain
behaviour were studied for GFRSCC with and without
confinement under compression.
A single polynomial empirical equation in the form of
𝑓 =
𝐴𝜀 + 𝐷
1 + 𝐵𝜀 + 𝐶𝜀2
is used for both ascending and descending portion of the curve.
A, B are the constants and determined using the boundary
conditions and verifying whether the experimental data is
related with the mathematically calculated data.
where, f is the stress at any level and ε is the strain at any level.
To express in non-dimensional stress-strain curves the
following form is proposed.
𝑓
𝑓𝑢
=
𝐴1 (
𝜀
𝜀𝑢
) + 𝐷1
1 + 𝐵1 (
𝜀
𝜀𝑢
) + 𝐶1 (
𝜀
𝜀𝑢
)
2
Where 𝑓𝑢 and 𝜀𝑢 are the ultimate stress and strain of the
GFRSCC specimen in compression. A single equation to
predict the entire behaviour was not giving good correlation.
Hence, the constants based on the following boundary
conditions were obtained separately for ascending and
descending portions.
𝐴𝑡
𝜀
𝜀𝑢
= 0;
𝑓
𝑓𝑢
= 0; 𝐴𝑡
𝜀
𝜀𝑢
= 1;
𝑓
𝑓𝑢
= 1; 𝑎𝑛𝑑 𝐴𝑡
𝜀
𝜀𝑢
= 1;
𝑑 (
𝑓
𝑓𝑢
)
𝑑 (
𝜀
𝜀𝑢
)
= 0
The boundary conditions common for both ascending and
descending portions of stress – strain curve.
Stress-Strain analysis of a material is one way to determine
many of its physical properties. With the information gained
through much analysis, one can predict how a part will react
when placed under various working loads.
The major objectives are:
1. Understand the basic process of deformation due to
tensile loading
2. Characterize the physical properties of various metals
from their stress-strain curves
Unconfined plain concrete, exhibits a brittle failure mode, the
failure may be explosive and marks the termination of the
Stress-Strain Curve and loss of load-carrying capacity shortly
after the peak load.
If there exists a lateral pressure that resists this sideway
expansion, however, the core concrete will be in a state of
multi-axial compression. It is accepted that when the concrete
is experiencing multi-axial compression, both the deformation
capacity and strength are improved. The scope of this work was
limited to the development of a suitable mix design to satisfy
the requirements of GFRSCC using local aggregates and then
to determine the strength and durability of such concrete. The
mechanical properties and Stress-Strain behaviour were studied
for GFRSCC with and without confinement under compression.
The specific objectives were as follows.
1. To design a suitable SCC mix utilizing local
aggregates, and
2. To assess the strength development and durability of
GFRSCC and Stress-Strain behaviour with and
without confinement under compression.
In the present study, it was to achieve required properties of
Self-compacting concrete with available materials in the
laboratory. Coarse aggregate with nominal size 12.5 mm (70%)
& 20 mm (30%) was used. Also, Viscosity Modifying
Admixtures (VMA) was used to increase the suspension power
of aggregates and also to eliminate possible segregation. Fine
powdered materials like fly ash are also used to eliminate
possible segregation.
3. Literature Review
1) Hajime Okamura: A new type of concrete, which can be
compacted into every corner of a formwork purely by means of
its own weight, was proposed by Okamura (1997). In 1986, he
started a research project on the flowing ability and workability
of this special type of concrete, later called self-compacting
concrete. The self-compactability of this concrete can be
largely affected by the characteristics of materials and the mix
proportions. In his study, Okamura (1997) has fixed the coarse
aggregate content to 50% of the solid volume and the fine
aggregate content to 40% of the mortar volume, so that self-
compactability could be achieved easily by adjusting the water
to cement ratio and superplasticizer dosage only.
2) Kazumasa Ozawa: After Okamura began his research in
1986, other researchers in Japan have started to investigate self-
compacting concrete, looking to improve its characteristics.
One of those was Ozawa (1989) who has done some research
independently from Okamura, and in the summer of 1988, he
succeeded in developing self-compacting concrete for the first
time. The year after that, an open experiment on the new type
3. International Journal of Scientific Research in Engineering and Management (IJSREM)
Volume: 05 Issue: 09 | Sept - 2021 ISSN: 2582-3930
© 2021, IJSREM | www.ijsrem.com | Page 3
of concrete was held at the University of Tokyo, in front of
more than 100 researchers and engineers. As a result, intensive
research has begun in many places, especially in the research
institutes of large construction companies and at the University
of Tokyo. Ozawa (1989) completed the first prototype of self-
compacting concrete using materials already on the market. By
using different types of superplasticizers, he studied the
workability of concrete and developed a concrete which was
very workable. It was suitable for rapid placement and had a
very good permeability. The viscosity of the concrete was
measured using the V- funnel test.
3) Subramanian and Chattopadhyay: Subramanian and
Chattopadhyay (2002) are research and development engineers
at the ECC Division of Larsen & Toubro Ltd (L&T), Chennai,
India. They have over 10 years of experience on development
of self-compacting concrete, underwater concrete with
antiwashout admixtures and proportioning of special concrete
mixtures. Their research was concentrated on several trials
carried out to arrive at an approximate mix proportion of self-
compacting concrete, which would give the procedure for the
selection of a viscosity modifying agent, a compatible
superplasticizer and the determination of their dosages. The
Portland cement was partially replaced with fly ash and blast
furnace slag, in the same percentages as Ozawa (1989) has
done before and the maximum coarse aggregate size did not
exceed 25mm. The two researchers were trying to determine
different coarse and fine aggregate contents from those
developed by Okamura. The coarse aggregate content was
varied, along with water-powder (cement, fly ash and slag)
ratio, being 50%, 48% and 46% of the solid volume. The U-
tube trials were repeated for different water-powder ratios
ranging from 0.3 to 0.7 in steps of 0.10. On the basis of these
trials, it was discovered that self-compactability could be
achieved
4) Khayat et al.: The use of self-consolidating concrete can
facilitate the placement of concrete in congested members and
in restricted areas. Given the highly flowable nature of such
concrete, care is required to ensure adequate stability. This is
especially important in deep structural members and wall
elements where concrete can segregate and exhibit bleeding
and settlement, which can result in local structural defects that
can reduce mechanical properties. The objective of Khayat’s
(1997) et al. research was to evaluate the uniformity of in situ
mechanical properties of self-consolidating concrete used to
cast experimental wall elements Eight optimized SCC mixtures
with slump flow values greater than 630 mm and conventional
concrete with a slump of 165 mm were investigated. The self-
compacting concrete mixtures incorporated various
combinations of cementitious materials and chemical
admixtures. The water-cementitious materials ratios ranged
from 0.37 to 0.42. Experimental walls measuring 95 cm in
length, 20 cm in width, and 150 cm in height were cast. After
casting, no consolidation was used for the SCC mixtures, while
the medium fluidity conventional concrete received thorough
internal vibration. Several cores were obtained in order to
evaluate the uniformity of compressive strength and modulus of
elasticity along the height of each wall. Khayat (1997) et al.
found out that all cores from both types of concrete exhibited
little variation in compressive strength and modulus of
elasticity in relation to height of the wall, indicating a high
degree of strength uniformity. However, compressive strength
and modulus of elasticity were greater for SCC samples than
those obtained from the medium fluidity conventional concrete.
5) ACI committee report No.226 [1987]: Has discussed the
effects of Fly ash. The effect on the workability depends on the
fineness of Fly ash. The fineness and roundness of particles
improve cohesion and workability. Due to workability, there
will be reduction in susceptibility of segregation and bleeding
which reduces temperature developed during curing in fresh
concrete and reduces permeability in the hardened concrete.
This reduction reduces the damage of steel corrosion, alkaline
sulphite attack. The reports also discussed the specification for
material testing, quality assurance for Fly ash concrete and
making use of good proportion of Fly ash.
6) Srinivasa Rao.P, [2008]: In his paper “Strength properties
of Glass Fibre Self-Compacting concrete” studied the
properties of GFSCC using alkali-resistant glass fibres in
various proportions and compared the properties for controlled
mixes of grade M30 and M35. He concluded that there is an
improvement in the compressive strength for both grades of
GFSCC and is observed to be 15% over Self-Compacted
Concrete.
4. Methodology
4.1. Materials used
a) Cement: Ordinary Portland cement, 43 or 53 Grade can be
used care is taken that it is freshly produced and from a single
producer.
Table 1.0 Properties of cement
Properties Results
Standard consistency 30 %
Initial setting time 30 min
Final setting time 600 min
Compressive strength for 28 days 54.7 N/mm2
Table 1.1. Chemical compositions of Cement as per
manufacturers test Report
Chemical property Results Limits as per IS code
Lime saturation Factor (%) 0.78 0.66 min - 1.02 max
Alumina Iron Ratio (%) 1.2 Min 0.665
Insoluble Residue (%) 0.8 Max 2%
4. International Journal of Scientific Research in Engineering and Management (IJSREM)
Volume: 05 Issue: 09 | Sept - 2021 ISSN: 2582-3930
© 2021, IJSREM | www.ijsrem.com | Page 4
Magnesia (%) 2.1 Max 6%
Sulfuric anhydride (%) 1.1 2.5% to 35
Loss on ignition (%) 2.0 Max 5%
b) Fine aggregate: Fine aggregates can be natural or
manufactured. The grading must be uniform throughout the
work. The moisture content or absorption characteristics must
be closely monitored, as quality of SCC will be sensitive to
such changes. Particles smaller than 0.125 mm are considered
as Fines, which contribute to the fine content.
c) Coarse aggregate: Aggregate of size 10-12 mm is desirable
for structures having congested reinforcement. Wherever
possible aggregates of size higher than 20 mm could also be
used. Well-graded cubical or rounded aggregates are desirable.
Aggregates should be of uniform quality with respect to shape
and grading.
4.2 Admixtures:
Admixtures are defined as, other than cement, aggregate and
water which is added to the concrete before or after mixing it.
a) Mineral Admixtures:
1. Ground Granulated Blast Furnace Slag (GGBS):
GGBS, which is both cementitious, and puzzolonic
material may be added to improve rheological
properties.
2. Silica Fume: Silica fume may be added to improve the
mechanical properties of SCC.
3. Stone Powder: Finely crushed limestone, dolomite or
granite may be added to increase the powder content.
The fraction should be less than 125 microns.
4. Fibres: Fibres may be used to enhance the properties
of SCC in the same way as for normal concrete.
Plain concrete possesses a very low tensile strength, limited
ductility and little resistance to cracking. Internal micro cracks
are inherently present in the concrete and its poor tensile
strength is due to the propagation of such micro-cracks,
eventually leading to the brittle fracture of the concrete.
In the past, attempts have been made to impart improvement in
tensile properties of concrete members by way of using
conventional reinforced steel bars and also by applying
restraining techniques. Although both these techniques provide
tensile strength to the concrete members, they however, do not
increase the inherent tensile strength of concrete itself.
It has been recognized that the addition of small, closely spaced
and uniformly dispersed fibers to concrete would act as crack
arrester and would substantially improve its static and dynamic
properties.
Fiber reinforced concrete can be defined as a composite
material consisting of mixtures of cement, mortar or concrete
and discontinuous, discrete, uniformly dispersed suitable fibres.
Glass fibre is a recent introduction in making fibre concrete. It
has very high tensile strength 1020 to 4080 N/mm2
b) Fly ash: Fly ash is a by-product of the combustion of
pulverized coal in thermal power plants. The dust-collection
system removes the fly ash, as a fine particulate residue, from
the combustion gases before they are discharged into the
atmosphere.
Fly ash particles are typically spherical, ranging in diameter
from <1 μm up to 150 μm. The type of dust collection
equipment used largely determines the range of particle sizes in
any given fly ash.
Fly ashes exhibit pozzolanic activity. The American Society for
Testing and Materials (ASTM) defines a pozzolan as "a
siliceous or siliceous and aluminous material which in itself
possesses little or no cementitious value but which will, in
finely divided form and in the presence of moisture, chemically
react with calcium hydroxide at ordinary temperature to form
compounds possessing cementitious properties." Fly ashes
contain metastable aluminosilicates that will react with calcium
ions, in the presence of moisture, to form calcium silicate
hydrates.
More than 2000 years ago, Roman builders recognized that
certain volcanic ashes were capable of forming effective
cements when combined with lime. The Romans widely
exploited this pozzolanic property of volcanic ashes, and many
structures from the Roman period are still intact. The modern
recognition that fly ash is pozzolanic has led to its use as a
constituent of contemporary Portland cement concrete.
Typical characteristics of good quality fly ash are as follows:
1. Fineness (Blaine’s): 32.62 𝑚2
/N (Min.)
2. Lime Reactivity: 4.5 N/𝑚𝑚2
(Min.)
3. Loss on ignition: 5% (Max.)
Table 1.2 Physical characteristics of VTPS fly ash:
(Obtained from Vijayawada Thermal Power station)
Characteristics Experimental results
Fineness, m2/kg (Blain’s permeability) 475
Lime reactivity 4
Compressive strength, 21 days >80%of the Corresponding
plain Cement mortar cubes
Drying shrinkage % 0.08
Autoclave shrinkage %/0.68
5. International Journal of Scientific Research in Engineering and Management (IJSREM)
Volume: 05 Issue: 09 | Sept - 2021 ISSN: 2582-3930
© 2021, IJSREM | www.ijsrem.com | Page 5
Table 1.3 Chemical composition of VTPS fly ash:
(Obtained from Vijayawada Thermal Power station)
Characteristics Percentage
SiO2 +Al2O3+Fe2O3 86.7
SiO2 54
MgO 0.1
Total sulfur as SO3 0.11
Available alkali as sodium oxide (Na2O) 2.16
Loss on ignition 2
c) Chemical Admixtures: A ‘Chemical admixture’ is any
chemical additive to the concrete mixture that enhances the
properties of the concrete in the fresh or hardened state. ACI-
116R [2000] defines the term admixture as ‘a material other
than water, aggregates, hydraulic cement, used as an ingredient
of concrete or mortar, and added to the batch immediately
before or during its mixing’.
A number of types of Chemical admixtures are used for
concrete. The general purpose chemicals include those that
reduce water demand for a given workability(‘water
reducers’),those entraining air in the concrete for providing
resistance to freezing and thawing action(‘air entrainers’),and
those chemicals that control the setting time and strength gain
rate of concrete (‘accelerators’ and ‘retarders’).Apart from
these chemicals, there are others for special purposes-namely,
Viscosity Modifying Agents, Shrinkage Reducing Chemicals,
Corrosion inhibiting admixtures, and alkali-silica reaction
mitigating admixtures.
A ‘water reducing chemical’, as the name implies, is used to
reduce the water content of a concrete mixture while
maintaining a constant workability. The resultant effect of the
reduced water content is the increased strength and durability
of concrete. However, water reducers may also be employed to
‘plasticize’ the concrete, i.e., Make concrete flowable. In this
case, the water content (or water to cement ratio) is held
constant, and the addition of the admixtures makes the concrete
flow better, while the compressive strength (which is a function
of water to cement ratio), is not affected. Another use of water
reducers is to low the amount of cement (since water is
proportionally reduced) without affecting both strength and
workability. This makes the concrete cheaper and
environmentally friendly, as less cement is consumed.
Water reducers are classified broadly into two categories:
Normal and High Range Water Reducers. The normal water
reducers are also called ‘plasticizers’, while the high range
water reducers are called ‘superplasticizers. While the normal
water reducers can reduce the water demand by 5-10%, the
high range water reducers can cause a reduction of 15-40%.
i) Superplasticizer: In present days Superplasticizers are
powerful enough to keep a concrete mix highly workable for
more than one hour with much less water.
Dosage: The optimum dosage is best determined by site trails
with the concrete mix which enables the effects of workability,
strength gain or cement reduction to be measured. As a guide
the rate of addition is generally in the range of 1 to 4 lit per
cubic meter of concrete
ii) Viscosity modifying Agent (VMA): Today’s concrete has
to fulfill a wide range of requirements in both the fresh and
hardened state. Concrete can be pumped both vertically and
horizontally over a long distance even with high flow, self-
compacting properties.
The use of a viscosity-modifying agent can suppress some of
these variations to a certain extent.
The inclusion of VMA ensured the homogeneity and the
reduction of the tendency of highly fluid mix to segregate
Gelinium-2 VMA is used for this work. The use of a VMA
gives more possibilities of controlling segregation when the
amount of powder is limited.
GLENIUM-2 is a premier ready-to-use, liquid, organic,
viscosity-modifying admixture (VMA) specially developed for
producing concrete with enhanced viscosity and controlled
rheological properties. Concrete containing GLENIUM-2
admixture exhibits superior stability and controlled bleeding
characteristics, thus increasing resistance to segregation and
facilitating placement.
Typical Properties of Glenium-2:
Aspect: Colourless free flowing liquid
Relative Density: 1.01 ± 0.01 at 25°C
pH: > 6
Chloride ion content: < 0.2%
Dosage: GLENIUM-2 is dosed at the rate of 50 to 500 ml/100
kg of cementitious material. Other dosages may be
recommended in special cases according to specific job site
conditions.
iii) Glass Fibres: The glass fibres are of Cem-FIL Anti – Crack
HD (High Dispersion) Glass Fibres with Modulus of Elasticity
72 GPa, Filament Diameter 14 Microns, Specific Gravity 2.68,
Filament length 12 mm and having Aspect Ratio of 857: 1. The
number of fibres per 1 kg is 212 million fibres.
On the basis of the experimental study, it was concluded that
addition of Glass Fibres in concrete gives a reduction in
bleeding. A reduction in bleeding improves the surface
integrity of concrete, improves its homogeneity, and reduces
the probability of cracks occurring where there is some restraint
to settlement. The properties of Glass Fibres are shown below
in table 2.0.
6. International Journal of Scientific Research in Engineering and Management (IJSREM)
Volume: 05 Issue: 09 | Sept - 2021 ISSN: 2582-3930
© 2021, IJSREM | www.ijsrem.com | Page 6
Table 1.4 Properties of Selected Glass Fibres
Trade Name Cem FIL anti-crack High
Dispersion Glass Fibres
1. Number of fibres 212 million/Kg
2. Aspect ratio 857:1
3. Specific surface area 105m2/Kg
4. Typical addition rates 0.6 Kg/m3 of concrete
5. Tensile strengths 1700 N/mm²
6. Modulus of Elasticity 73 GPa
7. Corrosion resistant Excellent
8. Specific gravity 2.6
9. Density 26 kN/m3
10. Filament diameter 14 μm
11. Filament length 12mm
4.3 Water: This is the least expensive but most important
ingredient in concrete. The water, which is used for making
concrete, should be clean and free from harmful impurities such
alkali, and acid etc. in general, the water is fit for drinking,
should be used for concrete. Water confirming to IS 456-2000.
5. Processing of Methodology
5.1. Mix proportions
In the total experimental programme, M50 grade SCC mix was
designed based on Indian Standard Recommended Method of
Concrete Mix Design (IS 10262-1982), and was further
modified by fine tuning the relative proportions of fine and
coarse aggregate, filler material like fly ash, glass fiber along
with super plasticizers and viscosity modifying agents. three
phases are involved at first preparing the SCC mix M 50. In
the second phase involving the casting of the specimens which
is of standard sizes cubes for compressive strength, cylinders
for split tensile strength and beams for flexural strength by
varying the percentage of replacements as well as the
confinements. And in the third phase conducting the tests on
the hardened properties of the specimens to know its
mechanical properties. Compression Tests will be carried out
on hardened test cylinders, the cylindrical test specimens have a
length equal to twice the diameter they are of 150 mm in
diameter and 300 mm long. Compression test develops a rather
more complex system of stress. Due to compression load, the
cube or cylinder under goes lateral expansion owing to the
position’s ratio effect. The steel plates do not undergo lateral
expansion to some extent that of concrete. With the result that
the steel restrains the expansion tendency of concrete in the
lateral direction. This induces a tangential force between the
end surfaces of the concrete specimen and the adjacent steel
plates of the testing machine. Cracks are developed on the
surface of test specimen when it attains peak load in
compression. On Central portion of test specimen, it observed
that cracks are identified. This shows that failure of test
specimen occurred due to insufficient cover to confined steel
specimen.
Fresh SCC must possess the key properties including filling
ability, passing ability and resistance to segregation at required
level. To satisfy these conditions EFNARC has formulated
certain test procedures. The fresh properties of SCC with glass
fiber are shown in Table 6.8. Companion cube specimens of
standard dimensions 100 mm x 100 mm x 100 mm were also
cast and tested for the strength. The results of the compressive
strength are also presented in Table 6.8. The corresponding
compressive strength of cube specimens presented in Table
6.10. Thus, the optimum mix proportions for GFRSCC were
arrived at the end of this phase of study.
5.2 Trail Mixes: Aim is to arrive the Mix Proportion for M50
Grade Self-Compacting Concrete. Hence Mix 1 to Mix 4 in the
Trail Mixes for evaluating the Self-Compatibility of Concrete.
In Mix 4, the material quantities are same as used in the above
Mix including the quantity of super plasticizer, only reducing
the dosage of VMA is changed. Here the Mix passed and the
values are within limits. Thus, the Mix is considered as the
final Mix.
Final Mix proportion: Cement: Fine Aggregate: Coarse
aggregate 1: 1.642: 2.156 respectively. Cement is replaced by
33% with Fly ash.
Table 1.6 Mix design proportions of GFRSCC M50 grade
Material Quantity (kg/𝐦𝟑
)
Cement 425
Fine Aggregate 794.93
Coarse Aggregate (70%+30%) = 896.40
Water 190
Fly ash 209
Glass Fibres 0.60
Super plasticizer 85 ml (0.04132 m³)
Viscosity modifying agent 3 ml
5.3 Development of Glass Fiber Reinforced Self-
Compacting Concrete (GFRSCC):
Fresh SCC must possess the key properties including filling
ability, passing ability and resistance to segregation at required
level. To satisfy these conditions EFNARC has formulated
certain test procedures. The fresh properties of SCC with glass
fiber are shown in Table 1.7. Companion cube specimens of
standard dimensions 100 mm x 100 mm were also cast and
tested for the strength.
The results of the hardened properties of compressive strength for
cylinders are also presented in Table 1.9. The corresponding
compressive strength of cube specimens presented in Table
1.10 Thus, the optimum mix proportions for GFRSCC were
arrived at the end of this phase of study.
7. International Journal of Scientific Research in Engineering and Management (IJSREM)
Volume: 05 Issue: 09 | Sept - 2021 ISSN: 2582-3930
© 2021, IJSREM | www.ijsrem.com | Page 7
5.4 Specimen Preparation for GFRSCC:
After satisfying the requirements GFRSCC in fresh state was
poured in moulds of cubes & cylinders. Using 6 mm diameter.
Mild steel rings as transverse reinforcement, five different
types of cylinders of standard size 150 x 300 mm cast i.e.,
placing no rings, 3 rings, 4 rings, 5 rings and 6 rings.
Specimens were prepared with varying percentages of
Confinement. For GFRSCC mix 15 cylinders and GFSCC mix
14 cubes specimen size 100 mm x 100 mm x 100 mm were
cast. After the concrete has set in moulds the cylindrical
specimens which were to be tested in axial compression were
capped with a thin layer of stiff neat Portland cement paste.
After 24 hours of casting the specimens were de-moulded and
placed in water for curing. After 28 days of curing the
specimens were taken out from water and allowed the surfaces
for drying.
Table 1.7 Concrete Specimen’s Cylinders casting with different
Confinements
Mix
Identification
No of
rings
Specimen’s Size No of
Specimens
GFR SCC 0% 0 150 mm x 300 mm 3
GFRSCC 0.798% 3 150 mm x 300 mm 3
GFRSCC 1.062% 4 150 mm x 300 mm 3
GFRSCC 1.327% 5 150 mm x 300 mm 3
GFRSCC 1.591% 6 150 mm x 300 mm 3
5.5 Compressive Strength
Of the various strengths of concrete, the determination of
compressive strength has received a large amount of attention
because the concrete is primarily meant to withstand
compressive stresses. Generally, cubes are used to determine
the compressive strength. The cubes are usually of 100 x 100 x
100mm (or) 150 x 150 x 150 mm size. In the present
investigation the size of 100 x 100 x 100 mm is used. In the
compressive test, the cube while cleaned to wipe of the surface
water, is placed with the cast faces in contact with the planes of
the testing machine, i.e. the position of the cube then tested is at
right angles to that as cast. The specimens were removed from
the moulds and submerged in clean fresh water until just prior
to testing. The temperature of water in which the cylinders
were submerged was maintained at 27o C+2o C and 90%
relative humidity for 24 hours. The specimens were cured for
28 days.
Table 1.8. Fresh properties of GFRSCC
Name of the
test
Property Unit Result
Requirement
as per of
EFNARC
Min Max
Slump flow Filling Ability mm 675 650 800
𝑇50 cm
Slump Flow
Filling Ability sec 308 2 5
V- Funnel Filling Ability sec 6 6 12
V- Funnel 5
minutes
Seg.
Resistance
sec 9 0 15
L- Box Passing bility H2 H1
⁄ 0.8 0.8 1
6. Results & Discussion
In the present investigation the size of 100 x 100 x 100 mm is
used. In the compressive test, the cube while cleaned to wipe of
the surface water, is placed with the cast faces in contact with
the planes of the testing machine, i.e., the position of the cube
then tested is at right angles to that as cast. The specimens
were removed from the moulds and submerged in clean fresh
water until just prior to testing. The temperature of water in
which the cylinders were submerged was maintained at 27o
C+2o C and 90% relative humidity for 24 hours. The
specimens were cured for 28 days.
6.1 Stress-strain behaviour of GFRSCC
A stress-strain curve is a graph derived from measuring load
versus strain. In order to get the strain values, we cast cylinders
of standard size 150 x 300 mm. In the present investigation,
Cylinders with different confinements were tested in
compression using 1000 kN capacity computer controlled UTM
under strain rate control as per IS 516:1959 to get for assessing
as well as deformation and strain characteristics of concrete
cylinders while undergoing compression testing. Compressive
strength tests were carried out on cubes of 100 mm size using a
compression testing machine of 1000 kN capacity as per IS
516:1959.
A stress-strain curve is a graph derived from measuring load
versus strain. In order to get the strain values, we cast cylinders
of standard size 150 x 300 mm we provided confinement to the
cylinders at different percentages. As a section we using 1000
kN capacity computer controlled UTM under strain rate control
is utilized for assessing as well as deformation and strain
characteristics of concrete cylinders while undergoing
compression testing. The stress-strain behaviour of concrete is
a vital parameter which is essential in designing and toughness
of concrete. An entire stress-strain curve required for the design
and examination of a concrete structure during the severe
weather conditions to and difficulty in concrete repair.
6.1.1 Cylinder with different confinements
8. International Journal of Scientific Research in Engineering and Management (IJSREM)
Volume: 05 Issue: 09 | Sept - 2021 ISSN: 2582-3930
© 2021, IJSREM | www.ijsrem.com | Page 8
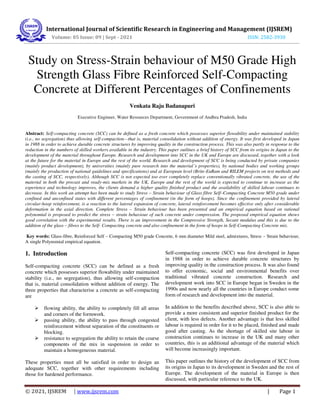
6.2 Stress-strain values of 0 % confinement at 28 days
In order to find the stress-strain curves for concrete, we used to
test cylinder specimen under strain control. The rate of strain
0.02 mm per second and measures at every 20 KN. And also,
here peak stress is 43.0072 N/mm2 and the peak strain is
0.0026. in order to conclude the values of normalized stress, we
consider actual stress to the peaks stress. Similarly in case of
normalized strain actual strain to the peak strain. And here the
most extreme strain is 0.0385. the stress and normalized stress
graphs are given below in Fig 1.0 & Fig 1.1. The graphs are
given below.
Table 1.9 Stress-Strain values of cylinder 0% confinement
SL
No
Stress
N/mm²
Strain Normalized
stress N/mm²
Normalized
strain
1 1.13177 0.0000333 0.03 0.01
2 2.26354 0.0000650 0.05 0.02
3 3.39531 0.0000900 0.08 0.03
4 4.52707 0.0001167 0.11 0.04
5 5.65884 0.0001583 0.13 0.06
6 6.79061 0.0002000 0.16 0.07
7 7.92238 0.0002417 0.18 0.09
8 9.05415 0.0002667 0.21 0.1
9 10.1859 0.0003083 0.24 0.11
10 11.3177 0.0003500 0.26 0.13
11 12.4495 0.0003917 0.29 0.14
12 13.5812 0.0004333 0.32 0.16
13 14.713 0.0004917 0.34 0.18
14 15.8448 0.0005333 0.37 0.19
15 16.9765 0.0005833 0.39 0.21
16 18.1083 0.0006333 0.42 0.23
17 19.2401 0.0006667 0.45 0.24
18 20.3718 0.0007167 0.47 0.26
19 21.5036 0.0007667 0.50 0.27
20 22.6354 0.0008000 0.53 0.29
21 23.7671 0.0008500 0.55 0.30
22 24.8989 0.0009000 0.58 0.32
23 26.0307 0.0009667 0.61 0.35
24 27.1624 0.0010167 0.63 0.36
25 28.2942 0.0010833 0.66 0.39
26 29.426 0.0011667 0.68 0.42
27 30.5577 0.0012250 0.71 0.44
28 31.6895 0.0013333 0.74 0.48
29 32.8213 0.0014083 0.76 0.50
30 33.9531 0.0015000 0.79 0.54
31 35.0848 0.0015917 0.82 0.57
32 36.2166 0.0016667 0.84 0.60
33 37.3484 0.0017667 0.87 0.63
34 38.4801 0.0018667 0.89 0.67
35 39.6119 0.0019667 0.92 0.70
36 40.7437 0.0021500 0.95 0.77
37 41.8754 0.0023333 0.97 0.84
38 43.0072 0.002792 1 1
39 41.8754 0.0031667 0.97 1.13
40 40.7437 0.0033000 0.95 1.18
41 39.6119 0.0034333 0.92 1.23
42 38.4801 0.0035667 0.89 1.28
43 37.3484 0.0036833 0.87 1.32
44 36.2166 0.0037500 0.84 1.34
45 35.0848 0.0038167 0.82 1.37
46 33.9531 0.0038500 0.79 1.39
Fig 1.0 Stress-strain behaviour of M50 grade GFRSCC at 0% confinement
0
5
10
15
20
25
30
35
40
45
50
0.0000E+00 1.0000E-03 2.0000E-03 3.0000E-03 4.0000E-03 5.0000E-03
Stress
N/mm²
Strain (mm/mm)
W/C Ratio - 0.45%
Stress for 0%
steel at 28
days
9. International Journal of Scientific Research in Engineering and Management (IJSREM)
Volume: 05 Issue: 09 | Sept - 2021 ISSN: 2582-3930
© 2021, IJSREM | www.ijsrem.com | Page 9
6.3 Stress strain calculations for 0.798 % confinement
The stress-strain computations for 0.798% steel at 28 days. The
stress-strain curve and normalized stress – strain curve of
0.798% was given beneath. The peak stress is 45.271 N/mm2
and peak strain is 0.002417 and maximum strain is 0.005083.
similarly, peak stress & peak strain was calculated from the
actual stress to the peak stress. Comparison of the normalized
stress & strain values graphically presented in Fig 1.2 & Fig
1.3. The graphs are given below.
6.4 Stress-strain calculations for 1.062 % steel for 28 days
The specimen readings along with the stress-strain
computations for 1.062% steel at 28 days was given beneath.
The stress-strain curves and standardized stress-strain curves
for confinement 1.062% given beneath. Peak stress is 48.1
N/mm2
and strain at peak stress is 0.004. The extreme strain is
0.05833. similarly, peak stress & peak strain was calculated
from the actual stress to the peak stress. Comparison of the
normalized stress & strain values graphically presented in Fig
1.4 & Fig 1.5. The graphs are given below.
6.5 Stress- strain calculations for 1.327% steel for 28 days
The stress-strain computations for 1.327% steel at 28 days. The
stress-strain curve and normalized stress – strain curve of
1.327% was given beneath.
Normalised stress for 0% confinement at 28 days
Fig 1.1 Normalised stress- Normalised strain curve for M50 grade GFRSCC at 0%
confinement
0
0.2
0.4
0.6
0.8
1
1.2
0 0.5 1 1.5
Normalised
stress
N/mm²
Normalised strain (mm/mm)
W/C Ration- 0.45%
Normalised
stress for 0%
confinement
at 28 days
Fig 1.2 Stress -strain behaviour of M50 grade GFRSCC at 0.798% confinement
0
5
10
15
20
25
30
35
40
45
50
0 0.001 0.002 0.003 0.004 0.005 0.006
Sress
N/mm²
Strain (mm/mm)
W/C Ratio- 0.45%
Stress for
0.798%
steel at 28
days
Fig 1.3 Normalised stress - Normalised strain curve of M50 grade GFRSCC at
0.798% confinement
0
0.2
0.4
0.6
0.8
1
1.2
0 0.5 1 1.5 2
Normalised
stress
N/mm²
Normalised strain mm/mm
W/C Ratio- 0.45
Normalised
stress for
0.798%
confinement
at 28 days
Fig 1.4 Stress-Strain behaviour of M50 grade GFRSCC at 1.062% confinement
0
10
20
30
40
50
60
0 0.001 0.002 0.003 0.004 0.005 0.006 0.007
Stress
N/mm²
Strain (mm/mm)
W/C Ratio - 0.45%
Stress for
1.062%
steel at 28
days
Fig 1.5 Normalised stress - Normalised strain curve of M50 grade GFRSCC at
1.062% confinement
0
0.2
0.4
0.6
0.8
1
1.2
0 0.5 1 1.5 2
Normalised
stress
N/mm²
Normalised strain ( mm/mm)
W/C Ratio - 0.45%
Normalised
stress for
1.062%
confinement
at 28 days
10. International Journal of Scientific Research in Engineering and Management (IJSREM)
Volume: 05 Issue: 09 | Sept - 2021 ISSN: 2582-3930
© 2021, IJSREM | www.ijsrem.com | Page 10
The peak stress is 52.061 N/mm2
and peak strain is 0.004333
and maximum strain is 0.006667. similarly, peak stress & peak
strain was calculated from the actual stress to the peak stress.
Comparison of the normalized stress & strain values
graphically presented in Fig 1.6 & Fig 1.7. The graphs are
given below.
6.6 Stress- strain calculations for 1.591% steel for 28 days
The stress-strain computations for 1.591% steel at 28 days. The
stress-strain curve and normalized stress – strain curve of
1.591% was given beneath. The peak stress is 57.7202 N/mm2
and peak strain is 0.004833 and maximum strain is 0.007667.
similarly, peak stress & peak strain was calculated from the
actual stress to the peak stress. Comparison of the normalized
stress & strain values graphically presented in Fig 1.8 & Fig
1.9. The graphs are given below.
6.7 Typical Stress-strain behavior of (M50 Grade
GFRSCC) with different confinement at 28 days
The typical stress-strain curves of M50 GFRSCC at 28 days
under compression. The ascending part of stress-strain curve is
more linear and steeper as the compressive strength of concrete
increases is graphically presented in 1.10, that there is increase
in compressive strength with increasing tie confinements and
also it shows that the peak strain increases slightly with
increasing compressive strength. There is not much difference
in the initial portion of stress – strain curves for confined and
unconfined state. Since the confinement provided by lateral
circular-hoop reinforcement, is a reaction to the lateral
expansion of concrete, lateral reinforcement becomes effective
only after considerable deformation in the axial direction. The
graphs are given below.
Fig 1.6 Stress-Strain behaviour of M50 grade GFRSCC at 1.327% confinement
0
10
20
30
40
50
60
0 0.002 0.004 0.006 0.008
Sress
N/mm²
Strain( mm/mm)
W/C Ratio- 0.45%
Stress for
1.327%
steel at
28 days
Fig 1.7 Normalised stress - Normalised strain curve of M50 grade GFRSCC at
1.327% confinement
0
0.2
0.4
0.6
0.8
1
1.2
0 0.5 1 1.5 2
Normalised
stress
N/mm²
Normalised strain (mm/mm)
W/C Ratio - 0.45%
Normalised
stress for
1.327%
confinement
at 28 days
Fig 1.8 Stress-Strain behaviour of M50 grade GFRSCC at 1.591% confinement
0
10
20
30
40
50
60
70
0 0.002 0.004 0.006 0.008 0.01
Sress
N/mm²
Strain (mm/mm)
W/C Ratio - 0.45%
Stress for
1.591%
steel at
28 days
Fig 1.9 Normalised stress- Normalised strain curve of M50 grade GFRSCC at
1.591% confinement
0
0.2
0.4
0.6
0.8
1
1.2
0 0.5 1 1.5 2
Normalised
stress
N/mm²
Normalised strain ( mm/mm)
W/C Ratio - 0.45%
Normalised
stress for
1.591%
confinement
at 28 days
11. International Journal of Scientific Research in Engineering and Management (IJSREM)
Volume: 05 Issue: 09 | Sept - 2021 ISSN: 2582-3930
© 2021, IJSREM | www.ijsrem.com | Page 11
6.8 Compressive strength of Cubes
The Compressive strength of Cubes of all the 14 Specimens is
more than 50 N/mm2
, which is more than the required strength
are shown in Table 1.10.
6.9 Secant Modulus
The term Young’s Modulus of elasticity can strictly be applied
only to the straight part of the Stress-Strain Curve. In case of
concrete, since no part of the graph is straight line is drawn
connecting a specified point on the Stress-Strain Curve to the
origin of the curve. Slope of this line is referred as Secant
Modulus. In this case Secant Modulus ant 𝐸𝑠𝑒𝑐 obtained at 39%
Stress level is shown in Table 1.11. It shows there is an
increase in Secant Modulus with Confinement. The value of
Secant Modulus obtained for SCC without confinement is
28294.25 N/mm2
. This is found to be about 24.95 % less than
normal concrete of similar strength (35355.339 N/mm2
). An
equation relating young’s modulus (EC) of GFRSCC and its
compressive strength (𝑓𝑐𝑘) is obtained as EC = 5000√𝑓𝑐𝑘. The
Secant modulus of GFRSCC with confinement follows the
relationship 𝐸𝑠𝑒𝑐 = 5132√𝑓𝑐𝑘. The high elastic modulus and
high density of steel may be responsible to increase the 𝐸𝑠𝑒𝑐 of
GFRSCC.
6.10 Energy absorption capacity or Toughness
The energy absorption capacity or toughness of concrete in
compression has been defined as the area under the stress –
strain curve calculated up to a specified strain value. The
specific toughness of concrete in compression has been defined
as the ratio of the area under the stress – strain curve to the
cylinder compressive strength of the concrete. The increase in
energy absorption with confinement is shown in table 1.12.
There is an improvement of energy absorption capacity from
36.12% to 101.82% due to confinement.
6.11 Ductility
Ductility is a mechanical property of materials that measures
the degree of plastic deformation the material can sustain prior
to fracture. If little or no plastic deformation can occur the
material is termed "brittle". Ductility can be quantitatively
expressed in terms of either percent elongation or percent
reduction in an area.
Fig 1.10 Typical stress-strain behaviour of M50 grade GFRSCC with different confinement
at 28 days
0
10
20
30
40
50
60
70
0 0.002 0.004 0.006 0.008 0.01
Stress
N/mm²
Strain (mm/mm)
W/C Ratio- 0.45%
0% Steel
0.798% Steel
1.062% Steel
1.327% Steel
1.591% Steel
Table 1.9. Hardened properties of M50 grade GFRSCC at 28days (Cy
Designation Volume of
Confinement
reinforcement
%
Cylindrical
Compressive
Strength in
N/𝐦𝐦𝟐 (MPa)
Strain at
Peak Stress
GFSCC p 0 43.0072 0.002792
GFRSCC (3R) 0.798 46.4025 0.002933
GFRSCC (4R) 1.062 49.7980 0.003667
GFRSCC (5R) 1.327 52.0614 0.004333
GFRSCC (6R) 1.591 57.7202 0.004833
Table 1.10 Compressive strength of Concrete Cubes tested in
28 days
Sl No Designation Compressive Strength
in N/𝐦𝐦𝟐
1 GFSCC Plain 61.17
2 GFSCC Plain 58.77
3 GFSCC Plain 58.96
4 GFSCC Plain 58.81
5 GFSCC Plain 58.86
6 GFSCC Plain 58.34
7 GFSCC Plain 59.80
8 GFSCC Plain 58.92
9 GFSCC Plain 59.10
10 GFSCC Plain 59.96
11 GFSCC Plain 58.35
12 GFSCC Plain 58.79
13 GFSCC Plain 58.69
14 GFSCC Plain 64.03
Table.1.11 Secant Modulus of GFRSCC
Designation Secant Modulus N/𝐦𝐦𝟐
GFSCC P 28294.25
GFRSCC (0.798 %) 3R 29958.82
GFRSCC (1.062%) 4R 31383.02
GFRSCC (1.327%) 5R 33419.29
GFRSCC (1.591%) 6R 33657.99
12. International Journal of Scientific Research in Engineering and Management (IJSREM)
Volume: 05 Issue: 09 | Sept - 2021 ISSN: 2582-3930
© 2021, IJSREM | www.ijsrem.com | Page 12
Table 1.13 different confinements vs Improvement in
compressive strength (%)
Designation Peak stress
N/𝐦𝐦𝟐
Improvement
in compressive
strength (%)
GFSCC P 43.0072 7.52
GFRSCC (0.798 %) 3R 46.4025 16.00
GFRSCC (1.062%) 4R 49.798 24.50
GFRSCC (1.327%) 5R 52.0614 30.15
GFRSCC (1.591%) 6R 57.7202 44.30
7. Conclusions
Experimental Investigation of study on Glass Fiber Reinforced Self-
Compacting Concrete (GFRSCC) the following conclusions can be
drawn.
1. Self-Compacting Concretes satisfying the specifications laid by
EFNARC could be developed for non-fibrous and fibrous concretes.
There is a marginal increase in compressive strength of self-
compacting concrete with glass fiber additions.
2. Glass Fiber inclusion in Self Compacting Concrete improved the
peak strain and strain at 85% of the ultimate strength in descending
portion. The improvements in strains are pronounced than
improvement in strength.
3. The experimental values compared well with analytical model
developed. A nondimensionalized stress–strain equation proposed in
this investigation can be used to predict the behaviour of Glass Fiber
Reinforced Self-Compacting Concrete (GFRSCC). The stress block
parameters presented in this paper can be used to determine the
ultimate moment and corresponding curvature of GFRSCC.
4. Confinement of concrete has increased the strengths at 28 days from
7.52% to 44.30% in compression.
5. The value of secant modulus (𝐸𝐶) obtained for M50 grade SCC
without confinement is 24.95% less than normal concrete of similar
strength.
6. The value of secant modulus (𝐸𝐶) obtained for M50 grade GFRSCC
with confinement is 2.64% more than ordinary concrete and follows
the relationship 𝐸𝐶 = 5132√𝑓𝑐𝑘
Fig 1.11 Graphical representation of increase in Energy Absorption (%increase)
with different confinements
0
20
40
60
80
100
120
0 0.5 1 1.5 2
Energy
absorption
(%
increase)
% Confinements
W/C Ratio- 0.45%
Energy
absorption
Fig 1.12 Graphical representation of increase in ductility (%increase) with
different confinements
0
10
20
30
40
50
60
70
80
0 0.5 1 1.5 2
Ductility
%
increase
% Confinements
W/C Ratio -0.45%
Ductility %
increase
Fig 1.13 % of Different Confinements Vs % of Improvement of Compressive
Strength
0
5
10
15
20
25
30
35
40
45
50
0 0.5 1 1.5 2
%
of
Improvement
in
compressive
strength
% Confinement
W/C Ratio -0.45%
% of
improvement of
copressive
strength
Table 1.12 Energy absorption, and ductility values for
GFRSCC with different confinements
Designation Energy Absorption
(% increase)
Ductility
(% increase)
GFSCC P - -
GFRSCC (0.798 %) 3R 36.12 5.05
GFRSCC (1.062%) 4R 58.18 31.33
GFRSCC (1.327%) 5R 69.16 55.19
GFRSCC (1.591%) 6R 101.82 73.10
13. International Journal of Scientific Research in Engineering and Management (IJSREM)
Volume: 05 Issue: 09 | Sept - 2021 ISSN: 2582-3930
© 2021, IJSREM | www.ijsrem.com | Page 13
7. It observed that the peak stress and corresponding strain at peak
stress increases with the increase in the percentage of confinement.
8.The energy absorption was increased by 101.82% when the
percentage of confinement is 1.591%.
References
[1] P. Rathish Kumar etal, “Strength Studies on Glass Fiber
Reinforced Recycled Aggregate Concrete”, Asian Journal of Civil
Engineering (Building and Housing) Vol.8, No.6, December 2007,
Pages 679-690.
[2] P. Rathish Kumar etal, “Mechanical Characteristics of Fiber
Reinforced Self-Compacting Mortars”, Vol 9, No 6, Dec 2008,
Asian Journal of Civil Engineering (Building and Housing),
Teheran.
[3] P. Rathish Kumar and Rao C.B.K., “Constitutive Behaviour of
High Performance Ferrocement under Axial Compression”,
International Journal of Magazine of Concrete Research,
scheduled for publication in volume 58, issue 10, pp. 647––656,
Dec 2006.
[4] “Self-Compacting Concrete” Discussion Forum. Indian Concrete
Journal, October 2004
[5] IS: 516–1956 (Reaffirmed 1999), Indian Standard Methods of
Tests for Strength of Concrete. Bureau of Indian Standards, New
Delhi, 110002.
[6] IS: 2386, Indian Standard Code Method of test for Aggregates for
Concrete, reprinted 1997. Bureau of Indian Standards, New Delhi,
110002.
[7] IS:383, Indian Standard Code Method of sampling of Aggregates
for concrete. Bureau of Indian Standards, New Delhi, 110002.
[8] EFNARC, “Specifications and Guidelines for Self-Compacting
Concrete”, EFNARC, UK (www.efnarc.org), February 2002, pp.
1-32.
[9] Specifications and Guidelines for Self-Compacting Concrete,
February 2002, EFNARC, Association House, 99 West Street,
Farnham, UK.
[10] IS 456-2000, Indian Standard Code of Practice for Plain and
Reinforced Concrete. Bureau of Indian Standards, New Delhi,
110002.
[11] IS 800-1984, Indian Standard General Construction in Steel Code
of Practice, Bureau of Indian Standards, New Delhi, 110002.
[12] IS 4031-1998 (PART-1), Standard code of practice for methods
of tests for Hydraulic cement, Bureau of Indian standards, new
Delhi, 1997
[13] Srinivasa Rao.P, Seshadri Sekhar. J.” Strength properties of Glass
Fiber SCC”. Indian Concrete Journal, Vol.88, February 2008 pp:
61-65.
[14] Subramanian S, Chattopadyaya D. Experiments for mix
proportioning of Self- Compacting Concrete, Indian Concrete
Journal, January 2002, pp 13-20.
[15] Suresh Babu.T, Seshagiri Rao. M.V and Rama Seshu.D.”
Mechanical properties and Stress-Strain Behaviour of Self-
Compacting Concrete with and without Glass
[16[ Fibres”, Asian Journal of Civil engineering (Building and
Housing) Vol.9, No.5 (2008), pp: 457-472
[17] Vengala J, Sudarshan M.S. and R V Ranganath. Experimental
Study for obtaining Self-Compacting Concrete” Indian Concrete
Journal, Vol 77, no.8, August 2003, pp 1261-1266.
[18] EFNARC Guidelines for Viscosity Modifying Admixtures for
Concrete, September 2006.
[19 M.S. Shetty, Concrete Technology, S. Chand Company Ltd-2005,
New Delhi -110044.
Authors Profile
Er Venkata Raju Badanapuri, Executive
Engineer, Water Resources Department,
Government of Andhra Pradesh, India. His
educational Qualifications includes Institute
of Engineers India, C.E (India), F.I.E. He did
Post-Graduation in M. Tech (Structural
Engineering), J.N.T University, Hyderabad.
He did B.E.(Civil), Andhra University, Vishakhapatnam. He
has following Journal Publications in his name:
Venkata Raju Badanapuri, Indian Scenario of Water Resources,
An Overview, Integrated Water Management and Major Issues
related to Indian Waters " International Journal of Engineering
Research, in ISSN:2321-7758, Vol.6., Issue.5, 2018 Sept-Oct.,
PP 64-70,
Venkata Raju Badanapuri, “On Overview of Integrated theory
of Irrigation efficiency and Uniformity and Crop Water Use
Efficiency Indian Waters " International Journal of Engineering
Research, in ISSN:2321-7758, Vol.6., Issue.6, 2018 Nov-Dec.,
PP 11- 26,
Venkata Raju Badanapuri, Water Resources Scenario in India
its Requirement, Water Degradation and Pollution, Water
Resources Management, International Journal of Research, in
ISSN:2348-6848, Volume 05 Issue 23December 2018, PP 672-
696.
Venkata Raju Badanapuri, Seismic Forces and Stability
Analysis of Gravity Dam, International Journal of Science and
Research (IJSR), in ISSN 2319 -7064, Volume 08 Issue 06
June 2019, PP 2021- 2030.
14. International Journal of Scientific Research in Engineering and Management (IJSREM)
Volume: 05 Issue: 09 | Sept - 2021 ISSN: 2582-3930
© 2021, IJSREM | www.ijsrem.com | Page 14
Venkata Raju Badanapuri, Design Principles that are involved
in the design of Flow over an Ogee Crest Spillway,
International Journal of Science and Research (IJSR), in
ISSN2319 -7064 Volume 08 Issue 08 August 2019, PP 245-
254.
Venkata Raju Badanapuri, Static and Dynamic Analysis of
Multistoried Building in Seismic Zone-III, International Journal
of Science and Research (IJSR), in ISSN 2319 -7064 Volume
10 Issue 02 February 2021, PP 86- 96.
Venkata Raju Badanapuri, Analysis and Design of Elevated
Intez Water Tank based on Normal Frame Staging Subjected to
Seismic Loading by Using Staad Pro Software, International
Journal of Science and Research (IJSR), in ISSN: 2319-7064
Volume 10 Issue 3, March 2021, PP 720 – 731.