
Recommended
More Related Content
Similar to fueLthoughtWILFRID L. KOHL is Directorof the Internati.docx
Similar to fueLthoughtWILFRID L. KOHL is Directorof the Internati.docx (20)
More from budbarber38650
More from budbarber38650 (20)
Recently uploaded
Recently uploaded (20)
fueLthoughtWILFRID L. KOHL is Directorof the Internati.docx
- 1. fueL thought WILFRID L. KOHL is Director of the International Energy and Environment Program of the Foreign Policy Institute and Professor of International Relations at the Paul H. Nitze School of Advanced International Studies at Johns Hopkins University. WILFRID L. KOHL The Perfect Storm OPEC and the World Oil Market O il continues to be the world's most important fuel, contributing >') percent ofthe global energy supply. It will remain the leading luel in the near future, driven primarily hy demand from the rapidly growing transportation sector. Crude oil prices have been especially volatile recently, reaching almost US$50 per barrel in AiLgList 2004. W hy have oil prices risen so significiintiy, and what is the role ofthe Organization of Petroleum Kxporting C^ountries (OPEC) in the oil market? OPF.C is an organization of oil-producing governments that
- 2. cooperate to manage oil supply and prices in order to maximize the revenues ofthe memher states and promote stability in the oil market. The ten producer governments who make up O P E C (OPEC-10), most of them in the Middle East, have economies that are highly dependent on oil revenues, all ot whom ostensibly accept produc- tion quotas. Iraq, the eleventh memher, currentlj" has no quota because it is tr'ing to restore its fomier oil production after the Iraq war in 2003. O P E C acts like a cartel as it pursues its economic and political ohjectivus. .Although O P E C has ahout 75 percent ofthe world s oil reserves, it currently comprises only ahout 35 percent of world oil production, much less than the 60 to 65 percent it controlled at the time ofthe oil shocks in the 1970s. Non-(^PEC producers are thus important, led by Russia, whose production is expanding, and the United States, whose production is declining. While O P E C has had some success at managing the world oil market in recent years, it has also made mistakes. At times, it is confronted by challenges beyond its conti'ol, as in 2004. The Oil Price Band At its disasti'ous meeting in Jakarta at the end of November 1997, O P E C increased oil production despite the economic crisis in Asian economies, which
- 3. led to falling demand in 1998 and a price collapse to US$10 per barrel. T h e price collapse caused severe damage to the economies of producer countries. T h e cartel was able to regroup and cut production in March 1999 with the assistance of non-OPEC producers, specifically Mexico, Russia, Norway, and Oman. Oil prices recovered and increased above US$30 per barrel by early 2000, tiriven partly by Asian recovery and low Organization of Economic Co- operation and Development (OECD) oil stocks. O P E C overshot its target of restoring prices to the low- to mid-US$20 range. In 2000, O P E C increased output four times to try to reduce the high oil prices that threatened to diminish oil demand. At its l i e n n a meeting in March of that year, O P E C reversed its 1999 decision and increased production, assisted again hy the cooperation of several non-OPEC producers. It also announced a price band mechanism designed to keep oil prices in a target range of US$22 to US$28 per barrel for die OPEC basket of crudes. T h e O P E C basket is a weighted average of Saudi light and six other O P E C crude oils. It includes an automatic production adjustment mechanism that is 68 H K V K I) I I I l: . L R E M II, Winter 200:5
- 4. implemented if the price goes above or below the bantl, though the mechanism has not always been implementeti. Other production increases followed in June, Septemher. and October 2000, but oil prices remained stubbornly high, finally dropping at the year's end. T h e record of die O P E C hasket price is a good indica- tor of OPEC^s success or failure at managing the world oil market. Oil prices have been within the hand only about half of the tiine and rose well above the Iiand in 2004. The O P E C basket price tends to run about US$2 below die US benchmark oil price for West Texas Intermediate crude (WTI), which is the price quoted on the New York Mer- cantile Exchange. In 2001, O P E C faced an economic recession in the United States thiit gradually spread elsewhere in the world and reduced oil demand. Following sevL-ral OPE(^ pnxluc- tion cuts, the OPEC basket price initially remained in the mid-US$20 range (within the price hand). However, the September 11 attacks were tollowed by a reduction in air travel and a decline in the stock market that deepened the recession. Oil demand fell o^ and oil prices soon fell below USS20 per barrel. To respond, OPEC^ calleil an emergency" meeting in hue November and announced a production cut of 1.5 million barrels per day (mbd), effective January 2002, on the condition that non-OPl'"C^ producers led by Russia would contribute an additional cut of 500,000 barrels per day (bptl). T h e O P E C strategy was largely suc- cessfiil. A global economic slowdown and a slump in oil demand confronted O P E C at the start of 2002. O P E C
- 5. was determined to prevent a further collapse of prices and restrained pro- duction. Political tensions rose in the Middle East with new Israeli attacks against the Palestinians and US threats against Iraq. Iraq continued its practice of interrupting oil exports. OPEC's production quotas, the lowest since 1991, ;issisted in keeping oil stocks low and helped move oil prices back into the USS20 to US$25 range by spring 2003. Economic recover)- began in the fall, and oil prices increased. OPEC- basket prices were again within the price band. In December, OPEC raised its production ceiling to 23 mbd to align it with actual production. A strike of Venezuelan oil produc- tion workers in earlv 2003 removed most of that producer's oil production and exports, causing ;i shortfall in the market. .At the same time, unrest in Nigeria decreased that countiy's production. Consequently, at its Januar- 2003 meeting, OPEC decided to raise its production by 1.5 mbd to 24.5 mbd on a ptv rata basis, effective Febru- ar)' 1, largely to compensate for the Venezuelan shortfall. By March, fears of war in Iraq (the United States and Great Britain were calling for military action), cold weather, and low US product inventories temporarily drove up W^FI prices to nearly USS4() per barrel. O P E C indicated that it would keep the oil market well-supplied in a crisis and the International Energy Agency (IEA) agreed to let O P E C attempt this before responding with any release of strategic oil supplies. VVhen the war began in Iraq, oil prices declined to US$30 U T l in the expectaticjn ofa short war. O P E C
- 6. replaced lost Iraqi production in April through increased production by Saudi Arabia (which had gone up to 9.5 mbd) and hy Kuwait, Lilna. and Algeria. At the end of April 2003, O P E C agreed io cut iictual production by 2 mhd to 25.4 mhd on the assumption that there would be a seasonal drop in demand and that Iraq would be gradually reintegratetl into the market. Saudi Oil Minister Ali al-Naiini stressed renewed effort to keep the |irice as close to US$25 per barrel as possible. Iraqi produc- tion began to slowly recover. Oil prices were at the to|) ofthe Opposite: OPEC ofTicJals announce the reluctant increase of oil production ID Sep- tember of 2004. Above: Kuwaiti Oil Minister Ahmed al-Fahd al- Sabah responds to questions about OPEC's surprising cut in production in February 2004. Photos Courtesy AFP/Getcy Images W i n t e r 2005 - H A R V A R D r I" V R N A T [ ( ) X A L R I". ' I K W | 6 9 i ENERGY price hanti. But in August. Init.] s northern export pipeline was sabotaged and U N headquarters were bomhed in Baghdad, exerting upward pressure on oil priees. in a somewhat surprising ilccision, OPF.C^ decided to cut production further in September 2003 and return to the Februar)- ceiling ot 24.5 mhd to preempt siock-build in the fourth quarter and maintain prices in the upper part ol the price hand. OPEC!] did this under the assumption that the world economy was slowly improving and that Iraqi
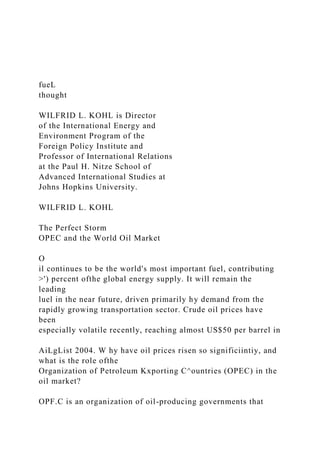
- 7. production and exports were slowly expanding. Naimi saiil that OPE(^ would not raise the price band despite a proposal from Venezuela to do so. Oil prices rose to helween US$2H and USS2y per barrel in September and to lietween USS3() and US$32 per barrel by November. Both US President George W. Bush ami IKA Executive Director C îaude Mantlil expressed disappointment al the September decision, con- cerned that it would harm economic growtli. In December 2003. OPF.C^ reaffirmed its September decision, noting continuing political tensions beeause of disorder in Iraq and the continuing weakness of the US BARRELS OF FUN SOO f — + — 4 The figure above shows OPEC's net revenues from oil ex- ports over time.The grey line represents prices in nominal US dollars while the black line indicates prices adjusted to represent the value of the 2004 US doHar.The oil crisis of the 1970s, which was a high revenue period for OPEC because of increasing demand for oil, was followed by a period in which OPEC continually misread the market's need for oil.The de- creased revenues reflect these market misreadings. Much of the volatility in the period after 2000 has been explained by conflicts in the Middle East and oil strikes elsewhere. Energy Information Administration dollar, w hich lowered OPEC^ purchasing power. Meanwhile, Iraqi production reached 2 J 5 mbd and tbe O P E C basket price had exceeded L'S$28 for long enough that the auto- matic price band adjustment should have hccn triggered.
- 8. But O P E C resisted this aetion, fearing that demand would tumble by the second quarter of 2004. Market Miyreadings OPEC; lost control of oil prices in 2004. Tn the first three quarters of 2004, the O P E C basket price remained above USS40 per barrel, although it fell slightly below US$40 per barrel in September. A series of factors contributed to these developments, which have been characterized by observers such as Edgard Habib, ehief economist at ChevronTexaco, as a "perfect storm." Factors included a largely unanrJtipated surge in oil demand spurred by high economic growih in China and the United States (estimated at 13 percent and 4.5 percent respective!)' in 2004 by Deutsche Bank), low oil inventories, deepening violence and instability in Iraq, de- clining OPEC' spare capacity, and bottlenecks in tbe gasoline market due, in part, to stretched refineries. O P E C , led by Saudi Arabia, began tbe j'car b' misread- ing the market when it announced its intention to reduce overproduction '.md adhere to a 24.5 mbd ceiling in March before cutting proiiuction in April. Naimi reaffirmed his belief in a US$25 per barrel price for the O P E C basket, citing c(jncern about falling ilemand ;ind a large stock build in the second quarter, and was detenninctl not to repeat the mistakes of 1997 to 1999. In March, WV prices reached a high of hetween USS36 and USS38 per harrel and the C P̂ EC^ l>asket price ranged from betw een US$32 and L'SS33 per barrel. On March 31. 2004. in Menmi, O P E C confirmed its earlier decision t() cut ouqiut by one nibil on Ajiril 1 to 23.5 mbd despite high oil prices. It blamed tbe cut on tightening US gasoline supplies, geopolitical uncertainties, anil on the fiuurcs market where speculators were taking long positions.
- 9. Ministers insisted that the market was well-supplied with oil and that OPEC' would not allow an' shortages in wf)rld oil markets, but ihey seemed tocuseii on keeping invent()ries low and prices high. White House and US Department of Energy officials criticized C^PEC"'s production cuts while prices were high. Meanwhile, Venezuela, Nigeria, and Iran argued for tbe need to raise the price band, causing disagree- ment within OPEC. In ihc face ol growing oil dcinanil and attacks on oil facilities in Iraq and Saudi Arabia, oil prices rose above USS40 per barrel in May. Naimi finally began calling for a produciion increase. He got Iiis wish at ilie June 3 meet- ing in Beirut when O P E C raised its production ceiling for the OPEC-10 by 2 mbd to 25.5 mbd from July 1, and by a 11 A R - A R D I N T E R N A T I ( ) N A t. R E V 1 E W • W i n t e r 2005 THE PERFECT STORM: OPEC AND THE WORLD OIL MARKET further 500 Icilobarrels per day (kbd) from August I. This was a compromise between Saudi Arabia, which wanted an immediate increase to 26 mhd, and Tr;in, which would initially only accept 2S.5 mhd. T h e measures were instituted "to ensure adequate supply and give a clear signal of OPF.Cs commitment to market stability and to maintaining prices at acceptable levels tt) botli producers and consumers," according to a June 7 O P E C eommuniqtie. Actual OPEC-10 output was reported as 26 reduced to about one mhd in Saudi /Vrabia, O P E C sought
- 10. to remedy high prices by antiouncing an increase in its production ceiling from 26 to 27 mbd effective November 1. Ihis was more a signal than an actual change because current production from the OPEC-10 was already known to be 28 mhd. Despite interest by several members, a ilccision was postponed on whether to raise the price hand, whicb by this point had become irrelevant. Naimi clearly opposed the raise, "OPEC ACTIONS TO INCREASE PRODUCTION HAVE NOT BFFN SUFFICIENTTO DAMPEN THE PRICE ESCALATION, WHICH...UNCHECKED,WILL SLOW ECONOMIC GROWTH AND DIMINISH FUTURE OIL DEMAND." mbd in April increa.singtoabout27 mbd injune, with Saudi .'Vrahia increasing to 9.1 mbd. Asa result, remaining O P E C spare capacity was significantly reduced to about one mbd in Saudi Arabia, and only a small amount in perhaps two other producer nations, limiting the ability to deal with any future supply disruptions. Very tight market conditions continued in the summer of 2004, reinforced by continuing high oil demand and geopo- litical uncertainty. In July, the IEA increased its oil demand projection for the year by an additional 2.5 mbd. O P E C canceled its July meeting but proceeiled with its planned August increase in supply of 500,000 barrels to a ceiling of 26 mbd. Yet OPEC actions were insufficient to prevent liirther price increases. Tlie WTT oil price moved above USS40 per barrel in July and hit record highs of US$44.7.? on August 5 and US$48.75 on August 19.^
- 11. Among the factors increasing the risk premium was continuing uncertainty' ahout the future of Yukos, the Rus- sian oil company that normally produces 1.8 mbd, after it was threatened with a government take-over because of tax evasion charges. T h e insurgence in Iraq heated up and spread to the oil-rich southern regions with attacks on the South Oil C]onipany pipelines. US oi! inventories were still low compared sith demand. Refineries continued at peak production. And there was continuing concern about the small OPEC; spare capacity (between one and 1.5 mbd) to meet any supply disruption. Sauili Arabia continued to defend tbe price band. But other countries, including Iran, Nigeria, and Venezuela, were content with oil prices in the US$30 to US$4() range. Faced with continuing high prices, O P E C was in a weak position at its St-'ptcmbcr 15 meeting. With spare capacity' saying it should only be raised if there was a structural change in the market. Sauiii Arai>ia, now producing 9.5 mbd. did announce just before the meeting tliat it would add 800,000 barrels per day of production capacity in two new fields by the end of September. Kuwait is also planning;! more mod- est expansion. The W T l crude price fell slightl)' after the meeting to USS43.58, influenced by a report ofa decline in US crude oil stocks and by oil rig shutdowns in the Gulf of Mexico because of Hurricane Ivan. OPEC Finances OPEC^ has benefited greatly from increased oil export revenues in the past two years as a result of higher oil prices and expanded produciion. I n j u n e 2004, the Energy In- formation Administration projected O P E C net oil export revenues for 2004 at US$286 billion, up from US$240 bil- lion in 2003 and US$195 billion in 2002. These revenues
- 12. have helped OPEC^ in its recovery from the price collapse of 1998 and 1999. However, adjusting for inflation and rapid population growth, OPEC!] has much lower per capita income today (USS53O projected for 2004) than in the peak days ofthe late 1970.S and early 1980s (USSl,691 in real [ler capita export revenues in 19S0). It should be noted that many countries are heavily indebted from the period of lower oil priees from the mid-198()s to the late 1990s. And many OPEC, countries are moving slowly on necessary economic reforms. Saudi .rabia, OPEC's largest oil producer and a leader in O P E C production decisions, will probabl)' earn US$100 billion from oil export revenues in 2004 based on average oil production of 8.7 mbd. Earnings for 2003 were USS86 billion. Last year, Saudi Arabia experienced healthy gross V V i m o r 2 0 0 5 • T I . K K D I N I" K R N A I 1 (> N A L R K V ! K. VV [ T T Fuel tor ilujuglu ENERGY domestric product (GDP) growth and a government sur- plus, greatly iniproing the countrjs econtjmic situation. However, Saudi Arabia's 200.3 surplus was only the second surplus in the past 20 years, during which time the govern- ment ran deficits and trade iml)al;uices. Total government debt has been nearly 100 percent of GDP. Surpluses in 2003 and 2004 are expected to i)e used to increase foreign assets and p;i off some government debt. In Saudi .Vialiia, oil exports contribute over 90 percent of ex^iort earnings, 70 to 80 percent of state revenues, and about 40 percent of (7nP. Oil export revenues per capita were about US$.^6^i3 in 2003,
- 13. which in real terms is much lower than the per capita figure for 19H0 at the high point of oil prices (US$22). Saudi jVrabia continues to face serious economic chal- lenges of fast population growth (about 3 percent per year) and high uiiumplcninent (15 to 20 percent.) More reccntK, the threat ot domestic terrorism has provided a new challenge and will require more government spending on security. Oi! price volatility makes Saudi state planning difficult, as the income varies yearly. T he large fmaneial needs of tlic state CRUDE CAPITAL 5OO The figure above depicts the per capita revenue for crude oil exports in OPEC countries.AII prices are adjusted to the val- ue of the 2004 US dollar. Because many OPEC countries are experiencing population growth, the per capita revenue does not follow the general rise in total export revenue shown on page 7O.The increasing population size has created additional demands on the government for public service expenses.This also does not take into account the actual distribution of the export revenues, which are frequently concentrated in a few hands as opposed to the growing population. Energy Information Administration have heen estimated to require a stable oil price of T.'S$30 per barrel, whicli helps explain recent Saudi reluctance at OPKC; meetings to press for lower oil prices. Other O P E C members face similar challenges with e en larger populations and heft)' financial needs. The only exceptions are Kuwait and the United Arab Emirates, whicb have small populations and large G D P per capita.
- 14. A Clumsy Cartel ()PF.C proiluction cuts in 2002 were reasonably effective at restoring oil prices to the price hand after die shock and price collapse following the September 11 attacks. In 2003, after effectiv'ely raising production to account for the strikes in ene7Aiela and the loss (jf production in Iraq during the war, (^PEC sharply cut production injune and Septemher before Iraq's production could Fully recover. I h e cartel seenieti unwilling to allow sufficient stock- building to stabilize the market. This shortage helped drive the price ahovc the price haml by the enil of the year. In 2004, O P E C misread the market and cut production again al- though demand was increasing. Deepening instabilit)' in Iraq anti low spare capatitv' increased political risks in the minds of traders as oil prices soared above USS40 per barrel. Stock traders in New York, London, and Singapore,, guidetl b̂ both economic fimdamcntals and geopolitical risks, ultimately set the price ot oil. In recent months the risk premium on the oil price may have grown to USSlO to L'SSI.^ per barrel, OPEC actions to increase jirodiiction have not been sufticicnt to dampen ihe price escalation, which if left unchecked, will slow economic growth and diminish future oil demand. O P E C continues to be liampcrcd by the lact that as a group of sovereign countries, it has no enforcement mecha- nism. Therefore, exceeding quotas is a constant problem w hich undermines its efforts to manage the market. The financial needs of Saudi Arabia and other O P E C countries ajipear to require oil prices well alir)c (he price hand, as reflected in the debate ahout raising the hand. et the members have postponed making a decision about whether to aiimit this and thisdela" has undermined OPEC's market
- 15. credibility'. It is hard to believe continuing Saudi statements that they would he content with an oil price at US$25 per harrel for the O P E C basket w hen the- clearl arc not press- ing to achieve this and tlieir iinancial needs demand a higher price. OPEC^ cannot control sudden shifts in demand or gL'<)i>()iitical risks. The oil market is dJlhcuU to manage, and OPI'X; has limited instruments and otten imperiect data. OPEC^ continues, as Massachusetts Institute of Technology economics professor Morris Adelman once put it, to act like a "clumsy cartel." IB , 7 2 1 I . R V . R D I N I K R N A T I O N W L R E V I E W • W i n t e r 2 0 0 5 a s the global account manager position is very complex, companies need a specific breed of manager in this position. The desired characteristics and skills for a GAM will differ in each company and even each account situation, but in general there is a set of skills most companies like to see in their GAMs. A survey of more than 200 companies by the Strategic Account Management Association and Sales Research Trust identified 10 GAM competencies in descending order of importance: 1. Communication skills 2. Global team leadership and management
- 16. skills 3. Business and financial acumen 4. Relationship management skills 5. Strategic vision and planning capabilities 6. Problem-solving capabilities 7. Cultural empathy 8. Selling skills, both internally and externally 9. Industry and market knowledge of one’s company and customer 10. Product/service knowledge The desired competencies, added with account- specific desired characteristics, would create a rather impressive list of requirements in a job vacancy advertisement. Many companies state that it is hard to find people who fit all these requirements, and therefore companies often have to choose people who need to grow into the GAM position and develop the required skills after obtaining it. Even though knowledge of the industry and product are respectively Nos. 9 and 10 on the SAMA/SRT list above, these two points often lead companies to choose an existing employee to fill the GAM position. An existing employee has the benefit of knowing the products, the industry and sometimes even to some extent the account.
- 17. Furthermore, an insider will have the head start of knowing other people in the different departments of his organization, which will make it easier to create the necessary network of relationships. Obviously an outside candidate for a GAM position could have competencies that far outweigh the benefits of choosing an existing employee. Especially when a supplier is able to hire a customer’s former employee, there will be similar benefits to appointing an existing supplier employee—but the benefits materialize at the other end of the relationship dyad. Royal Dutch Shell PLC’s GAM for Wärtsilä Corp. is a former Wärtsilä employee based close to his former employer’s headquarters in Finland. The relationship contact manager at Wärtsilä explained how pleased he was with having an ex-colleague as GAM for his company. “This person speaks our language—not just the editor’s note: this article is an adapted excerpt from Managing Global Customers: An Integrated Approach (oxford University Press USA, 2007), by George S. yip and Audrey J.M. Bink. V e l o c i t y ® • • � 5 • • Q 1 � 0 0 8 Copyright© �008 StrategiC aCCount ManageMent aSSoCiation. all rightS reServed. reproduCtion or diStribution without expreSSed perMiSSion iS StriCtly prohibited. Key characteristics
- 18. and skills of global account managers As the globAl Account mAnAger position is very complex, compAnies need A specific breed of mAnAger in this position. Finnish language but also the company language. He understands what is important for us, and that gives him the opportunity to offer us a customer value proposition that is exactly what we need.” On the other hand, The Regus Group PLC, a leading worldwide office rental company, uses mainly homegrown GAMs, as it finds it hard to recruit the right people from outside Regus. Even though it is not always possible to find a GAM with all the necessary competencies, some characteristics are particularly interesting when looking at the position and will be discussed in the rest of this article. They are cultural sensitivity, flexibility, location, seniority and experience. Cultural sensitivity Cultures differ not only between countries but also between companies.
- 19. Due to the border-crossing nature of the GAM position, both in a geographic and corporate sense, the GAM needs some feeling for the cultures involved and a high level of cultural empathy. He has to be at ease working within different cultures and have the knowledge to handle this in an effective way. Knowledge about the cultures in different countries where the customer operates can make the difference between having a strong relationship and facing a lot of frustration in trying to make a deal but not getting there. Initially it is most important to have thorough knowledge about the culture of the customer’s home country, as this will to some extent influence the culture of the account itself. Especially when companies work with a large number of expatriates from their home country, the home country culture can have a major influence. A GAM serving German technology company Bosch Corp. commented that because this customer has many German expatriates at middle- and high-level management positions in its 50 countries of operations, there is a distinct German culture in the company, which means agreements should always be observed and work needs to be done thoroughly. So a GAM who deals with Bosch needs to be sensitive to this culture and able to help the local supplier
- 20. contacts adhere to it, as it might clash with the supplier’s own local culture. flexibility To be able to seize all opportunities available with the global account, a GAM needs to be flexible. Most GAMs spend a considerable amount of their time outside their home country, notably when they are not based in the country of their customer’s headquarters. If a candidate GAM is not willing to travel this frequently, he should seriously reconsider applying for the position. Another form of flexibility is being able to stay as a constant factor for the account, even during times of organizational change. In terms of length of tenure, it is obviously wise not to change a particular account’s GAM too often. Many companies say five years is the period they aim to have the same GAM on an account. Most firms undergo regular organizational changes, but the customer will have no interest in the internal changes of its supplier. A GAM needs to ensure that the supplier’s internal changes do not overly influence the way of doing business with the customer. location
- 21. The GAM’s geographic location is an important strategic decision. Even though the account is supposed to be global, there will be locations that are more important than others, and the country of the customer’s headquarters will be a significantly important place for having local contact. Some companies do not enjoy the luxury of having local activity and enough sales support in all possible countries, so they must fall back on having all their GAMs in one or two central locations. Most companies, however, try to locate the GAM as close as possible to the nation of the customer’s headquarters. This has the benefit of easing frequent personal contact with the customer’s global relationship managers. The downside is that in some cases the GAM might lose V e l o c i t y ® • • � � • • Q 1 � 0 0 8 Copyright© �008 StrategiC aCCount ManageMent aSSoCiation. all rightS reServed. reproduCtion or diStribution without expreSSed perMiSSion iS StriCtly prohibited. the desired competencies, Added with Account-specific desired chArActeristics, would creAte A rAther impressive list of requirements in A job vAcAncy Advertisement. direct connection with and therefore influence on the central resources of his own company.
- 22. Hewlett-Packard Co. bridges this gap by installing two versions of GAM. First, HP locates the key GAM at the country of the customer’s headquarters. And secondly, HP has a headquarters account manager who is responsible for representing the global account at HP’s headquarters in California. This way, there is good balance between having a local presence with the global customer and having power and influence at the supplier on a central level. Sometimes economics influences the choice of location. For cost reasons and because of its Asian heritage, Standard Chartered PLC, a major U.K.-based international bank, locates in Singapore many of its GAMs who serve European customers. seniority As a GAM will need to influence other departments and colleagues without having actual authority over them, it is beneficial to give him some level of seniority. Possessing a certain level of experience and natural pre-eminence will make it easier for the GAM to get other employees on board if something has to be arranged for the global account, even without being their direct line manager. In many cases the desired track record of a successful account manager or experience with the required accounts for this position will ensure that the
- 23. chosen candidate has some seniority, but it helps to keep in mind why this is important. Another reason seniority is preferable is the consideration of turnover time for GAMs at any one account. As mentioned, many companies prefer to have a GAM in place at each account for approximately five years. Managers at the start of their career mostly aim to change positions much more often than that to climb the career ladder and gain experience. A senior manager will be more likely to stay in the position for the desired five years, working on the long-term development of the relationship, and less likely to pursue short-term career goals. Consider the Xerox Corp. GAM for Volkswagen AG. With 25 years of Volkswagen-related experience under his belt, he has earned the knowledge and seniority needed to deal with such a big, important client, and he is less likely to change positions within a short time than a younger, less experienced colleague. experience T he G A M’s experience and background are very important to account management success. Even though he is essentially an account manager, a sales background is not necessarily required.
- 24. As mentioned earlier, the actual sales responsibilities are only a small part of the total job description. Although many sales skills – such as negotiation skills and business and financial acumen – will be required to successfully fill the position, other attributes might be just as important. The GAM’s experience within the account company’s industry or, even better, at the company itself can be especially beneficial in building the knowledge base he needs to successfully manage the account. For instance, Xerox sees suitable experience and background as an important part of desired GA M characteristics. The company’s current GAM for Volkswagen has been working with and for Volkswagen in different functions and companies for 25 years. This gives him a lot of valuable knowledge about the account’s company culture, industry characteristics and key employees. Another example of Xerox’s preference for a suitable background is its GAM for the British global bank HSBC Holdings PLC. His background is not in sales but finance, and his financial industry knowledge made him attractive as an account manager for financial institutions. This executive first had a brief stint as the U.K. account manager
- 25. for Lloyd’s of London, then took on the GAM position for HSBC. Conclusion When thinking about the necessary qualities a GAM should possess, managers need to focus on more than just excellent sales skills. The GAM is not an upgraded sales manager, and realizing that some non-sales qualities may be far more important will help in finding the right person for the job. Some best practices with respect to GAMs are to: • Define a set of criteria for the GAM based not only on your company’s situation but also on the specific account’s situation. • Realize that it may be impossible to find someone who meets all the criteria, but try to find someone who will be able to grow into them. • Recognize that your company, the account and the account’s industry are good hunting grounds to find a GAM with the necessary background and knowledge. • Aim to have a GAM stay in the position for approximately five years to ensure continuity and long-term relationship benefits.
- 26. • Carefully choose the GAM’s location, if possible keeping close to the account’s central operations. • Ensure that the GAM is a loyal team player not working for short-term personal gain but long-term success of the account. George S. Yip will give a presentation about structuring global account management programs at SAMA’s 44th Annual Conference in May in Dallas. Additional resources For more information on this subject in SAMA’s library, the editors recommend: David Bowerin, “Managing Global Customers: An Integrated Approach,” Velocity®, Vol. 9, No. 4, Fall 2007, www.strategicaccounts.org; and Christoph Senn, “Making GAM a mission possible,” Pan- European Conference, Feb. 26, 2007, www. strategicaccounts.org. V e l o c i t y ® • • � � • • Q 1 � 0 0 8 Copyright© �008 StrategiC aCCount ManageMent aSSoCiation. all rightS reServed. reproduCtion or diStribution without expreSSed perMiSSion iS StriCtly prohibited. the gAm is not An upgrAded sAles mAnAger.