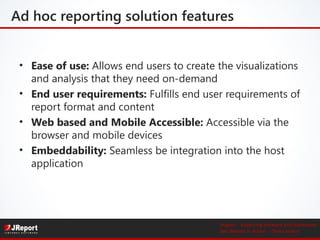
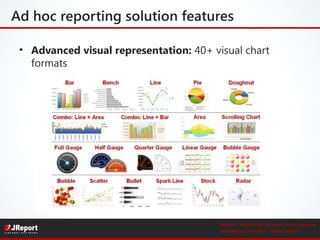
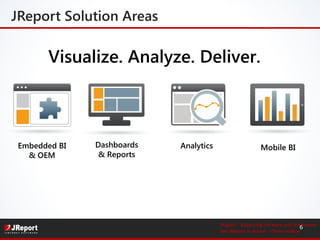
Ad hoc Reporting

Boney Pandya

Product Marketing
Ad Hoc Reporting
Ad hoc: ”improvised” or “impromptu”
Ad Hoc Reporting Example
A large financial institution with many financial
representatives, each with their own territory. With ad
hoc reporting, financial reps can create their own reports
displaying their goals, new transactions, number of client
visits, etc. Thus, reps can easily create the custom reports
that they need for themselves or to share with others,
from the same or different data source.

JReport - Reporting software and dashboard
See JReport in Action – Demo Videos
Benefits of Ad hoc reporting
• Self Service: Created by end users
• Little dependence on IT: Little to no assistance needed
from IT
• Deep data analytics: Gives end users the power to sort,
filter, drag and drop, use cross tabs, labels etc
• Web based report generation: Reports available on
browser and smartphones

JReport - Reporting software and dashboard
See JReport in Action – Demo Videos
Ad hoc reporting solution features
• Ease of use: Allows end users to create the visualizations
and analysis that they need on-demand
• End user requirements: Fulfills end user requirements of
report format and content
• Web based and Mobile Accessible: Accessible via the
browser and mobile devices
• Embeddability: Seamless be integration into the host
application

JReport - Reporting software and dashboard
See JReport in Action – Demo Videos
Ad hoc reporting solution features
• Advanced visual representation: 40+ visual chart
formats

JReport - Reporting software and dashboard
See JReport in Action – Demo Videos
JReport Solution Areas

Visualize. Analyze. Deliver.

Embedded BI
& OEM

Dashboards
& Reports

Analytics

Mobile BI

JReport - Reporting software and dashboard
6
See JReport in Action – Demo Videos
Ad hoc reporting with JReport
Report Wizard – step by step
−Flexible data sources
−Sort, filter, link to reports,
drill into details, expand/collapse groups
−Themes, profiles, print layouts
−Security and Governance
−Set up one-click interactions

Visual Analysis – agile
−View as you go
−Quickly shift your data view
−Change dimensions, measures,
chart types on the fly
JReport - Reporting software and dashboard
7
See JReport in Action – Demo Videos
JDashboard: Interactive Visualization
Easily drag/drop from library
Reuse reports, components, analytics
3rd party widgets e.g. Google Maps
Sort, filter, drill, pivot, slice-n-dice,
parameters, export
− Synchronized refresh
− HTML5
−
−
−
−

JReport - Reporting software and dashboard
8
See JReport in Action – Demo Videos
Interactive Data Exploration
Link Report

Conditional Formatting

Drill on Chart

On-Screen Filters

Customize Parameters

Interaction among
components

JReport - Reporting software and dashboard
9
See JReport in Action – Demo Videos
Live Charts
Motion Charts

Real-time Charts

Scrollable Charts

JReport - Reporting software and dashboard
10
See JReport in Action – Demo Videos
Web Delivery
Sophisticated Reporting
− Page/Web reports, wide array of
styles, pixel-perfect capable, reusable
components, parameters

Scalable Delivery
− High volume on-demand and
scheduled reports

Anytime, Anywhere
− Access reports and dashboards on
Web and mobile devices
− Deliver in any format: Web, PDF, Excel,
email, fax, FTP, …
− Retain real chart data in Excel

JReport - Reporting software and dashboard
11
See JReport in Action – Demo Videos
JReport Mobile
Visualization, Anywhere
−
−
−
−
−
−

Browser and native iOS implementation
Support mobile device gestures
Scrollable component navigation
Convertible chart types
Rich interactions: filter, sort, drill, pivot
Free from the Apple App Store

JReport - Reporting software and dashboard
12
See JReport in Action – Demo Videos
Global Customer Base
Financial
Services

Consumer /
Manufacturing

Telecom

Healthcare /
Healthcare
Insurance

ISV/OEM

Government

JReport - Reporting software and dashboard
13
See JReport in Action – Demo Videos
Next Steps
• Try Ad hoc reporting with JReport 12
Download from jinfonet.com

• Daily live demo on JReport
Every weekday at 2 PM ET – Register Here

• Watch demo videos on ad hoc reporting
Ad Hoc reporting demo videos and more – Click here

• For more info, visit: www.jinfonet.com
E-mail: bpandya@jinfonet.com, gregharris@jinfonet.com
Sales: sales@jinfonet.com, Phone: (240) 477-1000
JReport - Reporting software and dashboard
14
See JReport in Action – Demo Videos

Ad hoc reporting and analysis

  • 1.
    Ad hoc Reporting BoneyPandya Product Marketing
  • 2.
    Ad Hoc Reporting Adhoc: ”improvised” or “impromptu” Ad Hoc Reporting Example A large financial institution with many financial representatives, each with their own territory. With ad hoc reporting, financial reps can create their own reports displaying their goals, new transactions, number of client visits, etc. Thus, reps can easily create the custom reports that they need for themselves or to share with others, from the same or different data source. JReport - Reporting software and dashboard See JReport in Action – Demo Videos
  • 3.
    Benefits of Adhoc reporting • Self Service: Created by end users • Little dependence on IT: Little to no assistance needed from IT • Deep data analytics: Gives end users the power to sort, filter, drag and drop, use cross tabs, labels etc • Web based report generation: Reports available on browser and smartphones JReport - Reporting software and dashboard See JReport in Action – Demo Videos
  • 4.
    Ad hoc reportingsolution features • Ease of use: Allows end users to create the visualizations and analysis that they need on-demand • End user requirements: Fulfills end user requirements of report format and content • Web based and Mobile Accessible: Accessible via the browser and mobile devices • Embeddability: Seamless be integration into the host application JReport - Reporting software and dashboard See JReport in Action – Demo Videos
  • 5.
    Ad hoc reportingsolution features • Advanced visual representation: 40+ visual chart formats JReport - Reporting software and dashboard See JReport in Action – Demo Videos
  • 6.
    JReport Solution Areas Visualize.Analyze. Deliver. Embedded BI & OEM Dashboards & Reports Analytics Mobile BI JReport - Reporting software and dashboard 6 See JReport in Action – Demo Videos
  • 7.
    Ad hoc reportingwith JReport Report Wizard – step by step −Flexible data sources −Sort, filter, link to reports, drill into details, expand/collapse groups −Themes, profiles, print layouts −Security and Governance −Set up one-click interactions Visual Analysis – agile −View as you go −Quickly shift your data view −Change dimensions, measures, chart types on the fly JReport - Reporting software and dashboard 7 See JReport in Action – Demo Videos
  • 8.
    JDashboard: Interactive Visualization Easilydrag/drop from library Reuse reports, components, analytics 3rd party widgets e.g. Google Maps Sort, filter, drill, pivot, slice-n-dice, parameters, export − Synchronized refresh − HTML5 − − − − JReport - Reporting software and dashboard 8 See JReport in Action – Demo Videos
  • 9.
    Interactive Data Exploration LinkReport Conditional Formatting Drill on Chart On-Screen Filters Customize Parameters Interaction among components JReport - Reporting software and dashboard 9 See JReport in Action – Demo Videos
  • 10.
    Live Charts Motion Charts Real-timeCharts Scrollable Charts JReport - Reporting software and dashboard 10 See JReport in Action – Demo Videos
  • 11.
    Web Delivery Sophisticated Reporting −Page/Web reports, wide array of styles, pixel-perfect capable, reusable components, parameters Scalable Delivery − High volume on-demand and scheduled reports Anytime, Anywhere − Access reports and dashboards on Web and mobile devices − Deliver in any format: Web, PDF, Excel, email, fax, FTP, … − Retain real chart data in Excel JReport - Reporting software and dashboard 11 See JReport in Action – Demo Videos
  • 12.
    JReport Mobile Visualization, Anywhere − − − − − − Browserand native iOS implementation Support mobile device gestures Scrollable component navigation Convertible chart types Rich interactions: filter, sort, drill, pivot Free from the Apple App Store JReport - Reporting software and dashboard 12 See JReport in Action – Demo Videos
  • 13.
    Global Customer Base Financial Services Consumer/ Manufacturing Telecom Healthcare / Healthcare Insurance ISV/OEM Government JReport - Reporting software and dashboard 13 See JReport in Action – Demo Videos
  • 14.
    Next Steps • TryAd hoc reporting with JReport 12 Download from jinfonet.com • Daily live demo on JReport Every weekday at 2 PM ET – Register Here • Watch demo videos on ad hoc reporting Ad Hoc reporting demo videos and more – Click here • For more info, visit: www.jinfonet.com E-mail: bpandya@jinfonet.com, gregharris@jinfonet.com Sales: sales@jinfonet.com, Phone: (240) 477-1000 JReport - Reporting software and dashboard 14 See JReport in Action – Demo Videos

Editor's Notes

  • #2 Use the wrong icons for the four solutions. Didn't explain VA enough.. just read it Explaining Synchronized refresh wasn't smooth You over-explained the Excel stuff Don't say Real-time charts and Mobile stuff are self-explanatory Global customer base slide wasn't too smooth, and not brief You keep thanking ppl… like four times Transition from video back to slides wasn't smooth
  • #8 Visual Analysis: Touch your data Fast because of in-memory cubes
  • #9 JDashboard Drag and drop dashboard design Easy to integrate with 3rd party widgets such as Google maps Both Flash and AJAX charts, tables and crosstabs Flexible Software Development Kit JReport includes an API for every action that can be created in the product Designer API allows the application to dynamically modify templates Catalog API allows the application to dynamically modify data connections Server API allows the application to call all reporting functions directly from the application Server RMI API allows the application to call all reporting functions from a remote host Tutorials, code samples and JavaDocs make using the API easy to learn
  • #10 Visual data isn’t just pretty charts, it needs to be usable for taking action. JReport provides this capability with many options for filters, links, drilldowns and built in hierarchies such as country, state, zip that easily allows the user to explore the data to determine root cause and take action. JReport charts are fully interactive allowing the user to change chart types, switch between charts and crosstabs, dynamically create tables using the data from the charts and much more.
  • #12 JDashboard Drag and drop dashboard design Easy to integrate with 3rd party widgets such as Google maps Both Flash and AJAX charts, tables and crosstabs Flexible Software Development Kit JReport includes an API for every action that can be created in the product Designer API allows the application to dynamically modify templates Catalog API allows the application to dynamically modify data connections Server API allows the application to call all reporting functions directly from the application Server RMI API allows the application to call all reporting functions from a remote host Tutorials, code samples and JavaDocs make using the API easy to learn
  • #14 In spite of owning Cognos, IBM still embeds JReport in the following four products: IBM Infosphere IBM: Lotus Learning Management IBM: Tivoli IBM Netcool Configuration Manager The reason they use JReport is the ease of integration, customization and the ease of use for their customers to quickly and easily get what they need. Target JReport enables access to product lifecycle reports via a highly customized web interface for buyers at target headquarters Utilized by thousands of Target employees and vendors JReport provides ability to access databases at multiple levels and locations Visa Reports run on more than 1200 commercial card holder accounts (CCHA) Each CCHA has +/- one million card holders, each getting numerous personalized reports/year Visa Small Business has more than 15,000 companies running JReport Fail-safe, clustered technology serves massive mission-critical IRS reports
  • #15 Availability Join our JReport 12 Beta program, contact us Use integration as opportunity to mentioned we are delivering enterprise solution, has to work with enterprise systems. Need to make sure everything all works together. Maintain exact look and feel of the application Totally Seamless Transparent interface for end users Quick Access Connects to any data source API for application embedding: Runs in any application server: Tomcat, JBoss, Websphere… Single jar file installation Advantages to using JReport to embed BI into your application: So one of the main reasons is that you’re able to leverage your existing infrastructure. It’s not like you have to buy a new dedicated server with a huge number of CPU’s and huge amount of memory so you can run JReport. The footprint is very lightweight and it can run natively within your existing hardware.