Benchmark sportsgrounds Australia
•
1 like•172 views

Remote sensing of sports grounds

Recommended
Recommended
More Related Content
What's hot
What's hot (20)
Similar to Benchmark sportsgrounds Australia
Similar to Benchmark sportsgrounds Australia (20)
More from Gilba Solutions Pty Ltd
More from Gilba Solutions Pty Ltd (20)
Recently uploaded
Recently uploaded (20)
Benchmark sportsgrounds Australia
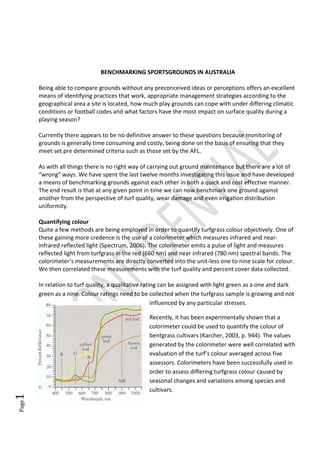
- 1. Page1 BENCHMARKING SPORTSGROUNDS IN AUSTRALIA Being able to compare grounds without any preconceived ideas or perceptions offers an excellent means of identifying practices that work, appropriate management strategies according to the geographical area a site is located, how much play grounds can cope with under differing climatic conditions or football codes and what factors have the most impact on surface quality during a playing season? Currently there appears to be no definitive answer to these questions because monitoring of grounds is generally time consuming and costly, being done on the basis of ensuring that they meet set pre determined criteria such as those set by the AFL. As with all things there is no right way of carrying out ground maintenance but there are a lot of “wrong” ways. We have spent the last twelve months investigating this issue and have developed a means of benchmarking grounds against each other in both a quick and cost effective manner. The end result is that at any given point in time we can now benchmark one ground against another from the perspective of turf quality, wear damage and even irrigation distribution uniformity. Quantifying colour Quite a few methods are being employed in order to quantify turfgrass colour objectively. One of these gaining more credence is the use of a colorimeter which measures infrared and near- infrared reflected light (Spectrum, 2006). The colorimeter emits a pulse of light and measures reflected light from turfgrass in the red (660 nm) and near infrared (780 nm) spectral bands. The colorimeter’s measurements are directly converted into the unit-less one to nine scale for colour. We then correlated these measurements with the turf quality and percent cover data collected. In relation to turf quality, a qualitative rating can be assigned with light green as a one and dark green as a nine. Colour ratings need to be collected when the turfgrass sample is growing and not influenced by any particular stresses. Recently, it has been experimentally shown that a colorimeter could be used to quantify the colour of bentgrass cultivars (Karcher, 2003, p. 944). The values generated by the colorimeter were well correlated with evaluation of the turf’s colour averaged across five assessors. Colorimeters have been successfully used in order to assess differing turfgrass colour caused by seasonal changes and variations among species and cultivars.
- 2. Page2 Actively growing plants therefore show a strong contrast between strong absorption in the red and high reflectance in the near-infrared regions of the spectrum. The amount of absorption in the red and reflectance in the near-infrared varies with both the type of vegetation and the vigour of the plants. The natural change of a green leaf as it senesces is shown in Figure 1. We see that the healthy green leaf has very low reflectance values in the red (600-700 nm) due to chlorophyll absorption and very high reflectance values in the near-infrared (700-1000 nm). However, as the plant begins to senesce, reflectance begins to decrease in the near-infrared and increase in the red. One way of characterizing this relationship with a single variable is by dividing the near-infrared reflectance by the red reflectance (NIR/Red). The larger this ratio, the more photo-synthetically active vegetation is present; the lower the ratio, the less photosynthetically active vegetation present. Because these ratio values will vary considerably from one region to another, a way of normalizing the ratio is called the Normalized Difference Vegetation Index or NDVI. NDVI = (NIR – Red) / (NIR + Red). The NDVI has been related to biophysical parameters like vegetation density, percent green vegetation cover, biomass, fraction of absorbed photosynthetically active radiation (PAR) and leaf area index (LAI). The relationships of NDVI and a biophysical parameter are often site specific and vary with the soil and vegetation optical properties (e.g. leaf spectra, leaf angle distribution, plant architecture). If there is no vegetation, the NDVI values are lowest for bright soils, and are generally higher for dark soils with high organic matter contents. We can therefore use this information to evaluate vegetation type, condition, or density and it is this relationship, which lead us to commence a study which ran over the 2009 football season. Soil Moisture Maximized use of irrigation and rainwater is critical for proper turf management, especially where water supplies or water quality are not ideal for turf. Water use is determined by many factors, including weather, irrigation technology, budgetary constraints, turf maintenance practices, topography and soil conditions. The turf manager’s ability to monitor soil water status is also important. Measuring soil moisture content is one of the most effective ways to time irrigation amount and frequency. Proper irrigation timing is, in turn, one of the best ways to promote turf health.
- 3. Page3 Proper irrigation produces strong root zones and the highest turf quality. Improper irrigation can increase water consumption, soil erosion, disease pressure and lead to a loss of vital nutrients in the root zone. All of these factors contribute to higher maintenance costs for the property owner and cause headaches for the turf manager. The ability to anticipate and efficiently prepare for future drought conditions is essential. Detecting soil moisture problems farther in advance with greater accuracy and improved geo- referenced detail will be the crucial factor in making irrigation management decisions. Distribution Uniformity or DU is a measure of how uniformly water is applied to the area being watered, expressed as a percentage. Traditionally the accepted methology for calculating sprinkler system performance has been to use catch can tests. This measures the actual precipitation rate for each sprinkler zone and provides a measurement of how uniformly water is distributed by the sprinklers comparing the average of the lowest quarter of readings to the overall average of the readings. Commonly this is called the Lowest Quarter Distribution Uniformity of DULQ. The DULQ is in turn used to calculate the irrigation water requirement to meet the plant water requirement in the driest parts of the sprinkler zone. However, this method generally over estimates the irrigation water requirement because it does not account for what happens to the drop of water when it comes in contact with the thatch or the soil. The higher the DU, the better the performance of the system. If all samples are equal, the DU is 100%. If a proportion of the area greater than 25% receives zero application the DU will be 0%. There is no universal value of DU for satisfactory system performance but generally a value 70-80% is considered acceptable. Obviously there must be good DU, before there can be good irrigation efficiency, if the turf is to be sufficiently watered. If distribution is poor then areas may be over watered and others under-
- 4. Page4 watered. This may lead to an increase in irrigation volume which may increase waterlogging in localised areas and associated issues such as Poa annua invasion or disease etc. A different and newer method for determining the efficiency of the irrigation system other than using catch cans is to determine the efficiency of the system by using a Time-Domain Reflectometer (TDR) to record the soil moisture. A distribution uniformity calculation can then be carried out from the recorded soil moisture data. A similar process as discussed earlier is used to compute the DULQ of the soil moisture data. The data is ranked from lowest to highest soil moisture content. The average of the lowest quarter of readings is divided by the overall average. The result is presented as a percent. The value of this calculation, compared to the catch can DULQ, is that it is a measure of water in the soil profile as opposed to water applied to the turf surface. Factors such as compaction, thatch, slope, and moisture re-distribution can cause the variability pattern to be very different between the application (catch can) and soil moisture measurements. The use of Time Domain Refractometry (TDR) has become increasingly accepted as being an accurate means of determining volumetric moisture content over the last decade. TDR measures the electrical properties of a given volume of soil. The volumetric soil moisture content (VMC) of the soil is proportional to its dielectric constant as measured by TDR. Electromagnetic waves are propagated along a wave guide, so by timing their return the dielectric constant of the soil is determined. It has been shown that the dielectric constant is strongly correlated to soil moisture content, with little effects from texture, material, temperature or salinity. Thus, water content in the surrounding media can be determined (Topp et.al., 1980). Based on the results gained the VMC% can then be compared to the theoretical field capacity and wilt point for a specific soil type, and thus it is possible to gauge much more accurately whether a soil is being over or under-watered.
- 5. Page5 Methology Throughout the 2009 NRL season regular NDVI and moisture readings were taken to determine the impact of wear on surface quality and the existing moisture status on a number of grounds on the eastern seaboard on Australia. This comprised travelling a 10metre x 8 metre grid over the entire playing surface with readings being recorded and mapped using a GPS unit. The same monitoring protocols were followed for both NDVI measurement and moisture monitoring. In the case of the latter short 7.5cm tines were used to record volumetric soil moisture content (VMC%) with this being logged using a Time Domain Refractrometer (TDR). Following this proprietary mapping software was used to create visual images of the surface at that time. The results gained were then graphically represented as both comparative NDVI, soil moisture and distribution uniformity readings. In the case of the NDVI and moisture maps the darker the colour of green in the case of NDVI and blue in the case of the moisture readings the higher the turf quality or soil moisture content respectively.
- 6. Page6 The end result is the development of a database for grounds throughout NSW, one ground in Canberra, one in Newcastle and one in QLD which enables grounds to be mapped and then benchmarked vs existing grounds in the database. This is not meant as a tool to enable direct comparisons between say a top NRL ground such as Skilled Park on the Gold Coast, and a council ground in Sydney (although this is possible), but instead enables turf managers to be able to interact and through the exchange of results and ideas be better able to determine what strategies at say these respective venues are working and which are not. Results The results gained are shown below graphically and also in tabular form. Quality/VMC % Colour Legend Low NDVI Moisture High
- 7. Page7 NDVI Readings Minimum Maximum Average NDVI mean 0.37 0.78 0.66 NDVI highest readings achieved 0.694 0.807 0.742 NDVI lowest readings achieved 0.167 0.755 0.586 Experience of using the NDVI technology in the field has lead to our establishing that low readings are generally associated with bare or thin vegetative coverage i.e. high wear areas give low readings. The graphical representation below in Figure 2 clearly shows that Knox Grammar and also Skilled Stadium on the Gold Coast in August 2009 after were showing the lowest readings. Both of these results can be explained as being directly associated with excessive wear. In the case of Knox these readings were directly related to the main entry point onto the surface which was subjected to excessive traffic. In the case of Skilled Stadium these readings were a combination of excessive use (it was being used by the Titans, Gold Coast United, and also for training by both). Between March-August 2009 there had already occurred 67 hours of training which equates to 3.35 hours a week on average. Bearing in mind that UK figures determine a two hour football/rugby training session to equate to 1 game then these figures change dramatically when the actual games played is also taken into consideration. Event Games Time (weeks) Hours per week Training March - August 67 20 weeks 3.35 Games March - August 32 20 weeks 1.6 Intense period May-July 13 8 weeks 1.625 The data gained from Skilled Stadium was especially useful as in fact two sets of data were taken. One in March and the other in August 2009. As the graph below shows we were able to quantify a deterioration in surface quality over this time period. Since March 2009 there was a significant deterioration in the overall quality of the playing surface with the major issues being a 13% decrease in the mean over this period and rather more worryingly a 67.2% decrease in the minimum levels recorded thus indicating that the heavily worn areas were in fact showing further deterioration.
- 8. Page8 Figure 2. Graph showing change in turf quality/health from March to August 2009 on Skilled Stadium playing surface. When the images generated using GPS functionality are examined it can be seen that significant variation existed in the March results, with even though the southern end of the ground showing recovery from a disease incidence, the readings still being better than those gained in August. 0.586 0.67 0.167 0.511 0.804 0.792 0 0.1 0.2 0.3 0.4 0.5 0.6 0.7 0.8 0.9 August 2009 Mar-09 Average reading Minimum value Maximum value
- 9. Page9 Colour Legend 0.511 to 0.546 0.546 to 0.581 0.581 to 0.616 0.616 to 0.651 0.651 to 0.687 0.687 to 0.722 0.722 to 0.757 0.757 to 0.792 Colour Legend 0.167 to 0.247 0.247 to 0.326 0.326 to 0.406 0.406 to 0.486 0.486 to 0.565 0.565 to 0.645 0.645 to 0.724 0.724 to 0.804
- 10. 0.000 0.100 0.200 0.300 0.400 0.500 0.600 0.700 0.800 0.900 Figure 2. NDVI readings for a selection of sporting grounds throughout NSW, VIC and QLD Minimum NDVI Average NDVI Maximum NDVI
- 11. Page11 Moisture readings The following work has all been done on existing swards over the last 18 months on a variety of venues, soil and turf types. The table below summarises the results gained over this period. Distribution Uniformity Variability in irrigation coverage and its impact on soil moisture is vitally important if effective irrigation is to occur to turf. The table below shows a classification for distribution uniformity. Based on the above figures for distribution uniformity (DU) the minimum reading gained from the monitored sites was categorised as being between poor to fair. The average reading over all the sites was categorised as between very good to excellent and the highest reading achieved was categorised as excellent. The overall results gained are shown in Figure 3. Minimum % Maximum % Average Distribution Uniformity 59.97 84.48 73 Volumetric moisture content % 18.3 50.4 32.05 Type Excellent % Very Good % Good % Fair % Poor % Rotor impact 80 70 65 60 50
- 12. Figure 4. Distribution Uniformity and mean volumetric moisture content for a selection of grounds throughout NSW, VIC, ACT and QLD 0.00 10.00 20.00 30.00 40.00 50.00 60.00 70.00 80.00 90.00 70.98 50.4 Distribution Uniformity Average Moisture
- 13. Page13 Implications of results A number of interesting implications have come from these initial results such as it immediately becoming apparent that precision irrigation of many areas does not actually occur and if it does do there appears to be little attempt to relate distribution uniformity with the soil moisture content. A case in point with the results was Parliament House in Canberra where a distribution uniformity categorised as very good existed in conjunction with a volumetric moisture content of 50.4%. The latter figure was of particular interest as this indicated a huge potential for over watering until it is realised that the site is predominantly cool season turf in contrast to every other site which was composed predominantly of warm season couch or kikuyu. This strongly implies that this benchmarking approach is currently far from perfect as familiarity with specific sites is still a vital prerequisite in making any informed decision. However if all relevant data is available some pretty useful conclusions relevant to turf quality, wear and water use efficiency can be made specific to specific sites, and this can in turn can then be related to other grounds. The end result is the development of a database for grounds throughout Australia which establishes the basis for benchmarking general grounds/turf areas vs existing grounds in the database. This is not meant as a tool to enable direct comparisons between say a top NRL ground such as Skilled Park on the Gold Coast, and a council ground in Sydney (although this is possible), but instead enables turf managers to be able to interact and through the exchange of results and ideas be better able to determine what strategies at say these respective venues are working and which are not. References Baker SW 1991a. Temporal variation of selected mechanical properties of natural turf football pitches. J. Sports Turf Res. Inst. 67:83-92. Baker SW, Gibbs RJ and Adams WA 1992 Case studies of the performance of different designs of winter games pitches. I. Playing quality and usage. J. Sports Turf Res. lnst. 68:20-32. Baker SW and. Hacker JW 1988 The use of peat in a Prunty-Mulqueen sand carpet construction: effects of application rate and depth. J. Sports Turf Res. Inst. 64:87-98. Beard JB 1973. Turfgrass: Science and culture. Prentice-Hall, Englewood Cliffs, NJ. Bell MJ and Holmes G 1988 The playing quality of Association Football pitches. J. Sports Turf Res. lnst. 64:19-47. Canaway PM 1992. The effect of two rootzone amendments on cover and playing quality of a sand profile construction for football. J. Sports Turf Res. lnst. 68:50-61.
- 14. Page14 Canaway PM and Baker SW 1993 Soil and turf properties governing play. International Turfgrass Society Research Journal. 7:192-200 Cereti CF Reyneri A Bruno G, Leto A, Maggiore T, Martiniello TP, Ziliotto TPU, Volterran M, An Italian Survey of pitches for soccer 2004, Acta Hort 661:117-121 Duble RL 2006 The Sports Turf of the South: Bermudagrass. www.plantanswers.tamu.edu/turf/publications/bermuda.html. Accessed July 08, 2006. Handreck KA and Black N 1992 Growing media for ornamental plants and turf, pp223, Hacker JW Wear tolerance in amenity and sports turf: A review 1980-85 http://www.actahort.org/members/showpdf?booknrarnr=195_4 Karcher DE and Richardson MD, 2003, Quantifying Turfgrass Color Using Digital Image Analysis, Crop Science 43:943-951 (2003) © 2003 Crop Science Society of America Rogers JN. and Waddington DV 1993. Present Status of Quantification of Sports Turf Surface Characteristics in North America. International Turfgrass Society Research Journal. 7:231-237. Sanderson WW 1979. Football field game plan can help reduce injuries. Athl Purch and Facil 4(5):54. Topp, G.C., J.L.Davis, and A.P.Annan. 1980. Electromagnetic determination of soil water content: Measurements in coaxial transmission lines. Water Resources Research 16: 574-582 Waddington DV McNitt AS and LandschootPJ 1997 Constructing and maintaining safe playing surfaces," In: Safety in Baseball and Softball, ASTM Special Technical Publication 1313, Earl F. Hoerner and Frances A. Cosgrave, Eds., American Society for Testing and Materials, p. 107-113. Wilcox, H Fox H and Beyer R. 1965. Safer athletic fields. Athl. J. 45(10):34.