Kodo Millet PPT made by Ghanshyam bairwa college of Agriculture kumher bhara...
IMPACT OF USE OF TECHNOLOGY IN MATHEMATICS LESSONS ON STUDE.docx
1. IMPACT OF USE OF TECHNOLOGY IN MATHEMATICS
LESSONS ON STUDENT ACHIEVEMENT AND ATTITUDES
RAMADAN EYYAM AND HÜSEYİN S. YARATAN
Eastern Mediterranean University
Technology use in classrooms in today’s world is believed to
have a positive impact on
students’ success and their attitudes towards lessons. In this
study we investigated students’
attitudes towards technology use in class and whether the use of
technology improved their
academic achievement. A quasiexperimental research design
was used and we assigned
3 groups as experimental groups (n = 41) and 2 as control
groups (n = 41). Mathematics
was selected as the subject to be studied. All groups completed
a pretest and a posttest. For
the experimental groups, lessons were designed using several
technological tools, whereas
lessons for control groups were taught using traditional teaching
methods. At the end of the
study, the experimental groups completed a scale to investigate
the preferences and attitudes
of the students in regard to technology-based instruction. One-
way ANCOVA was used to
evaluate the differences in posttest results, which revealed that
the mathematics posttest
results of the students who were instructed using technology
were significantly higher than
the posttest results of the groups who were instructed without
technology. Results showed
3. implemented classes,
interactive student involvement in the learning process is
fostered, and learning
becomes more fun and more attractive for the students
(Smaldino, Russell,
Heinich & Molenda, 2005).
As stated by numerous researchers (e.g., Alessi & Trollip, 2001;
Ashburn &
Floden, 2006; Bitter & Pierson, 2005; Egbert, 2009,
Januszweski & Molenda,
2008; Jonassen, Howland, Marra, & Crismond, 2008; Kent,
2008; Lever-Duffy,
McDonald, & Mizell, 2005; Wiske et al., 2005) and it is an
inevitable fact
that, in learning environments where educational technology is
integrated into
instruction, both students and teachers experience benefits from
using it. As
Smaldino et al. (2005) noted, the use of technology in
instruction enhances not
only the learning capabilities of students but also their
motivation; thus, students
are more engaged in the learning process.
Barron, Ivers, Lilavois, and Wells (2006) stated: “Technology
provides an
excellent avenue for student motivation, exploration, and
instruction” (p. 17);
it is also obligatory to consider the teachers who are the actual
users of such
technology and the groundwork that consists of the necessary
aids, training, and
equipment (Ashburn & Floden, 2005; Sandholtz, Ringstaff, &
Dwyer, 1997). It
has become evident that teaching, learning, and technology
4. work synergistically
to provide effective and efficient knowledge transfer because
educational
technology helps teachers create learning contexts that were not
previously
possible with traditional teaching methods (Wiske et al., 2005).
Bitter and Pierson (2005) stated: “A recent meta-analysis
demonstrated that
students using technology had modest but positive gains in
learning outcomes
over those students who used no technology” (p. 107).
Likewise, Bates and
Poole (2003) observed: “…technology does not reduce the need
for imaginative,
creative thinking about teaching and learning; indeed, it
increases the need.
Technology opens up a vast range of opportunities for
imaginative, creative
teaching …” (p. 178).
Additionally, it is believed that when technology is used
appropriately in
classroom instruction, it has a very positive impact on student
achievement or
success. Moreover, using technology in education or teaching
helps teachers
provide immediate feedback to students and motivates active
student learning,
collaboration, and cooperation. It also helps teachers provide
individualized
learning opportunities and flexibility for their students.
In this regard Kelly and McAnear (2002) stated:
To live, learn and work successfully in an increasingly complex
and in-
5. formation-rich society, students and teachers must use
technology effectively.
Within a sound educational setting, technology can enable
students to
become:
• Capable information technology users
USE OF TECHNOLOGY IN MATHEMATICS 33
• Information seekers, analyzers, and evaluators
• Problem solvers and decision makers
• Creative and effective users of productivity tools
• Communicators, collaborators, publishers, and producers
• Informed, responsible, and contributing citizens. (p. 4).
Hawkes and Cambre (2001) stated: “Technology presents new
opportunities
for students and teachers that can be organizational,
instructional, individual,
procedural, and cultural…” (p. 1). The authors continued by
stating that
technology has an impact if learners understand and experience
the main purpose
of technology. They also pointed out that one of the main points
that has to be
taken into consideration by schools is the necessity to prepare
students for the
changing world in which technology plays an enormous part.
Baek, Jung, and Kim (2008) asserted that many researchers
agree that using
technology is an efficient cognitive tool and instructional
media. They also
suggested: “Technology can be helpful in classroom settings by
6. encouraging
inquiry, helping communication, constructing teaching products,
and assisting
students’ self-expression” (p. 1). Thus, it has been suggested by
scholars that
using technology, or integrating technology into a classroom,
enhances teaching
and helps students learn how to broaden their perspectives, and
provides a better
learning environment by bringing the world into the classroom.
Educational technology can be defined in many different ways
and many
scholars have provided various definitions (Bates & Poole,
2003; Battista,
1978; Jonassen, Howland, Moore, & Marra, 2003; Newby,
Stepich, Lehman, &
Russell, 2006; Seels & Richey, 1994; Smaldino et al., 2005).
However, the most
comprehensive definition of educational technology has come
from Seels and
Richey (1994) who wrote: “Instructional technology is the
theory and practice of
design, development, utilization, management, and evaluation of
processes and
resources for learning” (p. 9).
In order to prepare students for the future and help them learn
how to think,
learn, and gain different perspectives, technology has to be
integrated into the
classroom. It is undeniable that technology has a great impact
on every aspect
of modern life. As Türkmen (2006) stated, children today need
the learning
media now available to become engaged in the learning process.
7. Newby et
al. (2006) contributed to this discussion and extended it, saying:
“Educational
technology includes tangible tools (high-tech hardware such as
computers,
and instructional media such as overhead transparencies and
videotapes) as
well as other technologies (methods, techniques, and activities)
for planning,
implementing, and evaluating effective learning experiences”
(p. 22). Hence,
for effective learning experiences and motivation educators now
believe that
using different, and appropriate, forms of technology in
classrooms is necessary.
Therefore, in this study we investigated whether or not the use
of appropriate
USE OF TECHNOLOGY IN MATHEMATICS34
forms of educational technology had a positive effect on
attitudes and enhanced
the achievement of students. As a starting point, we chose
mathematics as the
subject to investigate this topic.
The Cyprus Turkish educational system has recently been
updated, and, in
addition to introducing learner-centered instruction, integration
of technology
in the teaching-learning process has also been prescribed
(Cyprus Turkish
National Education System, 2005). However, no experimental
study has yet
8. been conducted to provide local evidence that educational
technology enriches
learning experiences and student success in Cyprus. Although
the basics of the
new formal educational system seem clear, understandable, and
appropriate
on paper, it is unfortunate that most of the proposed procedures
have not been
completely accepted by schools and that the implementation of
technology in
schools is very limited. This could have resulted from the fact
that the Ministry
forced this program to be implemented without either preparing
additional
infrastructure or providing necessary in-service training to
teachers who are the
actual users of the technology; or it may have resulted from a
lack of necessary
aids, equipment, and resources. Above all, within this context
there is no primary
evidence that educational technology does, in fact, enhance
achievement and
have a positive effect on attitudes among students.
Considering the poor integration of technology into the updated
educational
system in North Cyprus, it is important to investigate the
reasons that technology
has not been implemented in classes as expected by society. But
prior to an
investigation of these reasons, it was vital to know whether or
not the use of
technology does improve student achievement. In addition,
investigation of the
attitudes of students towards the use of technology in this
education system was
9. also important as the perception of students has an influence on
the effectiveness
of technology use.
Therefore, in this study conducted in a private school in Cyprus,
we
investigated whether of not the use of technology in the
classroom enhanced
the achievement of seventh grade students in mathematics
lessons, and whether
or not these students had a positive attitude towards technology
use in class. To
investigate the effects on student achievement of using
educational technology in
mathematics lessons, we set the following research questions:
a) What is the effect of using educational technology in
mathematics lessons
on student achievement?
b) What is the attitude of students towards instruction in which
educational
technology is employed?
Method
We used a quasiexperimental design that involved selecting
groups without
USE OF TECHNOLOGY IN MATHEMATICS 35
any random preselection process to investigate the two research
questions.
In the private secondary school in which we conducted this
10. study all seventh
grade students had been placed in four heterogeneous classes
and the school
administration did not allow any changes in these groups for our
study. For their
mathematics lessons, we randomly selected three of these
classes (n = 41) to
form the experimental group and the remaining two classes (n =
41) were taken
as the control group. Because of the method of assigning
students to classes, it
was evident to us that, across these classes as they had been
formed, the aptitude
levels of the students were different. Hence, our preference for
a quasiex-
perimental design.
Design
We chose mathematics as the subject area to be investigated. In
the classes,
all groups completed a pretest at the beginning of instruction
and a posttest
after instruction. In the experimental groups, we provided the
teachers with
instructional technology to be used while teaching, whereas the
control groups
were taught by traditional methods, with no technology being
used.
The topics being taught in the mathematics lessons were
completely new
to the learners. We provided teachers who regularly teach these
lessons at the
school with the lesson plans, all necessary materials, and pre-
and posttests. We
11. designed the lessons carefully, according to Gagne’s nine
instructional events
(Gredler, 2005; Reigeluth, 1987). The only difference in the
design of the lessons
for the experimental and control groups was that technology
was included in
the lessons for the experimental groups, whereas no technology
was used in
the design of lessons for control groups. A laptop with
multimedia and a data
projector were used in experimental groups, and the lessons
were transferred to
PowerPoint slides and videos, pictures, flash cards, animations,
and so on. These
technological aids were provided with the aims of increasing
student motivation,
making learning more meaningful and enjoyable, maximizing
visualization
and maintaining students’ attention on the lesson. Consequently,
neither books
nor the handouts prepared by the teachers were used during the
lessons for the
experimental groups.
Measures
Pretest and posttest. These tests were prepared by obtaining
expert opinion.
The pretest for mathematics, which was in an open-ended
question format,
comprised 10 questions, and it was used to assess the prior
knowledge of students
about the geometry topics that they would be studying during
the lessons that
formed our research. Students were asked to read each question
and write their
12. answers in the space provided below the question. The posttest
had the same
format and topics as the pretest.
USE OF TECHNOLOGY IN MATHEMATICS36
Educational Technology Perception Scale (ETPS). We prepared
a two-factor
educational technology perception scale and the experimental
group completed
this in order to investigate the students’ attitudes towards
technology use in
class and their preferences in this regard. The scale consists of
11 items, and the
students were asked to state their opinions on a 3-point scale
with Yes receiving
a rating of 2, Indecisive = 1, and No = 0.
Sample items are: “The lessons are fun when the teacher uses a
computer and
data projector in the lesson,” and “I participate in lessons when
the teacher uses
a computer and data projector in the lesson.”
We analyzed the data by means of a principal component
analysis (PCA),
with direct oblimin rotation. Indicators of factorability were
good. The Kaiser-
Meyer-Olkin (KMO) Measure of Sampling Adequacy was .88,
which is greater
than the cut-off value of .70. Furthermore, Bartlett’s Test of
Sphericity yielded
a significant result, F2 (55) = 435.43, p = .000 < .01, which
showed that the
13. correlation matrix of measured variables was significantly
different from an
identity matrix; in other words, items were sufficiently
correlated to load on the
components of the measure. Two components with an
eigenvalue of greater than
1.0 were found.
1 2 3 4 5 6 7 8 9 10 11
Component number
6
5
4
3
2
1
0
E
ig
en
va
lu
e
14. Figure 1. Scree plot for components of the measure.
In the scree plot there were two components in the sharp
descending part of the
plot (see Figure 1). The loadings of the two factors of Attitudes
of Students and
Preference of Students are presented in Table 1. Items 6, 4, 5, 7,
8, and 10 were
loaded on the Attitude of Students factor and items 2, 11, 1, and
9 were loaded
on the Preference of Students factor.
USE OF TECHNOLOGY IN MATHEMATICS 37
Table 1. Items Representing Attitudes and Preferences of
Students
Attitudes Preferences
ITEM 6 .832
ITEM 4 .779
ITEM 5 .771
ITEM 3 .755
ITEM 7 .521
ITEM 8 .513
ITEM 10 .490
ITEM 2 .917
ITEM 11 .755
ITEM 1 .639
ITEM 9 .426
For the measure, we computed the Cronbach’s alpha (D) value
for the internal
consistency estimate of reliability, and the computed value was
15. .91 for the whole
scale, for the attitude items the Cronbach’s alpha value (D) was
.88, and for the
preference items the Cronbach’s value (D) was .77, indicating
that the measure
had good reliability.
Results
We conducted an analysis of covariance (ANCOVA) to find
answers to
the research question “What is the effect of using educational
technology in
mathematics lessons on student achievement?” The progress
scores of students
were calculated by subtracting their pretest scores from their
posttest scores.
Then, we used descriptive statistics to find out how the progress
scores of the
students were distributed. As shown in Table 2, progress scores
satisfied the
criteria for a normal distribution because both skewness (.257)
and kurtosis
(-.812) of the distribution were between -1.0 and +1.0 (Bluman,
2004). We took
student report scores for mathematics from the previous term as
the covariant in
the ANCOVA and we analyzed these for skewness (-.100) and
kurtosis (-.301),
and the results of this analysis also satisfied the criteria for a
normal distribution.
Table 2. Students’ Previous Term Scores and Progress Scores
n Min. Max. M SD Skewness Kurtosis
16. Previous term scores 82 24.25 90.50 63.29 15.01 -.100 -.301
Progress scores 76 -1.00 10.00 3.78 2.77 .257 -.812
We conducted a test of homogeneity of slopes in order to test
the assumption
about whether the relationship between the previous term scores
and the progress
USE OF TECHNOLOGY IN MATHEMATICS38
scores differed significantly as a function of the independent
variable of the
group, F(1, 72) = 2.39, p = .127 > .01. As can be seen in Table
3, the result
of this test was not significant; hence, it could be assumed that
the slopes are
homogeneous. Therefore, a one-way ANCOVA could be
conducted.
Table 3. Test of Homogeneity of Slopes Results
Source SS df MS F Sig. Partial Eta Squared
Previous Term Scores 23.641 1 23.641 3.385 .070 .013
Group * Previous Term Scores 16.670 1 16.670 2.387 .127 .032
Error 502.785 72 6.983
Total 1664.250 76
Note. R2 = .128 (Adjusted R2 = .092).
We conducted a one-way ANCOVA, and the progress scores of
the students
were adjusted using the previous term’s scores. As can be seen
in Table 4,
17. the effect of the covariate has effectively been removed from
the data of the
experimental and control groups. When the mean scores of the
groups are
examined, it is possible to say that the results of the
experimental groups were
better than those of the control groups.
Table 4. Adjusted Mean of Progress Scores of Student Groups
n Actual M Adjusted M
Experimental Group 38 3.07 3.13
Control Group 38 4.49 4.43
As can be seen in Table 5, after adjusting the progress test
scores, there was a
significant difference between the experimental and control
groups, F(1, 73) =
7.12, p = .024 > .05). In other words, the use of technology in
the lessons with
the experimental groups resulted in these students receiving
higher scores in their
mathematics tests.
Table 5. ANCOVA Results for the Difference Between
Experimental and Control Groups
Source SS df MS F Sig. Partial Eta Squared
Previous term scores 24.972 1 24.97 3.509 .065 .046
Group 37.822 1 37.82 5.315 .024 .068
Error 519.456 73 7.12
Total 1664.250 76
Note. R2 = .099 (Adjusted R2 = .075).
18. USE OF TECHNOLOGY IN MATHEMATICS 39
Using the Educational Technology Perception Scale (ETPS), we
analyzed data
collected from the students who had been learning in an
educational-technology-
blended environment to find answers to the second research
question, “What is
the attitude of students towards instruction in which educational
technology is
employed?”
In order to assess students’ attitudes and preferences we
computed the mean
score of each of these two components for every participating
student. As can
be seen in Table 6, nearly half of the students were indecisive in
their attitude
towards use of technology, nearly one third of the group liked
using educational
technology in class; but just over a quarter of the students
expressed negative
attitudes towards using educational technology. In terms of
preference, nearly
half of the students preferred the use of educational technology
in class, only
16.5% of them did not prefer the use of technology, and just
over one third of
them were indecisive.
Table 6. Descriptive Statistics of Data Collected by ETPS
Attitudes of Students Preferences of Students
19. f % f %
No 21 26.6 13 16.5
Indecisive 34 43.0 28 35.4
Yes 24 30.4 38 48.1
Total 79 100.0 79 100.0
Discussion and Conclusion
We expected that the use of educational technology in
mathematics lessons
would have a positive effect on student success and, after
analyzing the collected
data, it is possible to conclude that these expectations were met.
In addition, the students who took part in the study expressed
quite positive
attitudes towards the use of educational technology. According
to the analysis
conducted with the mean results of the performance of students,
the use of
educational technology had a positive effect on their
performance, and the impact
of the use of technology can be seen in the students’ progress
results. Although
many researchers have investigated the understanding of
learners in mathematics
lessons, for example, Mji and Makgato (2006), Kotzé (2007),
and Bansilal and
Naidoo (2012), the effect of the use of educational technology
has not been
investigated extensively.
In the present study, we prepared a specific scale (ETPS) in
order to gather
information from the learners about their attitudes about, and
20. preferences in
regard to, the use of educational technology in mathematics
lessons.
USE OF TECHNOLOGY IN MATHEMATICS40
A significant number of students were indecisive about their
preference.
This might be attributed to the fact that, because technology
was not used even
occasionally in class, they were not familiar with this kind of
instruction and,
therefore, did not have negative perceptions about its use. As
can be seen, a large
percentage of the students were indecisive about whether or not
they liked the use
of educational technology in mathematics lessons. When
educational technology
is used, this is a tremendous change from the traditional method
of teaching.
People are resistant to change, and this was the first time these
students had
received instruction using educational technology; this may be
the reason that
they did not decide in favor of this kind of instruction. Hence, a
longer period
of time should be allowed for the use of technology, and this
scale should be
readministered at the end of this period to determine if there is
then a reduction
in the number of students whose response is that they are
indecisive about use
of technology. After getting used to this kind of instruction, we
expect that most
21. of the indecisive students and even some of the students who
answered that they
did not like the use of technology in our study, would be in
favor of the use of
educational technology in mathematics lessons. Thus, further
research should be
conducted to consolidate our findings.
According to our results, many of the students preferred to be in
a class where
educational technology was used, but they were not sure
whether it would help
them become more successful in the class. In addition, students’
responses
indicated that they did not have a negative perception of
technology use in the
class. We expect that, as the students had a positive perception
of the use of
educational technology in class, continuous use of educational
technology would
change their attitudes towards its use.
As education systems are not perfect, from time to time they are
reviewed in
order to provide better education for learners. Similar to the
Turkish Republic
of Northern Cyprus (TRNC) education system, the South
African curriculum
has recently been reviewed as set out in the South African
National Curriculum
Statement (Mwakapenda, 2008). The present situation in regard
to the TRNC
education system is not promising in terms of using technology
in classrooms
(İşman & Yaratan, 2004; Yaratan & Kural, 2010). One of the
major constraints
22. is the lack of necessary equipment in schools. Another
important point to be
considered is that teachers are not well trained in integrating
technology into
classroom instruction. To overcome these problems, it will be
necessary to
incorporate use of technology into teacher training and to
supply teachers with
the necessary information, aids, and equipment useful to the
process of providing
a better education by means of educational technology.
Our study exploring student success with the use of educational
technology
was conducted using mathematics as the subject, and it could be
repeated with
other school subjects. The findings in our study can shed light
on the use of
USE OF TECHNOLOGY IN MATHEMATICS 41
educational technology for teaching mathematics in similar
education systems
around the globe, in order to encourage education
administrators to implement
use of educational technology in mathematics lessons.
References
Alessi, S. M., & Trollip, S. R. (2001). Multimedia for learning:
Methods and development (3rd ed.).
Needham Heights, MA: Allyn & Bacon.
Ashburn, E. A., & Floden, R. E. (2006). Meaningful learning
23. using technology: What educators need
to know and do. New York: Teachers’ College Press.
Baek, Y., Jung, J., & Kim, B. (2008). What makes teachers use
technology in the classroom?
Exploring the factors affecting facilitation of technology with a
Korean sample. Computers &
Education, 50, 224-234.
Bansilal, S., & Naidoo, J. (2012). Learners engaging with
transformation geometry. South African
Journal of Education, 32, 26-39.
Barron, A. E., Ivers, K. S., Lilavois, N., & Wells, J. A. (2006).
Technologies for education: A practical
guide (5th ed.). Santa Barbara, CA: Libraries Unlimited.
Bates, A. W., & Poole, G. (2003). Effective teaching with
technology in higher education:
Foundations for success. San Francisco, CA: Jossey-Bass.
Battista, M. S. (1978). The effect of instructional technology
and learner characteristics on cognitive
achievement in college accounting. The Accounting Review, 53,
477-485.
Bitter, G. G., & Pierson, M. E. (2005). Using technology in the
classroom (6th ed.). New York:
Pearson Education.
Bluman, A. G. (2004). Elementary statistics: A step by step
approach (5th ed.). Boston, MA:
McGraw-Hill.
Egbert, J. L. (2009). Supporting learning with technology:
Essentials of classroom practice. Upper
24. Saddle River, NJ: Pearson Education.
Gredler, M. E. (2005). Learning and instruction: Theory into
practice (5th ed.). Upper Saddle River,
NJ: Pearson Merrill Prentice Hall.
Hawkes, M., & Cambre, M. (2001). Educational technology:
Identifying the effects. Principal
Leadership, 1, 48-51. (ERIC Document Reproduction Service
No. EJ630818)
İşman, A., & Yaratan, H. S. (2004). How technology is
integrated into math education. In R. Ferdig
et al. (Eds.), Proceedings of Society for Information Technology
& Teacher Education Conference
(pp. 4453-4457). Chesapeake, VA: AACE.
Januszweski, A., & Molenda, M. (2008). Educational
technology: A definition with commentary.
New York: Routledge, Taylor & Francis Group.
Jonassen, D. H., Howland, J., Marra, R. M., & Crismond, D.
(2008). Meaningful learning with
technology (3rd ed.). Upper Saddle River, NJ: Pearson
Education.
Jonassen, D. H., Howland, J., Moore, J., & Marra, R. M. (2003).
Learning to solve problems with
technology: A constructivist perspective (2nd ed.). Upper
Saddle River, NJ: Pearson Education.
Kelly, M. G., & McAnear, A. (Eds.) (2002). National
educational technology standards for teachers:
Preparing teachers to use technology. Eugene, OR: Teacherline.
Kent, L. (2008). 6 steps to success in teaching with technology:
25. A guide to using technology in the
classroom. Bloomington, IN: iUniverse.
Kotzé, G. (2007). Investigating shape and space in mathematics:
A case study. South African Journal
of Education, 27, 19-35.
Lever-Duffy, J., McDonald, J. B., & Mizell, A. P. (2005).
Teaching and learning with technology (2nd
ed.). New York: Pearson Education.
USE OF TECHNOLOGY IN MATHEMATICS42
Mji, A., & Makgato, M. (2006). Factors associated with high
school learners’ poor performance: A
spotlight on mathematics and physical science. South African
Journal of Education, 26, 253-266.
Cyprus Turkish National Education System (2005). Kuzey
Kıbrıs Türk Cumhuriyeti Milli Eğitim
ve Kültür Bakanlığı Kıbrıs Türk Eğitim Sistemi [Cyprus Turkish
national education system] -
Brochure. Nicosia, TR: TRNC Devlet Basımevi.
Mwakapenda, W. (2008). Understanding connections in the
school mathematics curriculum. South
African Journal of Education, 28, 189-202.
Newby, T. J., Stepich, D. A., Lehman, J. D., & Russell, J. D.
(2006). Instructional technology for
teaching and learning (3rd ed.). Upper Saddle River, NJ:
Pearson Education.
Reigeluth, C. M. (Ed.) (1987). Instructional theories in action:
26. Lessons illustrating selected theories
and models. Hillsdale, NJ: Lawrence Erlbaum.
Sandholtz, J. H., Ringstaff, C., & Dwyer, D. (1997). Teaching
with technology: Creating student-
centered classrooms. New York: Teachers’ College Press.
Seels, B. B., & Richey, R. C. (1994). Instructional technology:
The definition and domains of the
field. Washington DC: Association for Educational
Communications and Technology.
Smaldino, S. E., Russell, J. D., Heinich, R., & Molenda, M.
(2005). Instructional technology and
media for learning (8th ed.). Upper Saddle River, NJ: Pearson
Education.
Türkmen, H. (2006). What technology plays supporting role in
learning cycle approach for science
education. The Turkish Online Journal of Educational
Technology, 5, 71-77.
Wiske, M. S., Franz, K. R., & Breit, L. (2005). Teaching for
understanding with technology. San
Francisco, CA: Jossey-Bass.
Yaratan, H., & Kural, C. (2010). Middle school English
language teachers’ perceptions of
instructional technology implementation in North Cyprus. The
Turkish Online Journal of
Educational Technology, 9, 161-174.
Copyright of Social Behavior & Personality: An International
Journal is the property of
27. Society for Personality Research and its content may not be
copied or emailed to multiple
sites or posted to a listserv without the copyright holder's
express written permission.
However, users may print, download, or email articles for
individual use.
Peer Review Group Evaluation Form
After you are done reviewing your other group members’
papers, take a minute to fill out this group member evaluation
form to let me know how the other students in your group are
participating.
Your Name:
Group Members’ Names:
Group member 1 Name:
Did s/he get your review in a timely manner?
Was the feedback thorough?
Did s/he respond to all the questions on the peer review sheet?
Group member 2 Name:
Did s/he get your review in a timely manner?
Was the feedback thorough?
28. Did s/he respond to all the questions on the peer review sheet?
Group member 3 Name:
Did s/he get your review in a timely manner?
Was the feedback thorough?
Did s/he respond to all the questions on the peer review sheet?
McAleese 1
Emily McAleese
Tigger Warnings in American Universities
Many higher education institutions in America have
adopted policies regarding trigger warnings. Trigger warnings is
a broad term that can be adopted to mean different things for
different people. Generally, trigger warnings are supposed to be
a warning to students about the content that will be discussed in
a reading or lecture due to the sensitive nature of the material.
There are many misconceptions about the purpose and use of
trigger warnings. It is my personal belief that trigger warnings
should be disclosed when sensitive material will be covered in a
class. This belief stems from the ideas that all students should
feel comfortable in a classroom and should never be caught off
guard by a topic that could cause anxiety or mental anguish.
Many courses cover sensitive topics; there is no doubt in
29. whether they should be discussed. Professors should actively
communicate to students what will be covered in order to allow
students to be prepared and make adjustments if necessary.
Greg Lukianoff and Jonathan Haidt wrote an article entitled
“The Coddling of the American Mind” that describes how
millennial students are prone to a sensitive world in the age of
peanut butter fee classrooms and zero tolerance bullying
policies. Lukianoff and Haidt basically call the use of trigger
warnings in classrooms a student sought movement to maintain
a campus free from awkward and challenging topics that could
offend or discomfort. These authors are quick to condemn
trigger warnings because trigger warnings are said to hinder
discussion and protect students from real world situations
(Haidt, Lukianoff “The Coddling of the American Mind”).
However, the use of trigger warnings is to promote a learning
environment where students can learn in a way so that they are
not prone to panic attacks and other anxiety induces habits. If
something like this was to arise, then students are only focusing
on the anxiety and therefore not learning or participating.
Having a notice of a sensitive before a class allows a student to
prepare for the topics at hand.
These claims made by Haidt and Lukianoff are directly
combatted in Kate Manne’s article “Why I Use Trigger
Warnings”. Manne speaks to the benefit of trigger warnings and
even the necessity of their use. Manne explains that it is
inevitable that many of her students have experienced some sort
of trauma. Students vulnerable to the topics presented are able
to adequately prepare themselves for a topic when trigger
warnings are provided. It is difficult to predict how a student
may respond to a sensitive topic. People are always on a
recovery journey and people are different places will react in
different ways. Very often, if caught off guard a student will be
unable to focus, participate, and may even have a severe
reaction like a panic attack. This is not a way to facilitate
learning. These reactions can all be avoided with a few simple
words compiled together to make up a trigger warning (Manne,
30. Why I Use Trigger Warnings).
Both articles discuss the use of trigger warnings when it comes
to controversial topics such as religion and politics. Manne
points out in her article that this is not the desired use of trigger
warnings. The use of trigger warnings is to allow an
environment where personal panic and trauma related hysteria
are not induced (Manne, Why I Use Trigger Warnings). This
idea of political correctness should not even play into the use of
trigger warnings. The goal to create a class that avoids upsetting
students that have experienced personal trauma should be a
given in higher learning. While political correctness is also a
prominent university topic, the goal of trigger warnings is not
to be sensitive to other people’s beliefs. The use of trigger
warnings is to be aware that traumas are very prevalent in
student’s lives. Adding to the trauma and reinstating a memory
or thought of that trauma is not the goal of learning.
Nathan Heller writes “The Big Uneasy” to explore a liberal arts
college’s stance on issues like trigger warnings. He spoke to a
student at Oberlin named Eosphoros. This student compares
ingredients on a food list to trigger warnings. Eosphoros states,
"People should have the right to know and consent to what
they're putting into their minds, just as they have the right to
know and consent to what they're putting into their bodies
(Heller, The Big Uneasy)." A transparency in the topics being
discussed is very simple, yet has received so much criticism.
Consequently, so did the movement to put ingredient lists on
consumer products. Perhaps there is a correlation between the
two. The hunger for knowledge is certainly alive and well
among Millennials. However, the Millennials do plea for it to
be on their own terms. The terms being for an advance notice on
class discussion and lecture.
Ingrid Sturgis’s article featured in the Chronicle of Higher
Education interviews university professors and how they view
trigger warnings. One professor interview in “WARNING: This
Lesson May Upset You” says that providing content warnings
are on the rise and they should be. Scott Hammond at Utah State
31. University shares that it is his moral obligation to his student
population to provide a welcoming academic community. This
can only be achieved when he is fully communicating to his
students the topics being discussed. Finding alternative readings
or videos for students disturbed by a specific topic is something
Hammond offers to his students. Being sensitive that students
react to material in different ways is a simple assertion that not
everyone has had the same experiences and background. The
student population is continually getting more diverse.
Additionally, campus violence and mental health are more
prominently understood (Sturgis, WARNING: This Lesson May
Upset You). Because of all these factors, trigger warnings are
encouraged to be used by university boards.
Overall, the purpose of trigger warnings is to have students be
as productive in class as they can be. Additionally, content
warnings enable instructors to facilitate learning without the
risk of catching a student dealing with emotional trauma off
guard. Trigger warnings are meant to enable people struggling
with mental health diseases to be able to rise above their illness
and fully participate in classes. The backlash against trigger
warnings comes with the stigma related to mental health.
Students with mental health illnesses are constantly struggling
with media and societal ideas that their illness is lesser or not
important enough. The simple modification of a person with a
broken leg being able to sit in a chair next to the door of the
classroom can be seen as more of a hassle than content
warnings. The simple advance notice of class plans or a few
sentences regarding the sensitive material can make all the
difference to a person dealing with trauma. There is no heavy
lifting or body moving involved.
Works Cited
Heller, Nathan. "The Big Uneasy." The New Yorker. The New
Yorker, 23 May 2016. Web. 10 Oct. 2016.
32. Lukianoff, Greg, and Jonathan Haidt. "The Coddling of the
American Mind." The Atlantic. Atlantic Media Company, Sept.
2015. Web. 10 Oct. 2016.
Manne, Kate. "Why I Use Trigger Warnings." The New York
Times. The New York Times, 19 Sept. 2015. Web. 10 Oct.
2016.
Sturgis, Ingrid. "WARNING: This Lesson May Upset You."
Chronicle of Higher Education (2016): 33-35. Religion and
Philosophy Collection. Web. 10 Oct. 2016.
Brian Wagner
The social climate of the world is ever changing. It is
dynamic and explosive and it takes one with a certain kind of
mental fortitude to understand and comprehend all opinions
with little bias. Colleges are places that allow us to earn that
ability to put ourselves into a crucible and emerge as people
capable of understanding the arguments of others no matter how
heinous and different from our own opinions they are. Yet, we
live in an era where those who feel a certain opinion is too
offensive, that people should be shielded from it, even in
intellectual institutions.
Therefore, they created safe spaces in colleges, universities, and
schools. The use of safe spaces in places of higher education
directly inhibits students from learning. We are here to look for
the truth, as adults we should be able to handle uncomfortable
information no matter if we agree or disagree with it, and we
should not place an expectation on the institution to deal with
sensitive topics since it is our personal duty to know what we
are comfortable with and push ourselves accordingly. In this
essay I’ll portray why these safe spaces really do inhibit our
education.
33. The Truth is a difficult thing to understand as it is an all-
encompassing concept. In the early advents of education, men
like Plato, Aristotle, and Socrates used their methods to
determine the truth of the world. The truth in its most basic
sense for the purpose of this essay help answer the big questions
such as “Who are we?”, “Where are we going?”, “What happens
after death?” and etc. We use this methods now and while our
knowledge has divulged as a species and we have learned so
many new things we haven’t stopped looking for the Truth. A
very important part of finding the Truth is debate and argument
as this refines our knowledge and opens us up to new opinions
regarding all kinds of world views and ideas. The construction
of safe spaces though takes students put of those debates and
hides them behind shields political correctness and kind words.
Students should not need to be coddled on their quest for the
Truth as they should have known what risks should come with
having a higher education. In an article written by Kristi Smith,
a LEARN Fellow working on teaching support, stated “Just
because your students trust you doesn’t mean they are going to
trust anyone else in your classroom. And to truly grow, they are
going to need to take emotional and intellectual risks in front
that group.” And while you can see that she does agree with the
use of safe spaces, isn’t there an inherent problem with that
thought? Students should see the necessity of taking emotional
and intellectual risks in college. Those risks are what pushes us
closer to the Truth. Students shouldn’t be given the free pass to
avoid that interaction. It only slows their individual education,
and our search as a species for the truth as a whole.
College students are treated as adults, we can drive, we
can vote and we can be drafted into the military. Therefore we
should act like adults. Being able to handle tough information is
an incredibly useful skill that as college students we must foster
and grow. Life is not easy, there aren’t happy events and
sometimes we need to talk about the hard things so that we can
learn and grow. Adulthood is a new time, where we must accept
the shortcomings of the world. As a child we learned to be kind
34. to others, not to prejudge, and love one another. Yet, that
simply isn’t the case in our world. Life isn’t that simple. People
have their own agenda, people can be cruel, people can do awful
things, and people can believe in awful things. We as adults
must move above and beyond the dogma of childhood as while
innocent, it is not the true world. There will be those who seek
to oppose what you believe and those who go against the
common morals you might have been taught.
We as college students have the special position of having
an infinite amount of information at our disposal, as well as
some of the most incredible academics of the world teaching our
courses. As adults we must use what we have been given, we
have the opportunity and it is an insult to the world to not use
it. Most of us live in a world where we can speak our minds and
not fear the repercussions, where we can love who we want and
not fear the hate, or where we can believe what we want and not
fear others. That kind of privilege gives us an opportunity as
adults that we must use to the greatest advantage. By using
these safe spaces it throws down that opportunity and tarnishes
it as those who utilize them in most cases are actively trying to
run away from the real problems of the world that you have
been given the opportunity to have the power to dispel.
With all this opportunity to begin with we should not put
the expectations of handling what is good to be said in a college
classroom setting on the professors and their leaders. Their job
is to educate us to the best of their ability. Not to decide what is
right and wrong for us to learn and/or speak about. We go to
these masters of their own respective arts and seek tutelage and
guidance, not rules on what is good concerning speaking topics
and not to insult others with our academic quandaries. In the
case of University of Chicago, they decided to tell their
incoming freshmen that safe spaces will not be used, along with
trigger warnings. In an article on The Atlantic website written
by Oliver Bateman, he references what has been going on with
the announcement by the University of Chicago. He talks about
how this could be linked to certain political climates in the area
35. along with the possible biases of donors to the school looking
for a more conservative approach to learning. Yet these all are
more or less pings for a society that is very heavy on political
views do to the coming election. What is important about this
article is a statement about what the college is able to do in
regards to the education of their students. Bateman quotes a
Professor Nathan Zimmerman in saying “The students I teach
pay tuition to the university so that I can provide a specific
service—coding skills—and in the context of my class, there’s a
financial imperative for them to acquire these valuable skills
that perhaps diminishes the sort of conflict you’d see in
humanities courses.” While yes, in these science courses one
isn’t necessarily looking for the solace of safe spaces as often
but differing views are always on the way. Who isn’t to say that
the growing use of safe spaces is not just for the deep issues of
humanities courses such as philosophy and theology, but it
expands into the fact based ideas of science courses where just
because one feels that a theory they believe is threatened, they
feel the need for a safe space to run from the possible
eventuality. The University of Chicago has the right idea when
it comes to how they treat, respect, and push their students to
overcome the world political climate at this time. Safe Spaces
aren’t really safe they are just an imaginary world were one can
feel safe and deny what is really going on, and in college and
higher learning there is no place for that.
The opportunity to learn, to understand, and be taught by
those of great reverence in their specific field. We are pursuing
higher education not just because it is profitable for us, but
because we are all looking for the truth and we must figure it
out by hearing the different feelings and opinions of others. We
aren’t in college to use safe safes to hide from the real world
and the difficult problems that perplex us every day. We aren’t
paying tuition so that some dean running the school can tell us
what we can or cannot talk about in a classroom setting. If the
topic is about the rape of a young girl, then we discuss and
debate the rape culture allowing everyone to voice their feeling
36. or opinion, the same goes with subjects that are notorious for
their ability to cause a divide among viewpoints. Politics and
religion must be discussed and not in a way inhibited by rules
regarding what can and cannot be spoken about in an academic
setting. Therefore, safe spaces aren’t safe they are just a way to
hide from the real world and have no place in an academic
setting.
Australasian Journal of Educational Technology, 2015, 31(4).
363
Modelling the intention to use technology for teaching
mathematics among pre-service teachers in Serbia
Timothy Teo
University of Macau
Verica Milutinovic
University of Kragujevac
This study aims to examine the variables that influence Serbian
pre-service teachers’ intention
to use technology to teach mathematics. Using the technology
acceptance model (TAM) as the
framework, we developed a research model to include
subjective norm, knowledge of
mathematics, and facilitating conditions as external variables to
the TAM. In addition, we
investigated the influence of gender and age on the behavioural
37. intention to use technology.
With data gathered from 313 participants using a survey
questionnaire, structural equation
modelling (SEM) analysis revealed that the proposed model in
this study has a good fit and
accounted for 5.4% of the variance in the behavioural intention
to use technology. Pre-service
teachers’ attitudes towards computers were found to be the only
factor with direct influence on
the intention to use technology. All other factors were found to
have an indirect influence.
Using multiple indicators, multiple causes (MIMIC) modelling,
pre-service teachers’ intention
to use technology was not found to be significantly different by
age and gender. Various
contributions to research and implications for teacher training
are discussed.
Introduction
In today’s world, when society is shifting from an industrial
towards an information or knowledge society, it
is important for students to develop lifelong learning skills,
often referred to as a capacity of “learning to
learn” (Anderson, 2008, p. 19). Many organisations have
implemented initiatives in education, in
mathematics in particular, to respond to the challenges in
acquiring these new skills (Anderson, 2008;
International Society for Technology in Education, 2007;
Partnership for 21st Century Skills, n.d.; United
Nations Educational, Scientific and Cultural Organization
[UNESCO], 2002). Some examples of the desired
skills for the 21st century are creativity and innovation,
communication and collaboration, research and
information fluency, critical thinking, problem solving and
38. decision making, and digital citizenship and
technology operations (International Society for Technology in
Education, 2007). In preparing for these skills,
the appropriate use of technology by teachers in education is
crucial.
Despite the strong presence of information and communication
technology (ICT) in classrooms all over the
world, studies have shown that ICT is underused (Mueller,
Wood, Willoughby, Ross, & Specht, 2008;
Ruthven, 2009). In Serbia, one reason for the low ICT usage for
teaching and learning is teachers’ lack of
sophisticated knowledge to support effective technology
integration (Kadijevich, 2012). However, this
situation is mitigated by younger teachers, who have
demonstrated their attempts at teaching mathematics in
primary and secondary schools in Serbia (Dimitrijević, Popović,
& Stanić, 2012).
Serbia is a south-eastern developing country in Europe with a
population of 7.12 million. Free education is
provided for children between ages 7 and 15 (grades 1–8) and
those between ages 15 and 19 to attend
elementary and secondary schools, respectively, although the
latter is not compulsory by law. Depending on
the grade level and subject, elementary and secondary school
teachers receive their training at the relevant
faculties in universities (UNESCO, 2011). All teachers have to
complete their training in pedagogy and
subject content at master’s level before taking up appointments
in schools. Among the goals of Serbian
education are that students across all levels should be provided
with opportunities to acquire high quality
knowledge and skills and attitudes, including linguistic,
mathematical, scientific, artistic, cultural, technical,
and computer literacy skills necessary for life in modern society
39. and develop the abilities to use ICT to find,
analyse, utilise and communicate information. In 2010, the
Serbian government initiated the Digital School
Australasian Journal of Educational Technology, 2015, 31(4).
364
Project with an aim to support the integration of technology in
education through equipping elementary
schools with computer labs for use in their studies,
extracurricular activities, and free time. Costing about 15
million euros, the key outcomes of this project were to increase
digital literacy, develop the e-skill set, and
improve teaching and learning in the primary schools. As a
result, 1,589 large elementary schools in Serbia
were equipped with modern computer labs (5 to 30 seats), while
1,321 small schools in rural areas (with
fewer than 40 students per school) were equipped with laptops
and projectors (UNESCO, 2013).
In order to prepare future teachers as change agents to achieve
educational goals, all teacher training providers
(e.g., faculties of education) are required to offer at least one
compulsory course for pre-service teachers to
acquire necessary skills in ICT and provide professional
development to support in-service teachers who are
managing the computer laboratories. However, research
indicates that the use of technology by teachers for
teaching and learning is lacking and limited to low-level
purposes. Dimitrijević et al. (2012) noted that the
40. frequency of technology usage by mathematics teachers in
Serbia for professional purposes is significantly
lower than their technology usage for private purposes. In
addition, technology is mainly used as digital
storage. Among those who use technology for teaching, younger
teachers display a higher level of aptitude
and commitment to continuing education, factors which were
found to have significant impacts on the use of
technology in teaching and learning. The authors also claim that
for effective integration of technology to take
place in the curriculum, it is critical to ensure that pre-service
teachers are well prepared prior to taking up
teaching appointments.
Literature review
Studies in technology acceptance
Researchers interested in studying ICT usage in education have
suggested low technology acceptance to be a
key factor in explaining the under-utilisation by teachers (e.g.,
Hermans, 2008; Pierce & Ball, 2009). Defined
as using technology in the way it was designed to serve,
technology acceptance research can shed light on the
predictors of teachers’ intention to use technology for teaching
(Teo, 2009).
For a long time, technology acceptance researchers have
situated their research in business contexts with the
main purpose of understanding and predicting the user’s
intention to use technology. From their efforts,
various models and theories have been proposed to examine the
key determinants that influence users’
intention to accept technology at their workplaces and for
professional purposes. In recent years, researchers
have found that the models and theories that emerged from the
41. body of research within the business contexts
could be applied to understanding technology acceptance in
educational contexts (Teo, 2013). Among the
most popular models in technology acceptance research, the
technology acceptance model (TAM) (Davis,
1989) has been found to be a robust and parsimonious model for
understanding the factors that affect users’
intention to use technology in education (Teo, 2011, 2012).
Research model
Despite the popularity of the TAM as a framework to explain
users’ intention to use technology in education,
there have been calls to extend and expand the model in order to
increase its explanatory ability to address
more sophisticated relationships in education involving
variables external to the TAM (Hermans, 2008;
Mumtaz, 2000). Various extended TAM models to explain pre-
service and teachers’ intention to use
technology have been proposed and validated in the literature
(e.g., Teo, 2009, 2010, 2011). In these, external
variables have been adopted from other theories, such as the
theory of planned behaviour (Ajzen, 1991),
unified theory of acceptance and use of technology (Venkatesh,
Morris, Davis, & Davis, 2003), and
pedagogical content knowledge (Shulman, 1986). For example,
Pynoo et al. (2012) combined the TAM and
the theory of planned behaviour to assess teachers’ acceptance
and use of a Belgian educational portal and
found that all predictor variables, subjective norm, perceived
usefulness, perceived ease of use, attitude
towards computer use and perceived behavioural control were
significant in explaining teachers’ portal
acceptance. Taking reference from the above-mentioned works,
we synthetise the variables in the TAM and
the theory of planned behaviour by including external variables
42. such as subjective norm, content knowledge
Australasian Journal of Educational Technology, 2015, 31(4).
365
and facilitating conditions; factors which have been found to
influence the core TAM variables (perceived
usefulness, perceived ease of use, attitude towards computer
use, and intention to use) to a significant degree.
TAM hypotheses
The TAM specifies the relationships among users’ perceived
usefulness, perceived ease of use, attitude
towards computer use, and their intention to use technology.
Intention to use technology is posited to be
influenced by attitude towards use, as well as the direct and
indirect effects of perceived usefulness and
perceived ease of use. In addition, perceived usefulness and
perceived ease of use jointly affect attitude
towards use. Finally, perceived ease of use is hypothesised to
have a direct effect on perceived usefulness.
From the TAM, perceived usefulness refers to the degree to
which a person believes that using a system
would enhance his/her productivity while perceived ease of use
has to do with the extent to which a person
thinks that using a system will be relatively free of effort
(Davis, 1989).
In building the model that predicts the level of technology
acceptance of pre-service teachers in Singapore,
43. Teo (2009) found, among other variables, that perceived
usefulness and attitude towards use have a direct
effect on pre-service teachers’ intention to use technology, and
perceived use of ease indirectly influences the
behavioural intention through attitude and perceived usefulness.
Chang, Yan, and Tseng (2012) provided
evidence that perceived convenience, perceived ease of use and
perceived usefulness have a significantly
positive effect on attitude towards using; and perceived
usefulness and attitude towards using have a
significantly positive effect on continuance of intention to use
English mobile learning among college
students in Taiwan.
From the above, the following hypotheses were formulated:
H1: Pre-service teachers’ perceived usefulness has a significant
influence on their behavioural intention
to use technology.
H2: Pre-service teachers’ perceived usefulness has a significant
influence on their attitude towards
computer use.
H3: Pre-service teachers’ attitude towards computer use has a
significant influence on their behavioural
intention to use technology.
H4: Pre-service teachers’ perceived use of ease has a significant
influence on their perceived usefulness.
H5: Pre-service teachers’ perceived use of ease has a significant
influence on their attitude towards
computer use.
44. Subjective norm
Drawing on the theory of reasoned action, Fishbein and Ajzen
(1975) defined subjective norm as the
perceived pressures put onto a person to perform a given
behaviour (or perform a task). In technology
acceptance studies, subjective norm reflects a person’s belief
that people who are important or significant to
him/her think he should or should not use technology. In other
words, it is the degree to which a person
perceives the demands of the important or “referent others” on
that individual to use technology. To the
sample in this study, treferent others may refer to their close
peers, professors, and university institutional
management. From the theory of planned behaviour (Ajzen,
1991) and unified theory of acceptance and use
of technology (Venkatesh et al., 2003) subjective norm (or
social influence) was hypothesised to have a direct
effect on behavioural intention and perceived usefulness.
Venkatesh and Davis (2000) argued that when a
co-worker thought that the system was useful, a person was
likely to have the same idea. In other words,
individuals can choose to perform a specific behaviour even if
they are not positive towards the behaviour or
its consequences, depending on how important they think that
the important referents believe that they should
act in a certain way (Fishbein & Ajzen 1975; Venkatesh &
Davis 2000). This was supported by Schepers and
Wetzels (2007), who meta-analysed 88 studies on the
relationship between subjective norm and the TAM
constructs. They found overwhelming evidence that showed a
significant relationship between subjective
norm and perceived usefulness, and subjective norm and
intention to use.
It is possible that individuals who perceive that others expect
that they should use technology will have a high
45. score on intentions to use technology. On examining pre-service
teachers’ attitudes to computer use with the
Australasian Journal of Educational Technology, 2015, 31(4).
366
extended TAM framework, Teo (2010) found significant
influence of subjective norm on perceived
usefulness of computers. Motaghian, Hassanzadeh, and
Moghadam (2013) used an integrated model in order
to assess instructors’ adoption of web-based learning systems
and found that subjective norm had a positive
effect on perceived usefulness. Similarly, Park (2009) found
that subjective norm was a significant factor in
affecting university students’ intention to use e-learning, in
addition to other beliefs, such as perceived
usefulness.
From the above, we formulated the following hypotheses
concerning subjective norm and TAM variables in
teaching mathematics with the use of computers:
H6: Pre-service teachers’ subjective norm has a significant
influence on their perceived usefulness.
H7: Pre-service teachers’ subjective norm has a significant
influence on their behavioural intention to use
technology.
46. Content knowledge
Shulman (1986) proposed the pedagogical content knowledge
framework to explain teachers’ subject matter
knowledge and the role it plays in teaching. This was later
expanded by Mishra and Koehler (2006) to include
technological knowledge, in addition to content knowledge and
pedagogical knowledge. Teachers who are
high on content knowledge are generally accepting of new ideas
and pedagogical conceptions in innovation
programs, such as the use of technologies for teaching and
learning (Lloyd & Wilson, 1998). Research
evidence indicates that mathematical content knowledge is
important to the effective use of technology in
mathematics teaching (Crisan, 2001). In a review of the
literature, Lagrange (1999) suggested that
mathematical knowledge and conceptualisation are dependent
on new techniques such as using new tools or
teaching in a new environment. A study by Dimitrijević et al.
(2012) found one of the main predictors of
teachers’ usage of computers in mathematics teaching in Serbia
to be their perceived level of mathematical
knowledge, that is, their average marks during the study, and
that teachers with strong academic mathematics
background were more likely to use technology in their teaching
practice. Content knowledge, as a generic
part of technological pedagogical content knowledge, could play
a very important role in teachers’ intention
to use technology in teaching mathematics (Wachira &
Keengwe, 2011).
Therefore, we formulated the following hypotheses for this
study:
H8: Pre-service teachers’ knowledge of mathematics has a
significant influence on their behavioural
47. intention to use technology.
H9: Pre-service teachers’ knowledge of mathematics has a
significant influence on their perceived ease
of use.
Facilitating conditions
Facilitating conditions are factors in the environment that
influence a person’s desire to perform a task. These
may include technical support, skills training, and access to
information or resources (Groves & Zemel,
2000). It is also a construct that reflects an individual’s
perceptions about his/her control over a behaviour.
Taylor and Todd (1995) underscored that external control, as
part of perceived behavioural control, is
conceptualised as the individual perception of technology and
resource-facilitating conditions. This was
supported by Venkatesh (2000), who found that an individual’s
general perception of technology and
resource-facilitating conditions could be a significant influence
on perceived ease of use.
Among teachers, Lim and Khine (2006) revealed that poor
facilitating conditions (e.g., lack of access to
computers, inadequate technical support given to teachers) act
as barriers to ICT integration in the classroom.
On its relationship to the TAM constructs, facilitating
conditions were found to be significantly related to
attitudes towards computer use (Teo et al., 2012). In their
studies on pre-service teachers, Teo, Ursavas, and
Bahcekapili (2012) found that facilitating conditions have a
direct influence on perceived ease of use and
perceived usefulness. It is possible that when the participants
feel supported in ways that are important to
them, they perceive technology to be easy to use. Among the
48. facilitating conditions, technical support was
ranked highly on the list of factors that affect teachers’
implementation technology. From their study, Groves
Australasian Journal of Educational Technology, 2015, 31(4).
367
and Zemel (2000) suggested that technical support generally
includes the provision of help desks, hotlines,
and online support services. In addition, participants may have
inferred from the presence (or lack) of
technical support in an organisation that technology is useful to
them (Teo, 2009).
From the above review of the literature, the following
hypotheses were formulated for this study:
H10: Facilitating conditions have a significant influence on pre-
service teachers’ attitude towards
computer use.
H11: Facilitating conditions have a significant influence on pre-
service teachers’ perceived ease of use.
H12: Facilitating conditions have a significant influence on pre-
service teachers’ perceived usefulness.
In this study, intention to use technology was used as the
dependent variable because of its close link to actual
49. behaviour (Hu, Clark, & Ma, 2003; Kiraz & Ozdemir, 2006).
Behavioural intention indicates how hard people
are willing to try to perform a behaviour (Ajzen, 1991). In their
review of 79 empirical studies, Turner,
Kitchenham, Brereton, Charters, and Budgen (2010) found
evidence for the positive relationship between
intention to use and actual use of technology, and this lends
support for the use of intention to use as an
outcome variable in this study to predict pre-service teachers’
future technology usage behaviours.
From the above hypotheses a research model is proposed
(Figure 1). This model hypothesises that pre-service
teachers’ intention to use technology to teach mathematics can
be predicted and explained by a subjective
perception of usefulness, attitudes towards computer use,
knowledge of mathematics, and subjective norm, in
conjunction with the indirect influence of facilitating conditions
and ease of use.
Figure 1. Research model
Notes. SN: subjective norm; KNOW: perceived mathematical
knowledge; FC: facilitating conditions; PU:
perceived usefulness; PEU: perceived ease of use; ATCU:
attitude towards computer use; BI: behavioural
intention to use technology.
Aims of this study
The purpose of this study is to examine the variables that have
significant influence on the intention to use
technology in teaching mathematics (i.e., behavioural intention)
among pre-service teachers in Serbia. This
study has the potential to contribute to existing debates on the
50. relevance of the TAM as a framework to
explain and predict technology usage in a teacher education
context. By applying an extended TAM with a
non-Western culture, the findings from this study allow
researchers to assess its validity and robustness across
cultures. This study could serve to inform teacher education
instructors and administrators on the variables
that directly impact on pre-service teachers’ intention to use
technology in their future jobs. Being guided by
Australasian Journal of Educational Technology, 2015, 31(4).
368
the findings of this study, pre-service teachers could be led to
strengthen their intention to use technology in
their capacity as future mathematics teachers. Two research
questions guide this study:
(1) To what extent does the research model adequately explain
pre-service teachers’ intention to use
technology in teaching mathematics?
(2) Are there significant differences in gender and age that
influence pre-service teachers’ intention to
use technology in teaching mathematics?
Method
51. Participants
Participants were 313 pre-service teachers recruited from two
universities in Serbia who have completed
classes in technology, teaching of mathematics, and
mathematics. Of these, there were 277 female (88.5%)
participants, and the mean age was 22.44 (SD = 1.22) years old.
The participants in this study represented
about 60% of the pre-service teacher population in the two
universities. Among the participants, 188 (60.1%)
were in the third year of their study, and the others were in year
four.
Procedure
Researchers have suggested that viewing videos helps teachers
to focus their attention on important aspects of
teaching and learning (Lampert & Ball, 1998; Star & Strickland,
2007). Given that pre-service teachers in
Serbia have limited use of computers in teaching mathematics
due to the varying availability of computer
equipment in primary schools, the authors developed a 6-
minute–long video stimulus (Figure 2) in order to
help the participants to focus on the technology when they
responded to the survey. The video contains short
teaching clips that illustrate three different types of computer
applications in the teaching of mathematics.
After viewing the video, participants completed a survey
questionnaire, and on average each tool took not
more than 20 minutes to do so. Participants did not receive any
reward in monies or in kind.
Figure 2. Screenshot of video stimulus
52. Instrument
A survey questionnaire was employed in this study. In addition
to the questions on demographics, items were
compiled to assess participants' responses in order to measure
the variables in the research model. We adapted
them from various published sources and translated them into
the Serbian language. These are perceived
usefulness (4 items), perceived ease of use (4 items), attitude
towards computer use (4 items), behavioural
Australasian Journal of Educational Technology, 2015, 31(4).
369
intention to use technology (3 items), subjective norm (3 items),
perceived mathematical knowledge (3 items),
and facilitating conditions (2 items). Each item was measured
on a 5-point Likert scale with 1 = strongly
disagree and 5 = strongly agree.
Survey translation
To ensure the validity of the instrument, each item underwent
the process of translation and
countertranslation. The original survey was translated by the
second author from English into Serbian. Next,
the Serbian version of the survey was translated into English by
a professional translator. The two versions,
original and translated, were compared, and the changes were
made to the Serbian version by a faculty
member who worked as an English language teacher assistant to
53. ensure that the meaning and intent of each
item were kept intact.
Data analysis
Data were analysed using the structural equation modelling
(SEM) approach. The analysis involves testing for
data normality and the research model (representing the
relationships among the seven variables in this study:
behavioural intention to use, perceived usefulness, perceived
ease of use, attitudes towards computer use,
subjective norm, perceived mathematical knowledge, and
facilitating conditions). In the research model, all
free parameters were estimated and evaluated for statistical
significance. SEM was employed for its ability to
analyse the relationships between latent and observed variables
and estimate random errors in the observed
variables directly, giving rise to more precise measurements of
the items and constructs in the survey.
Because of the shift from the items to the constructs, SEM has
an added advantage over traditional data
analysis techniques in its ability to model the relationships
among latent variables and be more aligned with
how hypotheses are expressed conceptually and statistically
(Hoyle, 2011). Using the standard two-step
approach to SEM (Schumacker & Lomax, 2010), the first step
involves estimating the measurement model
(confirmatory factor analysis – CFA model) for all latent
variables in the model. The measurement model
describes how well the observed indicators (survey items)
measure the unobserved (latent) constructs. In the
second step, the structural part of the SEM is estimated. This
part specifies the relationships among the
exogenous and endogenous latent variables. To obtain reliable
results in SEM, researchers recommend a
sample size of 100 to 150 cases (e.g., Kline, 2010). Researchers
also recommend the Hoelter’s critical N,
54. which refers to the sample size for which one would accept the
hypothesis that the proposed research model is
correct at the .05 level of significance. The Hoelter’s critical N
for the model in this study is 202 and, given
that the sample size of this study is 313, SEM is regarded as an
appropriate technique for data analysis.
Results
Descriptive statistics
All 23 items measuring the seven constructs in the questionnaire
were examined for their mean, standard
deviation, skewness, and kurtosis. All means scores were above
the mid-point of 3.0 and they indicate an
overall positive response to the constructs in the model. The
standard deviations reflect a fairly narrow spread
of participants’ responses, ranging from .73 to 1.19. Skewness
and kurtosis indices were small and well
within the accepted level of_3_and _10_respectively (Kline,
2010). On the recommendations from Kline
(2010), the data in this study were considered to be univariate
normal.
Evaluation of the measurement model
The measurement model was assessed using CFA and conducted
with Amos 7.0 using the maximum
likelihood estimation (MLE) procedure. The MLE is a popular
and robust procedure for use in SEM
(Schumacker & Lomax, 2010). As the MLE procedure assumes
multivariate normality of the observed
variables, the data in this study were examined using Mardia’s
normalised multivariate kurtosis value.
Mardia’s (1970) coefficient for the data in this study was
157.49, which is lower than the value of 575
55. computed based on the formula p(p + 2) where p equals the
number of observed variables in the model
(Raykov & Marcoulides, 2008). On this basis, multivariate
normality of the data in this study was assumed.
The results of the CFA are shown in Table 1.
Australasian Journal of Educational Technology, 2015, 31(4).
370
All parameter estimates were significant at the p < .01 level, as
indicated by the t-value (greater than 1.96).
The standardised estimates ranged from .56 to .90, and these
were regarded as acceptable (Hair, Black, Babin,
& Anderson, 2010). The internal consistency (alpha) of all
constructs range from .64 to .87. Finally, the
measurement model fit was assessed using a number of fit
indices: χ2, χ2/df, Tucker-Lewis index (TLI),
comparative fit index (CFI), root mean squared error of
approximation (RMSEA), and standardised root mean
residual (SRMR). The model has a good model fit [χ2= 445.240;
χ2/df = 3.00; TLI = .974; CFI = .980;
RMSEA = .058; SRMR = .027]. The adequacy of the
measurement model indicates that all items were
reliable indicators of the hypothesised constructs they were
purported to measure.
Table 1
Results for the measurement model
Item UE
57. the squared standardised factor loadings
divided by number of factors of the underlying construct.
CR: composite reliability. This is computed by the sum of
squared standardised factor loadings divided
by the sum of squared standardised factor loadings and the sum
of the error variance.
PU: perceived usefulness; PEU: perceived ease of use; ATCU:
attitude towards computer use; BI:
behavioural intention to use technology; SN: subjective norm;
KNOW: perceived mathematical
knowledge; FC: facilitating conditions.
Evaluation of the structural model
In evaluating the structural model, researchers recommend the
use of several goodness-of-fit indices to assess
the match between any particular model and the data (Klem,
2000; Kline, 2010; McDonald & Ho, 2002;
Schumacker & Lomax, 2010). In addition to using the chi-
square test, which is highly sensitive to sample
size, the ratio of the chi-square to its degrees of freedom was
computed when deciding on model fit.
Australasian Journal of Educational Technology, 2015, 31(4).
371
Following the recommendations by Hu and Bentler (1999),
RMSEA and SRMR were used as measures of
absolute fit, and the CFI and TLI were used as indices of
incremental fit. From the literature (e.g., Hair et al.,
58. 2010), values of .90 or more for the CFI and TLI, and values of
.05 and .08 or less for RMSEA and SRMR,
respectively, are reflective of a good fit. From the results, the
structural model has a good fit [χ2 = 6.226; χ2/df
= 1.567; TLI = .969; CFI = .994; RMSEA = .043; SRMR =
.023]. Figure 3 shows the standardised path
coefficients of the research model.
Figure 3. Standardised path coefficients of the research model
* p < .05; ** p < .001; ns: non-significant
Notes. PU: perceived usefulness; SN: subjective norm; KNOW:
perceived mathematical knowledge;
FC: facilitating conditions; PEU: perceived ease of use; ATCU:
attitude towards computer use; BI:
behavioural intention to use technology.
Tests of hypotheses
Overall, eight out of twelve hypotheses were supported by the
data. Except for H1, all hypotheses (H2 to H5)
pertaining to the relationship among the variables from the core
TAM were supported in this study. Of the
hypotheses related to the variables external to the TAM, four
were supported (H6, H9, H11, and H12) and
three were not (H7, H8, and H10). Four endogenous variables
(behavioural intention to use technology,
attitudes towards computer use, perceived usefulness, and
perceived ease of use) were tested in the research
model (Figure 1). Overall, the variance in attitude towards
computer use was highest with an R2 = 0.409. This
means that together, perceived usefulness, facilitating
conditions, and perceived ease of use accounted for
59. 40.9% of the variance in attitudes towards computer use. Next,
the variance in perceived ease of use and
perceived usefulness were explained by their antecedents at
amounts of 17.8% and 10.6%, respectively.
Finally, the dependent variable in this study, behavioural
intention to use technology, was explained by
perceived usefulness, attitude towards use, subjective norm, and
facilitating conditions with an R2 of 0.054.
This means that, together, these four variables accounted for
only 5.4% of the variance found in the
behavioural intention to use technology. A summary of the
hypotheses testing results is shown in Table 2.
Australasian Journal of Educational Technology, 2015, 31(4).
372
Table 2
Hypothesis testing results
Hypotheses Path Path coefficient t- value Results
H1 PU → BI -.036 -.309 ns Not supported
H2 PU → ATCU .479 9.981** Supported
H3 ATCU → BI .532 3.508** Supported
H4 PEU → PU .238 5.249** Supported
H5 PEU → ATCU .753 4.995** Supported
H6 SN → PU .181 4.748** Supported
H7 SN → BI .064 1.330 ns Not supported
H8 KNOW → BI .072 1.087 n.s. Not supported
60. H9 KNOW → PEU .285 5.404** Supported
H10 FC → ATCU .002 .073 n.s. Not supported
H11 FC → PEU .085 2.208* Supported
H12 FC → PU .067 2.023* Supported
* p < .05; ** p < .001; ns: non-significant.
Notes. PU: perceived usefulness; BI: behavioural intention to
use technology; ATCU: attitude towards
computer use; PEU: perceived ease of use.
MIMIC modelling
In this study, multiple indicators, multiple causes (MIMIC)
modelling was used to assess if there are
significant differences in the behavioural intention to use
technology by participants’ gender and age. MIMIC
modelling is used when it is believed that the observed
variables are manifestations of an underlying
unobserved latent variable that can be affected by other
exogenous variables (causes) that influence the latent
factor (Joreskog & Goldberger, 1975). Although group
comparisons (e.g., between male and female) are
typically made using the traditional t-test, MIMIC modelling is
employed in this study because first, it allows
simultaneous analysis of a model with latent variables and
observed indicators, and second, measurement
error is modelled and computed to facilitate a more precise
estimation of item reliability. A further advantage
of MIMIC modelling is that it allows for a dichotomous group
comparison to be made (e.g., gender) using
cause indicators as exogenous variables. This is often used as an
alternative to multiple-group comparisons
where bigger sample sizes are required (Brown, 2006). Through
specification of a MIMIC model, one could
estimate group differences on latent variables factors on the
total sample. Thus, for the MIMIC analysis, the
61. sample is not partitioned into subsamples, and there are no
special identification requirements beyond the
usual ones for single-sample analyses (Kline, 2010).
The MIMIC modelling process is a special case of SEM and
involves an estimation of the measurement part
(that displays the causal link among the latent variables and the
observed causes) and the structural part
(which shows how the latent variables are estimated through the
observed variables or indicators). The
MIMIC model incorporates additional variables, which are
assumed to influence the latent factors and also
allows the testing of hypothesis on direction of effects between
different factors. The MIMIC model has an
opposite layout from a path model in that the dichotomous
variable (or dependent variable) is represented at
the left side instead of the right side of the model.
The simplest form of MIMIC model involves a single
unobserved latent variable “caused” by several
observed variables and indicated by several observed exogenous
variables (Jöreskog & Sörbom, 1996, p.
185). The observed exogenous variables in this study that are
assumed to explain the latent variable
behavioural intention to use technology (caused by the observed
variables perceived usefulness, perceived
ease of use, attitude towards compute use, subjective norm,
perceived mathematical knowledge, and
facilitating conditions) are gender and age. This part of the
model can be viewed as six multiple regressions:
perceived usefulness, perceived ease of use, attitude towards
compute use, subjective norm, perceived
mathematical knowledge, and facilitating conditions on gender
and age. For example, if gender is coded such
that males are 0 and females 1, a negative coefficient for the
regression of perceived usefulness on gender
62. would indicate that females have a lower level of perceived
usefulness than males. Hence, there are multiple
Australasian Journal of Educational Technology, 2015, 31(4).
373
indicators, which reflect the underlying factors, and multiple
causes, which affect the underlying factors. For
the purpose of dichotomising the gender and age in this study,
gender was coded such that males were 0 and
females 1, and the median age (22 years) was used and denoted
by 0 and 1 to represent the younger and older
participants, respectively. The modelling process in this study
follows established procedures recommended
by Kline (2010). Figure 4 shows the MIMIC model that
represents the effects of gender and age, which are
represented by arrows from these variables to the latent variable
(behavioural intention to use technology).
This is the structural part of the MIMIC model that uses the
observed dichotomous variables to predict a
latent variable. On the other hand, the latent variable has
arrows pointing out to the observed indicator
variables (perceived usefulness, perceived ease of use, attitude
towards compute use, subjective norm,
perceived mathematical knowledge, and facilitating conditions)
and is explained by them. This is the
measurement part of the MIMIC model that defines the latent
variable. The path coefficients for the direct
effects of the gender and age variables will provide information
about whether the differences between males
63. and females or younger and older participants predict the
variable behavioural intention to use technology.
Figure 4. MIMIC model with gender and age as causes
Notes. PU: perceived usefulness; PEU: perceived ease of use;
ATCU: attitude towards computer use; SN:
subjective norm; KNOW: perceived mathematical knowledge;
FC: facilitating conditions.
The fit of the MIMIC model was estimated using the MLE
procedure and assessed using a number of fit
indices representing the absolute and incremental aspects of
model fit (Hair et al., 2010). They were χ2, χ2/df,
TLI, CFI, RMSEA and SRMR. To achieve an acceptable model
fit, the χ2/df ratio should be less or equal to
3.0 while the TLI and CFI should be equal or greater than .90.
The RMSEA and SRMR should be equal or
smaller than .05 and .08, respectively (Hair et al., 2010).
The fit of this model was good (χ2 = 26.994, df = 17, p = .058,
χ2/df = 1.588, TLI = .95, CFI = .97, RMSEA
= .043 [CI = .000, .073], SRMR = .04). The item parameter
estimates reveal that all exogenous variables in
the MIMIC model were significant in explaining behavioural
intention to use technology (PU: β = .607, PEU:
β = .608, ATCU: β = .942, SN: β = .242, KNOW: β = .361, and
FC: β = .219). The regression part (left side)
of the model shows that no differences were found in
behavioural intention to use technology by gender (β
= .012; p > .05) and age (β = .023; p > .05) although the
influence by age on behavioural intention to use
technology was stronger than that by gender. Table 3
summarises the results of the MIMIC modelling.
64. Australasian Journal of Educational Technology, 2015, 31(4).
374
Table 3
MIMIC modelling results
Path Path coefficient Results
BI → PU .607 **
BI → PEU .608 **
BI → ATCU .942 **
BI → SN .242 **
BI → KNOW .361 **
BI → FC .219 **
Gender .012 ns
Age .023 ns
** p < .001; ns: non-significant.
Notes. BI: behavioural intention to use technology; PU:
perceived usefulness; PEU: perceived ease of use;
ATCU: attitude towards computer use; SN: subjective norm;
KNOW: perceived mathematical knowledge;
FC: facilitating conditions.
Discussion
This study aims to develop and test a model to explain the
behavioural intention to use technology in
mathematics teaching among pre-service teachers in Serbia.
Using SEM, the results indicate that the model is
65. an adequate fit to the data collected in this study.
Antecedents of behavioural intention
This study shows that attitudes towards computer use have a
direct positive effect on the behavioural intention
to use technology, suggesting that pre-service teachers with
positive feelings towards the use of computers are
likely to use computers to teach mathematics. This finding is
consistent with recent studies that examined the
influence of attitudes towards computer use among pre-service
teachers in other countries (Teo, 2009, 2011;
Yuen & Ma, 2008). In addition, the results show that attitudes
towards computer use had mediated the effect
of perceived usefulness and perceived ease of use on
behavioural intention to use technology. It is likely that
the pre-service teachers in this study would not use technology
to teach mathematics simply because they
perceived it to be free of effort or useful; they had to have a
positive attitude towards computer use as well.
This mediating influence of attitudes towards computer use for
perceived usefulness and perceived ease of use
on behavioural intention to use technology is illustrated by the
lack of support for hypothesis 1 and support
for hypotheses 2 and 5.
The lack of significant influence found for perceived usefulness
on behavioural intention to use technology in
this study was not aligned with research on the TAM. It is
possible that perceived usefulness alone was not a
sufficiently strong driver for pre-service teachers to use
technology to teach mathematics and that the nature
of mathematics teaching was perceived to be relatively complex
so that other variables such as perceived ease
of use and attitudes towards computer use have to be present to
have a significant influence on their
66. behavioural intention to use technology.
This study found that subjective norm had a significant
influence on perceived usefulness but did not affect
behavioural intention to use technology, suggesting that even if
pre-service teachers held the impression that
people important to them would support the use of technology
for teaching mathematics, they would consider
technology to be useful but this would not influence their
behavioural intention to use technology
significantly. This finding is consistent with Teo (2011) and
Motaghian et al. (2013) who found that
subjective norm did not influence teachers and instructors’
intention to use technology for teaching and using
web-based learning systems respectively. These authors opined
that pre-service and practising teachers were
able to exercise greater volition than their counterparts in
business and industrial contexts on when and how
they use technology at the workplace.
Australasian Journal of Educational Technology, 2015, 31(4).
375
The results also show that facilitating conditions have a
significant influence on pre-service teachers’
perceived usefulness and perceived ease of use but not on
attitudes towards computer use. Although
pre-service teachers may perceive technology to be useful and
easy to use in the presence of technical
67. support, their attitude towards computers would not necessarily
be influenced (Teo et al., 2012). However, in
their study on students’ use of technology for learning, Lai,
Wang, and Lei (2012) found that, in addition to
FC having a significant influence on perceived usefulness and
perceived ease of use, facilitating conditions
also had a significant effect on attitudes towards computer use.
This finding suggests that the pre-service
teachers in this study were driven by their affect (attitudes
towards computer use) more than their
environment and perceptions of support.
This study found a significant influence on perceived ease of
use by the knowledge of mathematics variable
although the latter did not influence behavioural intention to
use technology in a significant way. When
pre-service teachers perceive their knowledge of mathematics to
be high, they would perceive the use of
technology to be relatively free of effort although this did not
mean they would use it for teaching
mathematics. However, the results suggest that if we consider
attitudes towards computer use with perceived
mathematical knowledge and perceived ease of use, pre-service
teachers’ behavioural intention to use
technology would be heightened.
MIMIC modelling
Using MIMIC modeling, this study found no significant
differences in behavioural intention to use
technology for gender and age. These findings are consistent
with research that supported the lack of gender
and age difference in pre-service teachers and students’
acceptance of technology for teaching and learning
(Ong & Lai, 2006; Pan & Jordan-Marsh, 2010; Teo, Luan,
Thammetar, & Chattiwat, 2011). The lack of
68. gender difference may be attributed to the global trend where
males and females in all socieites are provided
equal opportunities to be exposed and have access to technology
for learning (Mayer-Smith, Pedretti, &
Woodrow, 2000). In the case of the pre-service teachers in this
study, the lack of gender difference may be a
positive outcome of the Serbian education framework where,
among the goals, all students are provided with
opportunities to acquire the computer literacy skills necessary
for life in modern society and develop the
abilities to use ICT to find, analyse, utilise and communicate
information (UNESCO, 2013).
The lack of age difference is consistent with the relative youth
of the sample in this study (22.44 years old, SD
= 1.22). This is also consistent with a study by Dimitrijevic et
al. (2012) who suggested that younger teachers
in Serbia were more inclined to engage with technology for
instructional purposes. In addition, the pre-service
teachers in this study are completing undergraduate degrees in a
teacher education program where technology
is integrated into their courses in pedagogy and subject
disciplines. It was thought that this shared experience
in technology and the academic background with technology
among the participants in this study are the main
reasons for the lack of age difference in the intention to use
technology for teaching mathematics.
Limitations of the study
The data provided empirical support to the selected six
variables that were capable of explaining only 5.4% of
the variance in behavioural intention. This leads to the
conclusion that some other variables that may
significantly impact on the acceptance of technology in
mathematics teaching were excluded. There is a
69. possibility that other variables not included in the TAM may
influence pre-service teachers’ intention to use
technology in teaching mathematics in a significant way.
Although all methodology precautions were undertaken, there
are limitations. Firstly, data were collected
through self-reports, which have their own benefits but may
lead to the common method variance and thus
may inflate the true relationships between variables. Secondly,
the use of student teachers as a sample instead
of practising teachers may not represent the true picture because
of their lack of experience in practice and
stress involved in integrating computers in the actual teaching
process. There is a possibility that other
significant variables have been overlooked and excluded.
Australasian Journal of Educational Technology, 2015, 31(4).
376
It is possible that other sociocultural variables may influence
pre-service teachers’ intention to use technology
in teaching mathematics. For example, while teachers appeared
to recognise the pervasive nature of
technology and declare their support for the use of technology
in instruction, it has been found that they prefer
the traditional teaching style, as it is a familiar and tested way
of teaching (Mumtaz, 2000). Cuban (1993)
claimed that the cultural beliefs (about what teaching is, how
learning occurs, what knowledge is proper in
70. school) in schools support student-teacher but not student-
machine relationships. Consequently, schools seem
to be slow in embracing technology and resistant to change. At
the same time, teachers’ beliefs about the
benefits of students’ learning with technology is an important
factor to achieving educational outcomes, since
the opportunity to interact with technology in the mathematics
classrooms has been found to increase
students’ motivation and enjoyment (Bennison & Goos, 2010;
Pierce & Ball, 2009). Finally, because only
pre-service teachers training to teach mathematics were used in
this study, they may have responded
according to the subject-specific nature of technology use,
hence limiting the generalisability of the findings
of this study to teachers or pre-service of other subjects.
In this paper, the use of presentations and simulation models in
teaching mathematics were examined.
Technology is an umbrella concept that may involve many tools
such as information exchange, development
of group projects in a wiki environment, knowledge testing,
making new models (e.g., with GeoGebra), use of
computer-intensive algebra, computer-assisted instructions,
spreadsheets and dynamic geometry software,
interactive tutorials, hypermedia, simulations and educational
games. Since each of those tools marks its own
presence in the adoption of technology in teaching mathematics,
future studies should include a wider range
of technology use in the model.
Future research could include study among practising teachers
of different subjects and examination of other
variables of interest to the mathematics education community
and ways of extension the TAM at various
levels of technology acceptance.
71. Implications for practice
This study should help policy makers and managers at
educational institutions (particularly in Serbia) to pay
special attention to factors that have a determining role in
improving pre-service teachers’ acceptance of
technology in the teaching of mathematics. If teacher educators
want to motivate student teachers to use
computers in teaching, they need to make sure that they have
enough opportunities and adequate courses to
acquire the basic skills necessary for the integration of
computers into such ways of teaching and learning,
and to start to perceive them as easy to use. There should also
be a conscious effort in creating a conducive
learning environment where pre-service teachers can gain
successful experiences in harnessing technology for
teaching and learning. It is reasonable to expect a successful
experience with technology to foster the
development of positive attitudes towards computer use among
pre-service teachers, and this in turn would
significantly impact on their intention to use technology.
On their part, teacher educators could model the integration of
technology through their lesson delivery and
assessment design. By modelling the use of technology, teacher
educators may act as facilitators to shape
pre-service teachers’ perceived usefulness and perceived ease of
use of technology. Because of their status in
the institutions, these educators act as referent others for their
students whose subjective norm may be
influenced positively. From this study, perceived usefulness,
perceived ease of use and subjective norm are
important constructs that shape pre-service teachers’ intention
to use technology.
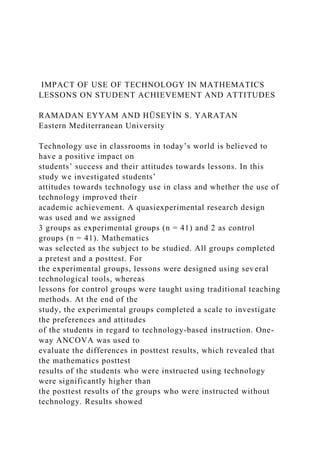
![that students had a positive attitude towards technology use.
The implications for curriculum
designers and teachers are discussed.
Keywords: achievement, attitude, quasiexperimental research
design, mathematics, technology
use.
Today in most developed countries technology is being used
extensively in
classrooms. As Bitter and Pierson (2005) and Wiske, Franz, and
Breit (2005)
have pointed out, the use of instructional technology in class
enhances learning
SOCIAL BEHAVIOR AND PERSONALITY, 2014, 42(Suppl.),
S31-S42
© Society for Personality Research
http://dx.doi.org/10.2224/sbp.2014.42.0.S31
31
Ramadan Eyyam, Foreign Languages and English Preparatory
School, Eastern Mediterranean
University; Hüseyin S. Yaratan, Educational Sciences
Department, Eastern Mediterranean University.
Correspondence concerning this article should be addressed to:
Ramadan Eyyam, Eastern
Mediterranean University, Gazimağusa, via Mersin 10, Turkey.
Email: [email protected]
USE OF TECHNOLOGY IN MATHEMATICS32
so that students can learn more effectively. In technology-](data:image/gif;base64,R0lGODlhAQABAIAAAAAAAP///yH5BAEAAAAALAAAAAABAAEAAAIBRAA7)