More Related Content
Similar to Loopnet Local Quarterly Insight Report Q1, 2009
Similar to Loopnet Local Quarterly Insight Report Q1, 2009 (20)
Loopnet Local Quarterly Insight Report Q1, 2009
- 1. RENO INDUSTRIAL
LoopNet Active Listings
FIRST QUARTER 2009
Avg Asking Rent Avg Times Found in Avg Times Viewed
Building Type Median Asking Sale Price Average Size (SF) Avg Sale Price Per SF ($/SF/YR) Total SF Avail for Sale Searches (Past 90 Days) (Past 90 Days)
Manufacturing $2,812,500 51,255 $70.05 $4.38 461,297 572 64
Flex/R&D $1,100,000 12,096 $125.96 $8.53 616,873 664 53
Warehouse/Distribution $1,913,000 51,491 $83.16 N/A 1,647,714 737 74
Visualizing Market Activity
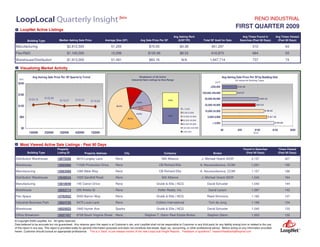
Avg Asking Sale Price Per SF Quarterly Trend Breakdown of All Active Avg Asking Sale Price Per SF by Building Size
($/sf) Industrial Sale Listings by Size Range A ll Ind ust rial B uild ing T yp es
(sq ft)
$240
>250,000 $ 42.49
100,000-249,999 $ 41.27
$180
$125.10 $132.85 11.9%
50,000-99,999 $ 102.5 3
$119.37 $122.63 $116.83 2.8%
12.8%
$120 38.5%
25,000-49,999 $ 9 4.5 3
5.5% < 5,000
10,000-24,999 $ 118 .85
5,000-9,999
12.8%
2.8%
$60 18.3%
10,000-24,999 5,000-9,999 $ 127.29
25,000-49,999
< 5,000 $ 146 .89
50,000-99,999
$0 100,000-249,999
$0 $50 $100 $150 $200
>250,000
1Q2008 2Q2008 3Q2008 4Q2008 1Q2009 ($ /sf)
Most Viewed Active Sale Listings - Past 90 Days
Property Found in Searches Times Viewed
Building Type Listing ID Property Address City Company Broker (Past 90 Days) (Past 90 Days)
Distribution Warehouse 16075206 4910 Longley Lane Reno NAI Alliance J. Michael Hoeck SIOR 2,137 327
Warehouse 15895960 11500 Production Drive Reno CB Richard Ellis A. Noursoultanova, CCIM 1,291 195
Manufacturing 15663069 1085 Bible Way Reno CB Richard Ellis A. Noursoultanova, CCIM 1,157 186
Distribution Warehouse 15648544 1025 Sandhill Road Reno NAI Alliance J. Michael Hoeck SIOR 1,242 164
Manufacturing 15818949 145 Catron Drive Reno Grubb & Ellis | NCG David Schuster 1,043 144
Warehouse 16053714 250 Arletta St Reno Keller Realty, Inc. David Larson 1,397 142
Flex Space 15762922 3550 Barron Way Reno Grubb & Ellis | NCG Reed Simmons 1,162 137
Industrial-Business Park 15824755 5475 Louie Lane Reno Colliers International Tom de Jong 1,169 134
Warehouse 16025023 1845 Hymer Ave. Sparks Grubb & Ellis | NCG David Schuster 1,040 133
Office Showroom 16057457 9728 South Virginia Street Reno Stephen T. Glenn Real Estate Broker Stephen Glenn 1,503 132
© Copyright 2009 LoopNet, Inc. All rights reserved.
Data believed to be accurate but not guaranteed. Any reliance upon this report is at Customer’s risk, and LoopNet shall not be responsible to Customer or any third party for any liability arising from or related to the use
of this report in any way. This report is provided solely for general information purposes and does not constitute real estate, legal, tax, accounting, or other professional advice. Before acting on any information provided
herein, Customer should consult an appropriate professional. This is a "beta" or pre-release version of the new LoopLocal Insight Reports. Feedback or questions? researchfeedback@loopnet.com
- 2. RENO OFFICE
LoopNet Active Listings
FIRST QUARTER 2009
Avg Asking Rent Avg Times Found in Avg Times Viewed
Building Type Median Asking Sale Price Average Size (SF) Avg Sale Price Per SF ($/SF/YR) Total SF Avail for Sale Searches (Past 90 Days) (Past 90 Days)
Office Building $1,075,400 9,611 $217.32 $22.92 1,191,763 613 62
Medical Office $747,500 9,144 $225.93 $19.92 128,015 568 64
Office-R&D $2,150,000 15,800 $141.15 $14.16 47,400 1,191 121
Visualizing Market Activity
Avg Asking Sale Price Per SF Quarterly Trend Breakdow n of All Active Avg Asking Sale Price Per SF by Building Size
Office Sale Listings by Size Range All Office Building Types
($/sf) (sq ft)
$400 >250,000
100,000-249,999
$300
$220.71 $219.73 $224.77 $223.68 27.8% 18.9% 50,000-99,999 $152.87
$215.52 5.9%
25,000-49,999 $176.59
$200 8.9%
< 5,000
10,000-24,999 $196.04
5,000-9,999
$100 44.4% 3.0% 5,000-9,999 $230.28
10,000-24,999
< 5,000 $241.84
25,000-49,999
$0
50,000-99,999 $0 $80 $160 $240 $320
1Q2008 2Q2008 3Q2008 4Q2008 1Q2009 ($/sf)
Most Viewed Active Sale Listings - Past 90 Days
Property Found in Searches Times Viewed
Building Type Listing ID Property Address City Company Broker (Past 90 Days) (Past 90 Days)
Office Building 16071554 6580 S. McCarran Reno Kelley Real Estate Ian Kelley 2,570 441
Office Building 16040196 100 N. Sierra Street Reno NAI Alliance Dominic Brunetti 3,581 267
Office Condo 15982877 50 N. Sierra Street Reno NAI Alliance Dominic Brunetti 2,632 258
Office Building 16058222 3614 Lakeside Drive Reno Grubb & Ellis | NCG Don Welsh 1,337 244
Office Building 16061266 604 W. Moana Lane Reno 39 Commercial Realty Inc Phil Tripoli 1,254 220
Office Building 16027955 2195 S. Virginia Street Reno NAI Alliance Dominic Brunetti 2,398 202
Office Building 16048579 423 West Plumb Lane Reno Grubb & Ellis | NCG Don Welsh 1,356 194
Office Building 16017772 923 Tahoe Blvd Incline Village Wells & Bennett Realtors Barry Bennett 728 173
Office Building 15818472 5690 Riggins Court Reno Kelley Real Estate Ian Kelley 1,416 165
Medical Office 16070394 5655 Kietzke Lane Reno Grubb & Ellis | NCG Don Welsh 1,205 162
© Copyright 2009 LoopNet, Inc. All rights reserved.
Data believed to be accurate but not guaranteed. Any reliance upon this report is at Customer’s risk, and LoopNet shall not be responsible to Customer or any third party for any liability arising from or related to the use
of this report in any way. This report is provided solely for general information purposes and does not constitute real estate, legal, tax, accounting, or other professional advice. Before acting on any information provided
herein, Customer should consult an appropriate professional. This is a "beta" or pre-release version of the new LoopLocal Insight Reports. Feedback or questions? researchfeedback@loopnet.com
- 3. RENO MULTIFAMILY
FIRST QUARTER 2009
LoopNet Active Listings
Avg Times Found in Avg Times Viewed
Building Type Median Asking Sale Price Avg Number of Units Average Sale Price Per Unit Total SF Avail for Sale Searches (Past 90 Days) (Past 90 Days)
Garden/Low-Rise $818,975 25 $78,878 1,059,004 1,208 118
Mid/High-Rise $1,095,000 121 $60,818 1,341,552 2,039 201
Duplex/Triplex/Fourplex $375,000 3 $124,196 68,499 965 73
Visualizing Market Activity
Avg Asking Sale Price Per Unit Quarterly Trend Breakdown of All Active Avg Asking Price Per Unit by Unit Mix
Multifamily Sale Listings by Unit Mix A ll M ult if amily B uild ing T yp es
($/unit) (units/bldg)
$200,000 >50 Units $86,669
35 to 49 Units $ 99,584
$150,000 21.3% 3.2%
$114,103 20 to 34 Units $66,055
$99,939 11.7%
$90,232
$100,000 10 to 19 Units $69,270
$106,855 23.4% 11.7% <5 Units
$99,177 8.5% 5-9 Units 5 to 9 Units $ 83,035
$50,000 10-19 Units
31.9% <5 Units $122,984
20-34 Units
35-49 Units $0 $40,000 $80,000 $120,000 $160,000
$0
>50 Units ($ /unit)
1Q2008 2Q2008 3Q2008 4Q2008 1Q2009
Most Viewed Active Sale Listings - Past 90 Days
Property Found in Searches Times Viewed
Building Type Listing ID Property Address City Company Broker (Past 90 Days) (Past 90 Days)
Garden/Low-Rise 16060721 1002 S Arlington Avenue Reno Lester Conklin Lester Conklin 4,676 735
Garden/Low-Rise 16044347 75 High Street Reno Grubb & Ellis | NCG Reed Simmons 3,274 467
Mid/High-Rise 15990728 260 Island Street Reno Metzker Johnson Group Richard Johnson 3,532 444
Mid/High-Rise 15714493 28-34 W Second St. Reno Drake Realty, Inc. Daryl Drake 3,355 365
Garden/Low-Rise 15733618 350 Harbour Cove Drive Sparks CB Richard Ellis Leonard Ramos 1,792 355
Garden/Low-Rise 16068582 1445 Stardust Street Reno CB Richard Ellis Alex Mellinger, CCIM 3,102 333
Garden/Low-Rise 15970735 2400 Sutro St Reno Keller Realty, Inc. David Larson 3,194 291
Garden/Low-Rise 15798218 80-90 Burns Reno CB Richard Ellis Alex Mellinger, CCIM 2,306 261
Garden/Low-Rise 15809437 3700 Kings Row Reno CB Richard Ellis Leonard Ramos 2,378 255
Garden/Low-Rise 16070615 888 East 2nd Street Reno Thomas Clark Real Estate Tom Clark 2,907 250
© Copyright 2009 LoopNet, Inc. All rights reserved.
Data believed to be accurate but not guaranteed. Any reliance upon this report is at Customer’s risk, and LoopNet shall not be responsible to Customer or any third party for any liability arising from or related to the use
of this report in any way. This report is provided solely for general information purposes and does not constitute real estate, legal, tax, accounting, or other professional advice. Before acting on any information provided
herein, Customer should consult an appropriate professional. This is a "beta" or pre-release version of the new LoopLocal Insight Reports. Feedback or questions? researchfeedback@loopnet.com
- 4. RENO RETAIL/SHOPPING
FIRST QUARTER 2009
LoopNet Active Listings
Avg Asking Rent Avg Times Found in Avg Times Viewed
Building Type Median Asking Sale Price Average Size (SF) Avg Sale Price Per SF ($/SF/YR) Total SF Avail for Sale Searches (Past 90 Days) (Past 90 Days)
Free Standing Bldg $1,250,000 15,823 $270.89 $22.64 553,789 1,109 88
Street Retail $1,072,500 9,888 $158.53 $21.47 59,327 986 46
Neighborhood/Strip $3,737,772 13,032 $214.62 $22.77 182,451 535 51
Visualizing Market Activity
Avg Asking Sale Price Per SF Quarterly Trend Breakdown of All Active Avg Asking Sale Price Per SF by Building Size
Retail/Shopping Center Sale Listings by Size Range All Retail/Shopping Building Types
$600 (sq ft)
>250,000 $28.14
$450 100,000-249,999 $27.96
1.0%
24.0%
$312.06 $312.49 $305.79 $294.01 50,000-99,999 $263.19
$291.17
10.0%
$300 19.0% 25,000-49,999 $146.44
4.0% 2.0% < 5,000
5,000-9,999
10,000-24,999 $255.46
$150 43.0%
10,000-24,999 5,000-9,999 $232.14
1.0% 25,000-49,999
50,000-99,999 < 5,000 $388.44
$0 100,000-249,999
$0 $115 $230 $345 $460
1Q2008 2Q2008 3Q2008 4Q2008 1Q2009 >250,000 ($/sf)
Most Viewed Active Sale Listings - Past 90 Days
Property Found in Searches Times Viewed
Building Type Listing ID Property Address City Company Broker (Past 90 Days) (Past 90 Days)
Anchor 16099999 295 Lemmon Drive Reno LEM Real Estate Dan Lem 4,066 643
Restaurant 16008712 5015 Pyramid Way Sparks SVN | The Kase Group Kase Abusharkh 1,793 291
Free Standing Bldg 15895930 2890 Northtowne Lane Reno CB Richard Ellis Chris Waizmann 1,797 274
Service/Gas Station 15896928 1600 Victorian Sparks 39 Commercial Realty Inc Phil Tripoli 1,358 258
Free Standing Bldg 15985418 10140 N McCarran Blvd Reno Faris Lee Investments Chris Tramontano 2,579 234
Free Standing Bldg 16099456 5015 Pyramid Way Sparks SVN | The Kase Group Kase Abusharkh 2,732 233
Restaurant 15573040 121 Vesta St Reno Colliers International Shawn Smith 1,915 220
Strip Center 16030735 300 Los Altos Parkway Sparks SVN | The Kase Group Kase Abusharkh 1,598 206
Free Standing Bldg 15214089 199 E. Moana Lane Reno SRS Real Estate Partners Sara Sanders 651 190
Retail Pad 15978972 750 N Virginia St Reno Retail West Mark Denholm 2,068 187
© Copyright 2009 LoopNet, Inc. All rights reserved.
Data believed to be accurate but not guaranteed. Any reliance upon this report is at Customer’s risk, and LoopNet shall not be responsible to Customer or any third party for any liability arising from or related to the use
of this report in any way. This report is provided solely for general information purposes and does not constitute real estate, legal, tax, accounting, or other professional advice. Before acting on any information provided
herein, Customer should consult an appropriate professional. This is a "beta" or pre-release version of the new LoopLocal Insight Reports. Feedback or questions? researchfeedback@loopnet.com