SlideShare a Scribd company logo
1 of 57
Download to read offline
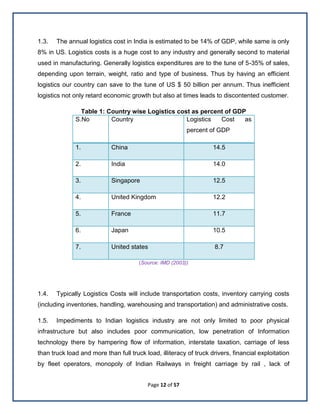
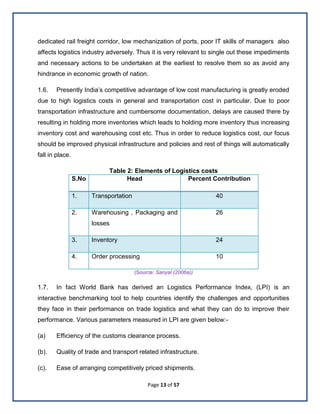
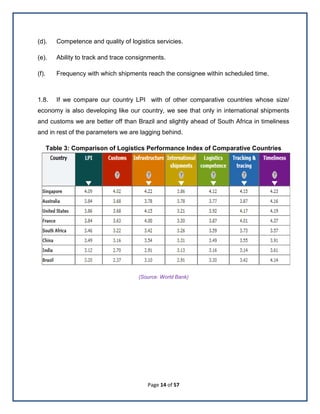
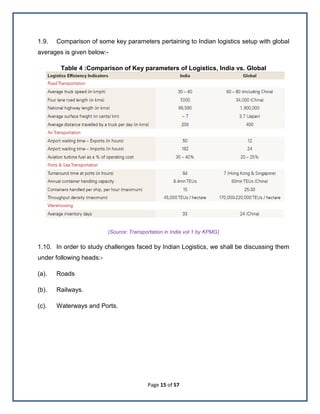
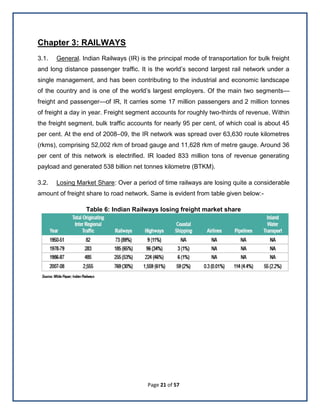
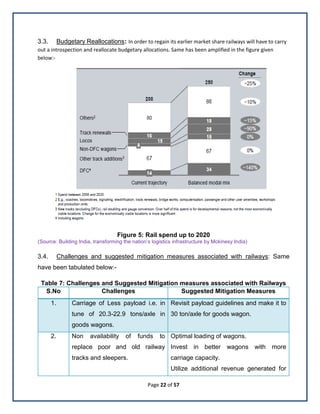
Page 1 of 57
Indian Logistics Sector:
Operational Impediments & Suggested
Measures to Overcome Same with
Special Reference to
Controlled Atmosphere Storage
An Independent Project Report
submitted to
AIIM
In partial fulfillment of the requirements of the
Post Graduate Programme in Infrastructure Management
Course
By:
Anuj Rawat
Roll No - 03
Page 2 of 57
DECLARATION
I hereby declare that I have followed the directions given in IP Guidelines document and
I confirm that this report is my own personal work and that all material other than my own
is properly referenced.
Student’s Name: Anuj Rawat (Roll No 03)
Student’s Signature:
Date: July 24, 2011
Page 3 of 57
ACKNOWLEDGEMENT
In completing this study, I did my level best correcting my shortcomings to possible
extent and I sincerely hope that this report will serve its purpose. I extend my heartiest
thanks to all those persons whose willing cooperation led to the timely completion of the
project.
I express my sincere gratitude to Dr B Gangula and Dr. K. K Sharma, my Project
Guides, for sharing their valuable knowledge and immense experience in making this
project successful. Their words of advice provided great support, kept me motivated and
helped me a great deal to complete project.
I am also thankful to Dr (Mrs) P Vyas, Chairperson Program Chair for appreciating
our concerns/issues and resolving same on priority.
I express my thanks to Dr Bakul Dholakia, Director, Adani Institute of Infrastructure
Management, for extending his support for said project.
Page 4 of 57
Contents
LIST OF FIGURES ..............................................................................................................................6
LIST OF TABLES................................................................................................................................7
ABSTRACT .........................................................................................................................................8
CHAPTER 1: INTRODUCTION ........................................................................................................ 10
CHAPTER 2: ROADS ....................................................................................................................... 16
2.1. GENERAL................................................................................................................................... 16
2.2. IMPROVEMENT IN THE ROAD NETWORK....................................................................................... 16
2.3. SHARE OF TRANSPORTATION LOAD........................................................................................... 16
2.4. FLEET CONFIGURATION ............................................................................................................. 18
2.5. CHALLENGES AND SUGGESTED MITIGATION MEASURES ASSOCIATED WITH ROAD....................... 19
CHAPTER 3: RAILWAYS................................................................................................................. 21
3.1. GENERAL................................................................................................................................... 21
3.2. LOSING MARKET SHARE............................................................................................................ 21
3.3. BUDGETARY REALLOCATIONS ................................................................................................... 22
3.4. CHALLENGES AND SUGGESTED MITIGATION MEASURES ASSOCIATED WITH RAILWAYS ............... 22
CHAPTER 4: WATERWAYS & PORTS........................................................................................... 25
4.1. GENERAL................................................................................................................................... 25
4.2. ADVANTAGES ............................................................................................................................ 25
4.3. INLAND WATER TRANSPORTATION............................................................................................. 25
4.4. INLAND WATERWAYS................................................................................................................. 26
4.5. CONDITIONS FOR A WATERWAY1 ............................................................................................... 27
4.6. ADVANTAGES OF WATERWAYS.................................................................................................. 28
4.7. DISADVANTAGES OF INLAND WATER TRANSPORT SYSTEMS ...................................................... 29
4.8. COASTAL SHIPPING ................................................................................................................... 29
4.9. REASONS FOR LESS TRAFFIC .................................................................................................... 29
Page 5 of 57
4.10. CHALLENGES AND SUGGESTED MITIGATION MEASURES ASSOCIATED WITH IWT, COSTAL
SHIPPING AND PORTS.......................................................................................................................... 30
CHAPTER 5: WAREHOUSING ........................................................................................................ 33
5.1. GENERAL................................................................................................................................... 33
5.2. COST STRUCTURE..................................................................................................................... 34
5.3. SERVICES PROVIDED BY WAREHOUSES ..................................................................................... 35
5.4. GOVERNMENT POLICY ON LOGISTICS PARKS AND FREE TRADE WAREHOUSE ZONES(FTWZ). .. 35
5.5. ISSUES RELATED WITH POOR GROWTH OF WAREHOUSING.......................................................... 36
CHAPTER 6: COLD CHAIN ............................................................................................................. 38
6.1. INTRODUCTION........................................................................................................................... 38
6.2. 2ND GREEN REVOLUTION .......................................................................................................... 38
6.3. INTEGRATED COLD CHAIN CONCEPT ......................................................................................... 39
6.4. DIFFERENCE BETWEEN COLD STORAGE AND TEMPERATURE CONTROLLED WAREHOUSE(TCW 39
6.5. CHILL/FREEZING INJURIES......................................................................................................... 39
6.6. PROCESS................................................................................................................................... 40
6.7. PRE-COOLING ........................................................................................................................... 40
6.8. BENEFITS.................................................................................................................................. 41
6.9. MARKET ANALYSIS.................................................................................................................... 42
6.10. DEMAND AND SUPPLY GAP...................................................................................................... 42
6.11. MARKET SIZE.......................................................................................................................... 43
6.12. COST STRUCTURE. .................................................................................................................. 43
6.13. LOCATION OF TCWS ............................................................................................................... 46
6.14. ISSUES RELATED WITH POOR GROWTH OF WAREHOUSING........................................................ 46
6.15. HINDRANCES IN COMMERCIALIZATION OF TCWS ..................................................................... 47
6.17. STEPS TAKEN BY GOVERNMENT OF INDIA TO PROMOTE TCWS ................................................ 47
6.18. REGULATORY FRAMEWORK ..................................................................................................... 48
6.19. RISK ANALYSIS: ...................................................................................................................... 49
6.20. OWNERSHIP OF COLD CHAIN. .................................................................................................. 49
CHAPTER 7: CONCLUSION............................................................................................................ 51
REFERENCES .................................................................................................................................. 54
Page 6 of 57
List of Figures
Figure 1: Heads of Logistics.............................................................................................. 10
Figure 2: Spectrum of Logistics......................................................................................... 11
Figure 3: Proposed Expenditiure on Roads for balanced modal mix................................. 17
Figure 4: Truck Ownership in India ................................................................................... 18
Figure 5: Rail spend up to 2020 ........................................................................................ 22
Figure 6 : Inland Waterways of India................................................................................. 27
Figure 7: GST Driven Warehousing reorganization........................................................... 37
Figure 8 : A typical ambient supply chain for fruits and vegetables................................... 38
Figure 9 : Flow Chart of Integrated Cold Chain ................................................................. 39
Figure 10 : Product flow in a Cold Chain........................................................................... 40
Figure 11 : Market Size - Cold Chain ................................................................................ 43
Figure 12: Capital cost break-up TCW .............................................................................. 44
Figure 13 : Typical US Cooperative Cold Chain................................................................ 49
Figure 14: Proposed shift in Inter Modal Transport ........................................................... 51
Page 7 of 57
List of Tables
Table 1: Country wise Logistics cost as percent of GDP................................................... 12
Table 2: Elements of Logistics costs ................................................................................. 13
Table 3: Comparison of Logistics Performance Index of Comparative Countries ............. 14
Table 4 :Comparison of Key parameters of Logistics, India vs. Global ............................. 15
Table 5: Challenges and Suggested Mitigation measures associated Roads................... 19
Table 6: Indian Railways losing freight market share ........................................................ 21
Table 7: Challenges and Suggested Mitigation measures associated with Railways........ 22
Table 8 : Challenges and Suggested Mitigation measures associated with IWT, Costal
Shipping and Ports............................................................................................................ 30
Table 9: Details of types of Warehouses........................................................................... 33
Table 10 : Break Up of Capital cost of Warehouses.......................................................... 34
Table 11 : Break Up of Operating Cost of Warehouse ...................................................... 35
Table 12: Salient aspects of Logistics Parks and FTWZs ................................................. 35
Table 13 : Challenges and Suggested Mitigation measures associated with Warehousing
.......................................................................................................................................... 36
Table 14 : Post Harvest Life Comparison of Some Common Use Items........................... 41
Table 15: Demand Supply of TCW storage....................................................................... 42
Table 16 : Challenges and Suggested Mitigation measures associated with Setting Up of
Cold Chain ........................................................................................................................ 46
Table 17 : Risk Allocation framework for TCW project ...................................................... 55
Page 8 of 57
Abstract
Transportation is an essential and major sub head of logistics. In fact it is back bone of
entire logistics and supply chain business. A sound transportation system will result in
right product in right quantity, in right condition, at right place, in right time at right
price to right customer.
Despite being the second largest food producer, quite a few people in India do not get two
square meals. Main reason behind this is 25-40% of produce gets wasted due to lack of
proper handling after harvest and storage. In order to avoid said wastage food grain and
agricultural produce is stored in Controlled Atmosphere Storage (CAS)/ Temperature
Controlled Warehouses (TCWs), where in spoilage due to aging of produce is arrested.
Thus it is essential to know various challenges associated with various components of
logistics and CAS/TCW, so that necessary steps can be taken to address them.
So in order to find out various issues extensive research and interactions with some
industry players was carried out and answers to following questions are addressed in this
report:-.
 Why logistics costs are more in India Vis a Vis other global competitors? Suggest
measures to reduce them.
 What are the various challenges faced by Indian Logistics industry in various
sectors and how can they be mitigated?
 Controlled atmosphere storage facility should be located near the production center
or consumption center. Comment
 What are the various hindrances in development and commercialization of
controlled atmosphere storage?
 What are the various measures Government has taken to promote to usage
controlled atmosphere storage?
Page 9 of 57
 How various PPP models can be incorporated in establishing controlled
atmosphere storage?
Page 10 of 57
Chapter 1: Introduction
1.1. Before we start it is imperative that we should know what we mean by logistics. As
per Wikipedia and Oxford dictionary meaning of Logistics are given below:-
(a). The word logistics has its origin in the French verb loger to lodge or to quarter. Its
original use was to describe the science of movement, supplying & maintenance of military
forces in the field. Later on it was used to describe the management of materials flow
through an organization, from raw materials through to finished goods.
(b). Logistics is considered to have originated in the military's need to supply
themselves with arms, ammunition and rations as they moved from their base to a forward
position. In ancient Greek, Roman and Byzantine empires, military officers with the title
Logistikas were responsible for financial and supply distribution matters.
(c). Oxford English Dictionary defines logistics as "the branch of military science relating
to procuring, maintaining and transporting materiel, personnel and facilities." Another
dictionary definition is "the time-related positioning of resources."
(d). Logistics management deals with application of management principles to logistics
operations for efficient and cost effective movement of goods and personnel.
Figure 1: Heads of Logistics
(Source: National Skill Development Corporation, Transportation, Logistics, Warehousing, Packaging Sector
2022-A Report).
Logistics
Transportation Warehousing Value added service
Page 11 of 57
Figure 2: Spectrum of Logistics
(Source: Transportation in India vol 1 by KPMG)
1.2. Economic development of any country requires efficient logistics / supply chain
management. Logistics infrastructure includes all means of modern transport of a country.
Studies of various analysts and organizations have forecasted due to fast pace of
economic growth soon India will emerge as a manufacturing hub. Due to which freight
traffic will increase by 100%.
Page 12 of 57
1.3. The annual logistics cost in India is estimated to be 14% of GDP, while same is only
8% in US. Logistics costs is a huge cost to any industry and generally second to material
used in manufacturing. Generally logistics expenditures are to the tune of 5-35% of sales,
depending upon terrain, weight, ratio and type of business. Thus by having an efficient
logistics our country can save to the tune of US $ 50 billion per annum. Thus inefficient
logistics not only retard economic growth but also at times leads to discontented customer.
Table 1: Country wise Logistics cost as percent of GDP
S.No Country Logistics Cost as
percent of GDP
1. China 14.5
2. India 14.0
3. Singapore 12.5
4. United Kingdom 12.2
5. France 11.7
6. Japan 10.5
7. United states 8.7
(Source: IMD (2003))
1.4. Typically Logistics Costs will include transportation costs, inventory carrying costs
(including inventories, handling, warehousing and transportation) and administrative costs.
1.5. Impediments to Indian logistics industry are not only limited to poor physical
infrastructure but also includes poor communication, low penetration of Information
technology there by hampering flow of information, interstate taxation, carriage of less
than truck load and more than full truck load, illiteracy of truck drivers, financial exploitation
by fleet operators, monopoly of Indian Railways in freight carriage by rail , lack of
Page 13 of 57
dedicated rail freight corridor, low mechanization of ports, poor IT skills of managers also
affects logistics industry adversely. Thus it is very relevant to single out these impediments
and necessary actions to be undertaken at the earliest to resolve them so as avoid any
hindrance in economic growth of nation.
1.6. Presently India’s competitive advantage of low cost manufacturing is greatly eroded
due to high logistics costs in general and transportation cost in particular. Due to poor
transportation infrastructure and cumbersome documentation, delays are caused there by
resulting in holding more inventories which leads to holding more inventory thus increasing
inventory cost and warehousing cost etc. Thus in order to reduce logistics cost, our focus
should be improved physical infrastructure and policies and rest of things will automatically
fall in place.
Table 2: Elements of Logistics costs
S.No Head Percent Contribution
1. Transportation 40
2. Warehousing , Packaging and
losses
26
3. Inventory 24
4. Order processing 10
(Source: Sanyal (2006a))
1.7. In fact World Bank has derived an Logistics Performance Index, (LPI) is an
interactive benchmarking tool to help countries identify the challenges and opportunities
they face in their performance on trade logistics and what they can do to improve their
performance. Various parameters measured in LPI are given below:-
(a) Efficiency of the customs clearance process.
(b). Quality of trade and transport related infrastructure.
(c). Ease of arranging competitively priced shipments.
Page 14 of 57
(d). Competence and quality of logistics servicies.
(e). Ability to track and trace consignments.
(f). Frequency with which shipments reach the consignee within scheduled time.
1.8. If we compare our country LPI with of other comparative countries whose size/
economy is also developing like our country, we see that only in international shipments
and customs we are better off than Brazil and slightly ahead of South Africa in timeliness
and in rest of the parameters we are lagging behind.
Table 3: Comparison of Logistics Performance Index of Comparative Countries
(Source: World Bank)
Page 15 of 57
1.9. Comparison of some key parameters pertaining to Indian logistics setup with global
averages is given below:-
Table 4 :Comparison of Key parameters of Logistics, India vs. Global
(Source: Transportation in India vol 1 by KPMG)
1.10. In order to study challenges faced by Indian Logistics, we shall be discussing them
under following heads:-
(a). Roads
(b). Railways.
(c). Waterways and Ports.
Page 16 of 57
Chapter 2: ROADS
2.1. General India has one of the largest road networks in world, aggregating to present
consisting of 200 km of Expressways, 66,754 km of National Highways, 128,000 km of
State Highways, 470,000 km of Major District Roads, and about 2,650,000 km of other
district and rural roads. National Highways account for only about 2 per cent of the total
road length of the country, but carry about 40 per cent of the total traffic across the length
and breadth of the country. Out of the total length of National Highways, about 35 per cent
is of single lane/ intermediate lane width, about 53 per cent is 2-lane standard, and about
12 per cent is 4-lane standard or more.
2.2. Improvement in the road network : Through the twin objectives of accessibility and
mobility has been accorded high priority in developmental planning. The accessibility
objective is to be achieved through improved rural roads network through the Pradhan
Mantra Gram Sadak Yojana (PMGSY), which aims at connecting every village with all-
weather roads. The mobility is to be facilitated through improvement in capacity and
strengthening high-density corridors. Considering the importance of the National Highways
and the rapid increase in traffic, the Government has taken up the National Highways
Development Project (NHDP). The first initiative in this regard was the 4/6 laning of the
Golden Quadrilateral followed by the North South – East West (NS–EW) corridor. Further,
keeping in view the need for nationwide connectivity, the Committee on Infrastructure,
under the chair of the Prime Minister, has approved the a seven phase programme for
highway development, with the investment of INR 236,247 crore.
2.3. Share of Transportation Load: Roads are the dominant mode of transportation in
India today. They carry almost 90 percent of the country’s passenger traffic and 56 percent
of its freight due to lower cost, flexibility and last mile connectivity. The density of India’s
highway network -- at 0.66 km of highway per square kilometer of land – is similar to that
of the United States (0.65) and much greater than China's (0.16) or Brazil's (0.20).
However, most highways in India are narrow and congested with poor surface quality, and
40 percent of India’s villages do not have access to all-weather roads. In order to improve
Page 17 of 57
road network and make it congestion free reallocation of budgetary allocations should be
carried out.
Figure 3: Proposed Expenditiure on Roads for balanced modal mix
(Source: Building India, transforming the nation’s logistics infrastructure by Mckinesy India)
Page 18 of 57
2.4. Fleet Configuration. Road transport is fragmented and most of the truck operators
are having a small fleet of 4-5 trucks. Small fleet operators carry large proportion of
national freight and almost most of the regional freight. Drivers of small fleet operators are
generally uneducated and paid low wages to use old and vintage equipment so as to
capture business with low quotes and hardly any effort is made to provide any value
added service.
Figure 4: Truck Ownership in India
(Source: Transportation in India vol 2 by KPMG)
Page 19 of 57
2.5. Challenges and suggested mitigation measures associated with road: Same have
been tabulated below:-
Table 5: Challenges and Suggested Mitigation measures associated Roads
S.No Challenges Suggested Mitigation Measures
1. Poor and inadequate road
infrastructure.
Stricter norms by Indian Road congress.
Adopt PPP mode and involve
participation of private players in
improvement of infrastructure.
2. Roads passing through
congested areas.
Construction of bypasses well outside the
city limits.
3. Damage to roads by overloading
of trucks.
Model Concession Agreement to be
amended to include provision of
weighbridges at all toll collection points.
Surprise check of trucks to be carried out
and data captured should be
electronically transferred to a central
location.
Strict compliance of Supreme Court of
India directions and detain trucks at toll
booths so as to avoid damaging of roads.
4. Interstate taxation and multiple
check posts.
Implementation of GST.
5. Different interpretation of laws. Intervention of Supreme Court of India
6. Delay at toll collection points. Electronic toll collection with daily
clearing system and electronic transfer of
revenue share to escrow account.
7. Old trucks with Vintage
technology.
Use of latest and modern multi axle
trucks with aerodynamic body, better fuel
efficiency and more load carrying
capacity.
Page 20 of 57
Lower per ton toll rates for modern
trucks.
Tax benefit for use of modern trucks.
Phasing out of trucks older than 15
years.
8. Driver fatigue due to poor design
of vehicles.
Use of modern trucks with ergonomic
design for better crew comfort.
Creation of way side amenities for rest of
drivers.
9. Unfair competition. Due to
fragmented industry, smaller
player get away with paying less
taxes and avoid regulatory
norms.
Organized players should showcase
value added service like prompt delivery,
safety and insurance cover of goods.
10. Multiple check posts and
harassment by government
officials.
Educated drivers.
11. Different rates of taxation among
states.
Taxation rules pertaining to all states
should be same.
12. Delay caused at state borders for
checking of documents.
Networking of all check posts and RTOs.
Driver to file scanned copy of documents
at starting station.
Revenue to be shared by use of
smartcards.
Also help in identifying trucks with bogus
registration numbers.
Page 21 of 57
Chapter 3: RAILWAYS
3.1. General. Indian Railways (IR) is the principal mode of transportation for bulk freight
and long distance passenger traffic. It is the world’s second largest rail network under a
single management, and has been contributing to the industrial and economic landscape
of the country and is one of the world’s largest employers. Of the main two segments—
freight and passenger—of IR, It carries some 17 million passengers and 2 million tonnes
of freight a day in year. Freight segment accounts for roughly two-thirds of revenue. Within
the freight segment, bulk traffic accounts for nearly 95 per cent, of which coal is about 45
per cent. At the end of 2008–09, the IR network was spread over 63,630 route kilometres
(rkms), comprising 52,002 rkm of broad gauge and 11,628 rkm of metre gauge. Around 36
per cent of this network is electrified. IR loaded 833 million tons of revenue generating
payload and generated 538 billion net tonnes kilometre (BTKM).
3.2. Losing Market Share: Over a period of time railways are losing quite a considerable
amount of freight share to road network. Same is evident from table given below:-
Table 6: Indian Railways losing freight market share
Page 22 of 57
3.3. Budgetary Reallocations: In order to regain its earlier market share railways will have to carry
out a introspection and reallocate budgetary allocations. Same has been amplified in the figure given
below:-
Figure 5: Rail spend up to 2020
(Source: Building India, transforming the nation’s logistics infrastructure by Mckinesy India)
3.4. Challenges and suggested mitigation measures associated with railways: Same
have been tabulated below:-
Table 7: Challenges and Suggested Mitigation measures associated with Railways
S.No Challenges Suggested Mitigation Measures
1. Carriage of Less payload i.e. in
tune of 20.3-22.9 tons/axle in
goods wagons.
Revisit payload guidelines and make it to
30 ton/axle for goods wagon.
2. Non availability of funds to
replace poor and old railway
tracks and sleepers.
Optimal loading of wagons.
Invest in better wagons with more
carriage capacity.
Utilize additional revenue generated for
Page 23 of 57
improvement/ replacement of
infrastructure.
3 Poor design of wagons. Wagons to have heavy base to bear load
and sidewalls of light and composite
material so as to reduce tare weight,
increase payload with same gross
weight.
4. Movement of empty wagons. Revisit tariff structure and share revenue
when importers are exporters also.
Discount to users on return haulage, so
as to recover cost of running and not to
earn profits.
4. Delay in loading/unloading of
wagons.
Use of precision calibrated mechanical
handling equipment to load wagons.
Use of wider access by fixing sliding
doors to have more number of persons
for manual loading.
5. Optimum loading of wagons
carrying processed food/ delicate
items.
Modification of covered wagons such that
they should have provision to place a
horizontal sheet for carrying additional
load.
6. Poor access to railway stations. Shift/ construct dedicated freight handling
stations on the outskirts of town for
speedy and timely movement of cargo.
7. Less freight volume. Run goods train as per a fixed schedule.
Invite private players to run dedicated
sidings and provide value added door to
door service and share revenue.
8. Design of infrastructure. New infrastructure should be created with
a futuristic vision. Like instead of double
Page 24 of 57
stacking of containers it should cater to
triple stacking and also Over Dimension
Consignment.
9. Overburdened corridor resulting
in low priority and slow
movement of goods train.
Timely and early completion of dedicated
freight corridors.
10. Timely completion of projects. Award of contracts to private players with
penalty clause for delay.
11. Sudden fare revision jeopardizes
long term contracts.
Fare revision should be related either
with Whole Sale Price Index / Energy
charges. Should be revised every 10%
change either way.
12. Shortage of Wagons Bulk users to own private wagons and
freight charges to be adjusted
accordingly.
Will reduce wagon maintaince load of
wagons to a large extent.
13. Shortage of funds for track up
gradation.
Use budgetary allocation for mechanizing
loading/unloading sites.
Increase speed of trains.
Faster turnaround will result in more trips
generation.
Additional revenue generated can be
used for track up gradation in phased
manner.
Page 25 of 57
Chapter 4: WATERWAYS & PORTS
4.1. General. Historically most of the civilizations came up next to water bodies due to
availability of water for daily usage and agricultural purpose. Thereafter initially major
industries also came on banks of a water bodies as it not only provided water for industry
but also for movement of raw materials and semi finished/ finished goods. Transport over
waterways is especially effective when the source and/or destination are waterfront
locations and connected. It is one of the most effective and cheapest means of transport
as operating costs of fuel and environmental pollution is lowest than for corresponding
volumes of movement by road, rail or air. For domestic freight water transport can be
divided two categories i.e. Inland waterways which includes rivers, canals and lakes and
Coastal shipping.
4.2. Advantages: Major advantage of waterway is the main infrastructure is often
naturally available, which only has to be modified i.e. by creating adequate depth,
maintained and upgraded by creating suitable infrastructure on coasts. The viability of
goods movement using waterways can be analyzed from following perspectives:-
(a) Technological.
(b). Physical viability.
(c). Commercial potential.
4.3. Inland Water Transportation: Inland water transport includes natural modes as
navigable rivers and artificial modes such as canals. The Inland waterways have played
an important role in the Indian transport system since ancient times as mentioned earlier.
However, in recent times the importance of this mode of transport has declined
considerably with the expansion of road and rail transport. In addition, diversion of river
water for irrigation has also reduced the importance of inland water transport. The decline
is also due to deforestation of hill ranges leading to erosion, accumulation of silt in rivers
and failure to modernize the fleet to suit local conditions.
Development of inland water transport commenced from the Second Five Year Plan and
up to the end of Fifth five year plan the total expenditure on this sector was Rs. 34 crore. It
Page 26 of 57
was only in the Sixth Five year plan that this sector was given priority and specific
schemes of inter-State and national importance for development of inland water transport
were taken up. The Seventh Plan was an important landmark in the development of inland
water transport. The expenditure on this sector in the Plan (at Rs. 131.85 crore) was more
than the expenditure incurred right up to the end of the Sixth Plan. Inland Waterway
Authority of India (IWAI) was set up on October 27th
1986, for development and regulation
of inland waterways for shipping and navigation which is a big step forward and should
help in the accelerated development of inland water transport. In 2007-08 inland
waterways were used to carry a freight of 55.82 million tons which was just 0.34% of
14500 million tons of total Indian freight. Actions are being carried out to increase this
percentage to 2% by 2025.
4.4. Inland Waterways: Five Inland waterways have been declared. All these
waterways are governed by IWAI. Brief about them is given below:-
 National Waterway No 1: Ganga – Hooghly River Water System – 1620 KM. From
Haldia, (West Bengal) to Allahabad (Uttar Pradesh) passing through Uttar Pradesh,
Bihar and West Bengal.
 National Waterway No 2: Bramaputra River - 891 KM. From Sadia to Dhubri in
Assam.
 National Waterway No.3: West Coast Canal Including Champakkara &
Udyogamandal Canals - 205 Km. From Kollam to Kottapuram in Kerala.
 National Waterway No.4: Integrated Canal System from Kakinada Port to
Pondicherry including Godavari & Krishna Rivers - 1095 Km in Andhra Pradesh
Tamilnadu and Pondicherry.
 National Waterway No.5: East Coast Canal Integrated with Brahmani & Mahanadi
Delta River System - 623 Km in West Bengal & Orissa.
Page 27 of 57
Figure 6 : Inland Waterways of India
( Source: IWAI website)
4.5. Conditions for a Waterway1. A water body can be declared a Waterway provided it
meets following criteria:-
 It should possess capability of navigation by mechanically propelled vessels of
minimum 300 tonnes (DWT) capacity (45m x 8m x 1.2m), and
 It should have a fairway of minimum 40m wide channel with 1.4m depth in case of
rivers and minimum 30 m wide channel with 1.8 m depth in case of canals.
(Exception may be given in case of irrigation-cum-navigation canals based on
request of the concerned State Govt in order to safeguard the interest of irrigation).
 It should be continuous stretch of minimum 50 kms; the only exception to be made
to waterway length is for urban conglomerations and intra-port traffic, and pass
1: IAWI Website
Page 28 of 57
through and serve the interest of more than one states, or connect a vast and
prosperous hinterland and major port, or either pass through or connect a strategic
region where development of navigation is considered necessary to provide logistic
support for economic development or national security, or connect place not served
by any other mode of transport.
4.6. Advantages of Waterways: Waterways provide enormous advantages as a mode
of transport compared to land and air modes of transports. Some of them are given
below:
 Low Capital Cost. Requires only 5-10% of cost of developing an equivalent four
lane expressway.
 Low Maintenance Cost. Maintenance cost is only 20% of equivalent roadway.
 Fuel Efficient. Due to fuel efficiency cost of transportation goes down. It is
estimated that 1 liter of fuel can move 105 ton-km by inland water transport.
Whereas the same amount of fuel can move only 85 ton-km by rail and 24 ton-km
by road.
 Convenient For Bulk and Over Dimension Cargo.
 Easy integration with sea transport - Inland water transport can easily integrated
with Sea transport and hence it reduces the extra cost required for land-sea or air-
sea transport interface infrastructure development. It also reduces the time taken
to transfer the goods to and from sea transport vessels.
 Environment Friendly. The biggest advantage of IWT is that its pollution less, less
effect on the environment & more on the economy and most importantly no Land
acquisition is required.
Page 29 of 57
4.7. Disadvantages of Inland Water Transport systems
 Low availability of inland waterways - Out of the total inland water body available in
the world, very low percentage of it is potentially navigable.
 Low speed - Water transport is much slower than its competitors
(Source: IWAI website)
4.8. Coastal Shipping. India has a long coastline of 7,516 kms, a number of ports (12
major and 200 minor working ports) and a vast hinterland. Therefore coastal shipping
holds a great promise more so because it is the most energy efficient and cheapest mode
of transport for carriage of bulky goods like iron and steel, iron ore, coal, timber, etc.
over long distances. Despite this only 7% of domestic cargo moved by coastal shipping.
4.9. Reasons for Less traffic. The main factors affecting the growth of coastal shipping
adversely are given below:-
 High transportation costs. Due to multiple handling of cargo overall transportation
cost becomes high.
 Poor turnaround time due to port delays, over aged vessels and lack of mechanical
handling facilities. It is estimated that at present 70 per cent of ship time is spent at
ports and only 30 per cent on voyage.
 Imbalance in coastal traffic movement, results in non availability of adequate traffic
for both legs of journey there by at times ships have to travel with ballast, on
return journey.
(Source: www.adb.org/Documents/Papers/INRM-PolicyBriefs/inrm14.pdf)
Page 30 of 57
4.10. Challenges and suggested mitigation measures associated with IWT, Costal
Shipping and Ports: Same have been tabulated below:-
Table 8 : Challenges and Suggested Mitigation measures associated with IWT,
Costal Shipping and Ports
S.No Challenges Suggested Mitigation Measures
1. Insufficient depth/draft, excessive
siltation, frequent shifting of
channel.
Periodic and regular dredging and create
draft up to 2.5 / 3 meters in water
channels and at least 17 meters at port .
Use of low draft barges.
2. Low speed. Use of modern equipment.
3. Non availability of cargo/ return
cargo
Tax benefits/holidays for setting up of
industry on banks of national waterways.
4. Inefficient handling of goods due
to lack of infrastructure.
Concessions for creation of infrastructure
at selected places under a laid down
policy.
5. Disposal of dredged material Use it as embankment for channelizing
and increasing depth of channel.
6. Non availability of high
technology vessels.
Wavier in custom and excise duty for off
the shelf purchase.
Subsidy/ Viability gap funding for building
high technology vessels/barges.
7. Non availability of night
navigation aids
Budgetary allocation for off the shelf
procurement.
PPP mode. Private party installs said
infrastructure and charges user (BOT
Concession)/ Government pays annuity
to private party (BOT Annuity).
8. Shore protection work Budgetary allocation for execution of civil
work and tree plantation at crucial places.
Page 31 of 57
9. High tariffs particularly at ports. Priority berthing rights at earmarked
berths with discount on port dues.
10. Lack of talent due to income tax
laws.
Amend income tax laws to provide same
benefits to people employed in vessels
engaged in coastal shipping.
11. High cost of bunker fuel Same treatment to be meted out to all
vessels whether employed in coastal
shipping and inland waterways.
12. Poor infrastructure at ports Upgrade mechanical handling equipment
at ports.
Discard vintage and inefficient equipment
as scrap.
Incentivize port labor for achieving
certain levels.
13. Poor efficiency at ports Use of modern/ state of art mechanical
handling equipment.
Procure adequate no of mechanical
handling equipment.
Participation of private players in creation
and up gradation of port infrastructure.
14. Shortage of space for expansion Participatory approach. Persons whose
land has been acquired may be allocated
a share of profits for duration of
concession.
15. Capital intensive Grant of Infrastructure status like roads
so as to enjoy tax benefits and borrowing
at low cost.
16. Cabotage Law Revisit provisions of Cabotage law and
open coastal shipping for foreign players
to have more competition.
Page 32 of 57
Policy can be revised at a later stage.
17. Poor hinterland connectivity for
speedy evacuation of cargo.
Connect all ports with broad gauge
railway station and national highways.
Amend guidelines and all ports having
traffic of laid down limits to have railway
siding in a stipulated timeframe.
18. High port dues. Faster turnaround of ships will result in
more number of ships being turnaround
in same time, thereby reducing charges
levied on ships.
19. Multiple regulator Policies should be formulated after due
consultation with affected ministries and
various industries federations like CII and
FICCI.
Page 33 of 57
Chapter 5: Warehousing
5.1. General. Typically warehousing in India can be divided into two categories, firstly
Government and secondly private. Government warehousing basically dealt with storage
of food grains in warehouses of Food Corporation of India (FCI) and Central Warehousing
Corporation (CWC). On other hand private warehouses/godowns has been dominated by
small players with small capacities and poor material handling, stacking and monitoring
technologies. In fact quite private warehouse/godowns used to be a medium size room
with goods kept all over in an unorganized manner. Generally these warehouses were
used by transporters to store goods pending collection from consignee or aggregate goods
prior to dispatch a full truck load to a particular destination or by a wholesaler using it for
stocking for further distribution. Relevant aspects of different types of Warehouses are
given below:-
Table 9: Details of types of Warehouses
S.No Type of Warehouse Details
1. Private Owned & operated by private entities and individuals.
Licensed for exclusive use of goods owned, imported
by or on behalf of licensee only.
2. Public Licensed by government to private entities, individuals
or cooperative society.
Permitted to offer storage facilities to general public or
other entities for a fee.
Typically located near transportation points and critical
in marketing of agricultural products.
3. Bonded Licensed to accept import goods for storage until
payment of customs duty.
Warehouses give a "Bond" that goods will not be
removed without prior consent from customs
authorities.
Page 34 of 57
Primarily located near ports. Operated by government.
Used primarily by importers & exporters.
(Source: Research on India Warehouse 2009)
As warehouse is one of the vital components of logistics management. It is pertinent to
mention here that warehousing cost accounts for about 25-27 per cent of the total logistics
cost thus warehousing has become an important focus point. With growth in export import
trade, arrival of organized players and government policies like Logistics Hubs and rolling
out of Goods and Service Tax (GST) sector is going to witness significant growth.
5.2. Cost structure: Cost break up of various components of warehouse are given
below:-
(a). Capital Cost. A warehouse with a capacity of 0.15 million sq feet will require a
capital outlay of INR 140-150 million.
Table 10 : Break Up of Capital cost of Warehouses
S.No Head Percentage
of Total Cost
Remarks
1. Land 14 Vary as per location.
Minimum area of 3-5 acres
2. Civil Work 77 Min eco size is 0.12-0.15 million sq ft.
3. Plant & equipment 6 Fork lift, weighing machine, firefighting
equipment, racks and pellets etc.
4. Land development 2
5. Misc assets 1
6. Gestation Period - 1-2 years
(Source: CRISIL Research, Warehousing 2009)
Page 35 of 57
(b). Operating Cost.
Table 11 : Break Up of Operating Cost of Warehouse
S.No Head Percentage of Total Cost
1. Rentals and Capital Charges 52
2. Labor 26
3. Repairs & Maintenance 10
4. Electricity 8
5. Pallet charges 4
(Source: CRISIL Research, Warehousing 2009)
5.3. Services provided by Warehouses. In fact now warehouses are not only used for
storing goods but also value added services like packaging, distribution , transportation,
tracking and reverse logistics etc. In fact FCI has outsourced its warehousing and
distribution functions to Adani Agro Logistics Limited (AALL) for 20 years in certain
locations. AALL will not store food grain in specially designed silos at designated locations
but also ferry it to distribution centers located in other parts of India in specially designed
wagons under ― USE OR PAY ― contract.
5.4. Government policy on Logistics Parks and Free Trade Warehouse Zones(FTWZ).
In order to boost warehousing development, government has invited private sector to build
Logistics Parks and FTZW. Salient aspect of Logistics Park and FTWZ are given below.
Industry is likely to grow by a rate of CAGR of 9% till 2013-14 and may see an overall
investment of up to INR 300 Billion.
(Source: CRISIL Research, Warehouse 2009)
Table 12: Salient aspects of Logistics Parks and FTWZs
S.No Parameter Logistics Park FTWZ
1. Description Includes warehouses,
container facilities and cold
chain infrastructure
Special form of SEZ with focus
on warehousing and
international trading.
2. Components Rail and Road connectivity. Standard and Bonded
Page 36 of 57
Banks, ATMs etc
Hotels, Food parks and
entertainment facilities.
Warehouse.
Rail and Road sidings.
3. Focus Domestic Market EXIM trade
4. Regulatory Classified under
Infrastructure Industry
Designated as foreign territory.
Governed under SEZ Act 2005.
5. Specification NA Minimum built up area of 0.5 mn
sq mtrs
Minimum area of 40 Hectares
Minimum capital outlay of INR 1
billion.
6. Incentives 22% tax exemption for
continuous operations for 10
years.
Granted only to developers.
Same as SEZ.
Developers and operators can
avail benefits
7. Location Near SEZs and dedicated
freight corridor
FTWZ itself is considered as an
SEZ
(Source: Research on India Warehouse 2009)
5.5. Issues related with poor growth of warehousing. Various issues related with
Warehousing industry and their mitigation measures have been tabulated below:-
Table 13 : Challenges and Suggested Mitigation measures associated with
Warehousing
S.No Challenges Suggested Mitigation Measures
1. Huge investment on setting up of
warehouse.
Logistics parks may compensate same
by giving some tax breaks.
2. Warehouses located in each
state due to complex tax
structure.
Rolling out of GST will result in reduction
of warehouses
3. Limited organized and
outsourced warehousing
Growth in organized retailing will boost
warehousing.
Page 37 of 57
4. Inefficient handling of goods. Use of IT for better inventory
management and modern mechanical
handling devices will improve efficiency.
Figure 7: GST Driven Warehousing reorganization
(Source: Transportation in India vol 2 by KPMG)
Page 38 of 57
Chapter 6: COLD CHAIN
6.1. Introduction: India is the world’s second largest producer of food. India produces 47
million tons of fruits and 96 million tons of vegetables annually. Out of this 25-40% of
annual agricultural produce is wasted and does not reaches consumer. In fact in 2003
produce worth INR 58,000 crore was wasted while same amount has been reduced to INR
30,000 crore in 2010. Following are reasons for same:-
(a). Improper post harvest handling due to lack of awareness among farmers about
advantages and methods of pre-cooling.
(b). Poor road and transportation infrastructure result in slow movement of produce
from to place of origin to point of sale.
(c). Unavailability of temperature controlled warehouses.
Figure 8 : A typical ambient supply chain for fruits and vegetables
(Source: Avon Consulting Research)
6.2. 2nd Green Revolution – As 1st
Green Revolution emphasized on modernization and
mechanization of means of agriculture. Now due to rapidly rising population and shrinking
agriculture land, 2nd
Green Revolution has to come by ensuring zero wastage of produce
between point of origin and point of sale by proper processing & preservation.
Page 39 of 57
6.3. Integrated Cold Chain Concept. Cold Chain is a system which provides a series of
facilities for maintaining ideal storage conditions for perishables from the point of origin to
the point of sale. Pictorial diagram of same is given below.
Figure 9 : Flow Chart of Integrated Cold Chain
6.4. Difference between Cold Storage and Temperature controlled Warehouse(TCW).
Cold storage and TCW both use low temperature to store products but TCWs are more
scientific and systematic in nature. In fact cold storage preceded TCWs. In cold storage
temperature used to be fixed for complete storage, while in case of TCW, temperature of
storage is maintained as per product kept inside storage, so as avoid chill / freezing
injuries to product.
6.5. Chill/Freezing Injuries. It is basically injury/ decomposition and/or deterioration of
produce due to exposure to low temperatures. Temperature is dependent on product and
may not be same for everyone. Due to this injury certain products may start producing
Ethylene gas also, which may result in damage to other products also which are healthy
so far. In fact certain drugs/ injections decompose due chill / freezing injury and lose their
potency and may be harmful due to change in composition.
Collection
Centres
Processing
centre
Temperatur
e
Controlled
Warehouse
(TCW)
Temperatur
e
Controlled
Transport
( TCTs /
Reefer
Vans)
Point of
Sale/
Retail
Stores
Consumer
Handleing/
Refrigitatio
n
Page 40 of 57
6.6. Process. After collection from farm i.e. point of origin, produce has to go through
various stages before it reaches a buyer. Schematic diagram of these activities is given
below. In the above activities two processes of Pre-cooling and handling (from point of
harvest to point of sale) are very important as small error can be very costly. Details about
Pre-cooling are given below. However if produce is not properly handled to include
transported, cleaned, graded, sorted and packaged, might result in one bad product may
pass through, then due to volume of produce stored it will be a herculean task to find out
that bad product later on. Processing of bad product may remind us of old adage that ―One
Bad Apple may spoil the Whole Basket‖. Due to enormous volume, size of basket may
become quite large, thus there is a requirement of frequent and periodic inspection and
turnover of produce stored in the CAS/ TCW. This will lead to arrest the deterioration of
other produce at the earliest.
Figure 10 : Product flow in a Cold Chain
(Source:-http://www.slideshare.net/pxkohli/module-cc)
6.7. Pre-Cooling. Pre-cooling is key component in the preservation of quality for
perishable by rapid removal of heat from freshly harvested produce. Due to exposure to
sun and ambient temperature a lot of heat is stored inside farm produce. Respiration due
to enzymatic oxidation in the growing produce continues after harvest. This process
results in the consumption of sugars, starches and moisture without replenishment by the
Page 41 of 57
plant. Carbon dioxide and other gases along with heat are generated in the process. If the
heat is not removed, the process is accelerated. Growth of molds and the loss of moisture
from the produce are also accelerated by heat. Bruising of the produce further accelerates
these processes, resulting in the loss of texture, firmness, color, flavor and appearance. In
addition, some nutritional value may also be lost. When these losses occur, the produce is
generally considered to have lost its freshness and quality. This process is typically done
before the produce is put into TCW. In fact pre cooling within 5 hours of harvest can
double shelf life of produce.
(Ref: http://www1.agric.gov.ab.ca/$department/deptdocs.nsf/all/agdex7461)
6.8. Benefits: By using a cold chain environment we can reap following benefits:-
(a). Minimize post-harvest spoilage.
(b). Extend shelf life and freshness of produce.
(c). Round the year availability of produce.
(d). Maintain nutritive value.
(e). Prevent decay especially in non vegetarian and dairy products.
(f). Safeguard potency of vaccines.
Table 14 : Post Harvest Life Comparison of Some Common Use Items
S.No Item Post Harvest Life
without Controlled
Atmosphere Storage
(in days)
Post Harvest Life with
Controlled
Atmosphere Storage
(in days)
1. Banana 12 28
2. Mango 12 21
3. Apple 21 180
4. Orange 21 84
5. Papaya 21 84
6. Grapes 10 56
Page 42 of 57
7. Egg Plant 10 14
8. Cabbage 18 180
9. Tomato 7 21
10. Peas 5 14
6.9. Market Analysis. On perusal of benefits mentioned above it can be inferred that
cold chain will be extensively used by following market segment:-
(a). Organized retail malls.
(b). Exotic vegetable dealers.
(c). Frozen non vegetarian product dealers.
(d). Hotels.
(e). Dairy produce dealers.
(f). Wholesale pharmaceuticals distributors.
6.10. Demand and Supply Gap. Cold chain being a nascent industry in India, there is a
huge demand and supply gap, same is evident from following data.
Table 15: Demand Supply of TCW storage
S.No Year Supply
(in Thousand
Tonnes)
Demand
(in Thousand
Tonnes)
Short fall
(in Thousand
Tonnes)
1 2005-06 17000 82,000 65,000
2 2007-08 19000 84,000 65,000
3 2010-11 23000 90,000 67,000
(Source:- www.transreporter.in/index.php?action=page&id=13&issue=SCM&id1=72)
Page 43 of 57
6.11. Market Size. Over past few years market segment of TCWs in value terms have
grown at @19% CAGR, while in volume terms it has grown @12-14% CAGR. As per
research estimates growth rate in volume will be slightly low in forthcoming years due to
capacity addition in last few years. However revenue earned will keep on rising due to
increase in utilisation levels from 60% to 70%. Market size from revenue aspect of cold
chain is given below:-
Market Size - Cold Chain
Figure 11 : Market Size - Cold Chain
(In Billion of Rs)
(Source:- http://www.omafra.gov.on.ca/english/crops/facts/98-021.htm)
6.12. Cost Structure. A cold chain has got two main components i.e. TCWs and TCTs.
In order to reduce cost of land and additional civil construction, processing centre and
TCWs are co-located. Details of various cost structure of a cold chain are given below:-
Cold Chain Cost Rs 250-400 Million
TCW Construction (7-10 TCWs) Rs 30-40 million each
TCT Cost (15-20 TCTs) Rs 1.5-3.5 million each
Page 44 of 57
Minimum Economic Size 4000-5000 Tonnes
Capital Cost /Ton Rs 6000-7000
Land (Cost not included) 1.0-1.5 Acres
6.12.1 Cost Component TCW. Details of various components of TCWs are given
below:-
Figure 12: Capital cost break-up TCW
(Source: CRISIL Report)
6.12.2. Operating cost break-up TCW. Extensive and continue air conditioning is
required so as to maintain desired temperature in various chambers of TCW therefore cost
of power is the main component of operating cost.
Civil
Construction
42%
Refrigeratio
n
25%
Insulation
20%
Others
8%
Utility
5%
Power
64%
Labour
22%
Licence
4%
Maintenance
10%
Page 45 of 57
6.12.3. Solar Power. Some market players in developed countries have tried to
reduce power cost by installing solar/ photo volatile panels on roof of warehouse. Life of
these panels is around 20 years and cost gets break even in approx six years, there by
supplying almost free power for next 14 years or so. Break even period of this option
highly depends on geographical location of warehouse. Power is used in a following
manner.
(i). Initially power from solar panels installed on roof is utilized.
(ii). In case of less daylight, consumption and source of power are prioritized. Light
dimmers which are activated by sensors are used so as to make up for shortfall
power generation and to ensure enough power is available for air conditioning.
(iii). In case of totally over- casted sky, power from grid is drawn.
(iv). At the time of designing warehouse, emphasis light is available in working area
there by reducing power consumption.
(Ref:- http://www.nuworldresearch.com/images/051023%20Payback%20example%20DG%20.pdf)
( Ref:- http://www.corbisimages.com/Enlargement/Enlargement.aspx?id=42-4352066&caller=search)
Page 46 of 57
6.13. Location of TCWs. While planning location of TCW, following two options are
available:-
(a). Next to Produce/ Harvest. When TCW is located close to harvest area it is
economical for farmers to take their produce to TCW also product is relatively fresh as less
time is spent in transportation. It may be possible that TCW may not be utilized for
complete year as area may be producing one crop only. Also setup cost may be less due
to comparatively cheap land but operational cost may be high as product will require
frequent transshipment in TCVs to point of sale. Will require more number of TCVs as
turnaround time of TCV will be more.
(b). Next to Market. When TCW is located next to market it can be operational
throughout the year as different products as per market demand can be stored, however
due care and speedy movement of harvested produce has to be carried out as delay will
set up aging in produce. Initial setup cost may be high due to costly land prices but
operational cost may be less as TCV will be used for shorter distance and frequent
replenishment of retail stores is possible. Also few TCVs will be required due to short
turnaround time.
6.14. Issues related with poor growth of warehousing. Various issues related with
Warehousing industry and their mitigation measures have been tabulated below:-
Table 16 : Challenges and Suggested Mitigation measures associated with Setting
Up of Cold Chain
S.No Challenges Suggested Mitigation Measures
1. Huge Investment on setting up
stores & Refrigerated vehicles.
Opt for Cooperative or PPP model
2. High Operating cost, erratic
Power Supply.
Use of Solar Power panels and intelligent
lighting system with generator for back
up.
Page 47 of 57
3. Food Safety-Increased Incident
of food borne contamination.
Strict adherence to Hazard Analysis
Critical Control Points (HACCP) norms.
4. Allied infrastructure like pre
cooling, transportation etc are not
given any incentive.
Case should be projected to government
through various channels like CII, FICCI
to revise policy.
5. Optimum Utilization of Space Establish backward and forward
integration.
6.15. Hindrances in Commercialization of TCWs.
(a). High Real Estate Prices. A typical 4000 -5000 ton TCW will require 1-1 ½ acre of
land, which may cost INR 1-1 ½ Crore, thereby creating an entry barrier.
(b). Erratic Power Supply. Due to power deficit in country, areas face frequent load
shedding, thus investor has to procure generator set for power back up. Thus
cost on account of procurement and operation of generator goes up.
(c). Psyche of Indian Consumer. Indian consumer is price sensitive and may sacrifice
quality for price hence products may spend more time in storage and shelf there by
reducing margins.
6.17. Steps taken by Government of India to promote TCWs.
(a). Cold chain was given status of Infrastructure in finance budget of 2011, where in
100% FDI is permissible.
(b). Apart from this government has proposed some tax breaks by means of reducing
custom duty to 2.5% and full wavier of exercise duty on plant equipment for
refrigeration, air conditioning and conveyor belts.
(c). Viability Gap Funding by government up to 25% of project cost is permissible.
Page 48 of 57
(d). Launched scheme of mega food parks
6.18. Regulatory framework. In order to ensure safety and quality of products in cold
chain it is vital to preserve the safety and quality of refrigerated foods and comply with
regulatory norms and industry best practices. Hazard Analysis Critical Control Point
(HACCP) spells out norms/practices for processing, handling, distribution and storage of
chilled and frozen foods. HACCP provides management a tool aimed at complete
commitment to product quality and safety. Seven principles of HACCP, with a brief
indication of necessary action are given below: -
 Identify the Potential Hazards: Together with the HACCP team (including
microbiologists and process engineers) construct a flow diagram for all
product/process operations – list all hazards associated with each process step –
list measures which will eliminate or reduce hazards.
 Determine the critical control points (CCPs) for identified hazards: Determine the
CCP (a step at which control can be applied and is essential to eliminate the
hazard).
 Establish the target levels/tolerances for controlling the CCPs: Establish a
predetermined value for control which has been shown to eliminate hazards at a
CCP.
 Establish/implement monitoring systems for controlling CCPs: Set out a planned
sequence of observations or measurements to assess the degree of control on
identified CCPs.
 Identify corrective actions when a deviation occurs at a CCP: Identify a
predetermined action for when the CCP indicates a loss of control.
 Verify that the HACCP system is working: Establish and apply methods to ensure
that the HACCP system is working, including documentary evidence, e.g. auditing,
end product testing, process validation.
 Establish a documentation system for procedures and records: Develop and
maintain procedures and practices for record keeping.
Page 49 of 57
6.19. Risk Analysis: Like any other project, there are lots of parameters which can be
beyond the control of operators of TCW. Associated risks, their allocation and mitigation
framework is given at appendix ―A‖.
6.20. Ownership of Cold Chain. As cold chain is a capital intensive industry and specially
requires huge capital cost in during setup stage. Suggested framework for two ownerships
models i.e. Cooperative Model and Public Private Partnership Models is given below:-
(a). Cooperative Model. In this various stakeholders contribute and form a
cooperative and pool in finances and resources. Setup of a typical US
cooperative is given below:-
Figure 13 : Typical US Cooperative Cold Chain
(Source: Avon Consulting Research)
(b). PPP Model : In order to utilize expertise, experience and finance of private
sector, TCWs can be established in PPP mode where in they will be used
to store precious agri-produce so as to avoid wastage. One such model of
Use or Pay in Build-Own-Operate and Transfer Model (BOLT) is discussed here. In
Page 50 of 57
said model private player will arrange for finance, construct, own, operate and
maintain a TCW for 12-15 years period and there-after handover the infrastructure
to public sector for further operation (Provided technology obsolesce has not taken
place and equipment installed is functioning efficiently ). Government can contribute
in said project by following means:-
 Provisioning of government land for creation of infrastructure.
 Arranging 30% of capital at low interest rates/ viability gap funding as cost of
setting up of TCW chain are high.
 Developing necessary infrastructure like provision of connectivity, electricity
and water etc on priority.
 Arranging mandatory regulatory clearances from single window for early
commencement of project.
 Getting into contract of Use or Pay for 25-35% of storage space/ tonnage for
usage by cooperative stores like Mother Dairy vegetable stores etc to
provide off season vegetables at moderate prices. Revenue earned by
private player by this arrangement will be utilized for day to day operation.
 Provision of power at domestic/ household rates for initial five years i.e. till
the time capacity utilization levels comes to 80-85% (whichever happens
earlier) and thereafter industrial/ commercial prices.
As mentioned earlier that revenue earned by private sector from public sector will
be used to pay for day to day expenditure and revenue earned by own operations
of TCW of 75-65% space/ tonnage, can be used by private sector can be used to
pay back loan amount/ cost of capital.
Page 51 of 57
Chapter 7: Conclusion
7.1. In order to improve India’s logistics efficiency and make it comparable to global
standards it is suggested that a National Integrated Logistics Policy (NILP) should be laid
down. Key objectives of NILP can be:-
 Increase rail freight to more than 45% by 2020.
 Limiting the economic losses attributed to logistics to less than 4 per cent of GDP
(USD100 billion).
 Achieving on-time and on-budget delivery of infrastructure projects, which requires
an improvement in project implementation relative to current performance.
Figure 14: Proposed shift in Inter Modal Transport
(Source: Building India, transforming the nation’s logistics infrastructure by Mckinesy India)
7.2. Key programmes of NILP should focus on following issues:-
 Rail dedicated freight corridors: Programme should have a dual focus. First,
accelerating the construction of two planned DFCs—Delhi- Kolkata and Delhi-
Mumbai—and simultaneously incorporating SPVs for three additional DFCs i.e.
Kolkata-Mumbai, Delhi-Chennai, Mumbai-Chennai corridors.
Page 52 of 57
 Coastal freight corridors: Objective is to strengthen the Western i.e., Kandla to
Kochi and Eastern i.e., Kolkata to Chennai coastal freight corridors through
integrated projects that include last-mile rail and road programmes, transshipment
hubs, proactive marketing and accelerated port development.
 National expressways: Includes constructing expressways of 100 to 300 km
stretches, so as to cater for expected increases in traffic by 2020. While currently 5
to 7 expressways are likely to be built by 2020, ideally, the number of expressways
should be increased to over 20 by 2020. Expressways should include high-traffic
routes such as Nasik-Shirpur and Ghaziabad-Bareilly.
 Last-mile roads: Creating a dedicated last mile programme with over 750 last-mile
links to connect in particular port and railway terminals to production and
distribution centers.
 Last-mile rail: Aim is to ensure last mile rail infrastructure in many of the last 750
mile links. It will include developing track and rail head infrastructure to support 8 to
10 critical coal corridors in mineral rich states such as Jharkhand, Chattisgarh and
Orissa.
 Multi-modal logistics parks: These parks will predominantly focus on demarcating
land for logistics parks at 15 to 20 key points where different modes overlap, near
major cities, or along proposed DFC routes. Designed as concessions, these
should be equipped with the necessary infrastructure to ensure the seamless
movement of freight across modes.
 Roads maintenance: This will involve creating long (e.g. 10 years) annuity-based
maintenance contracts for 400 km to 500 km stretches. The current practice of
issuing contracts for shorter distances of 50 km to 100 km will be done away with.
By extending both the duration of contracts and increasing the road stretches to be
maintained could act as an incentive to providers to achieve scale and invest in
better technology, thereby reducing costs.
Page 53 of 57
 Adoption of electronic tolling: This will standardize technology for nationwide
electronic toll collection (ETC) in future contracts and establishing a nationwide
clearing house with set norms and service standards to facilitate transactions,
thereby reducing waiting time and improving service levels.
 Logistics skills development: Adopting a balanced modal approach will increase
demand for requisite skills. In particular, demand for four types of personnel will
grow i.e. warehouse managers, logistics managers, coastal seafarers and truck
drivers. This in turn will require upgrading the training infrastructure and
collaborating with institutes of technology, engineering colleges, marine training
institutes and driver training institutes to help meet growing demand.
 Enabling access to better equipment and setting common standards: Will involve
acquiring access to better equipment such as larger trucks and higher tare load
railway wagons and developing common standards to aid inter-modal transport that
ensures consistency in containers, pallets and cranes.
(Source: Building India, transforming the nation’s logistics infrastructure by Mckinesy India)
Page 54 of 57
References
S. No. Reference
1 http://www.ieor.iitb.ac.in/files/faculty/narayan/transport/iwt-tec-rep-oct-05.pdf retrieved on 19
Jul 2011.
2 http://www.tcil.com/water.asp retrieved on 19 Jul 2011
3 http://www.scribd.com/doc/58239035/India-Logistic-Paper-Report-Cushman-Wakefield
retrieved on 21 Jul 2011.
4 Internal Waterway Authority of India. http://iwai.gov.in
5 Long term perspective on Inland Waterway Transport in India by Dr S Sriram
6 http://planningcommission.nic.in/reports/genrep/rep_logis.pdf
7 www1.agric.gov.ab.ca/$department/deptdocs.nsf/all/agdex7461
8 www.corbisimages.com/Enlargement/Enlargement.aspx?id=42-4352066&caller= search
9 www.nuworldresearch.com/images/051023%20Payback%20example%20DG%20
10 www.slideshare.net/pxkohli/module-cc
11 www.omafra.gov.on.ca/english/crops/facts/98-021.htm
12 www.transreporter.in/index.php?action=page&id=13&issue=SCM&id1=72
13 http://www.constructionupdate.com/News.aspx?nId=+mVddpTDZP5V1ZNbAIP3AA==&Ne
wsType=Cold-chain:-Finally-warming-up-to-India--India-Sector
14 http://logisticsweek.com/feature/2011/07/fresh-look-at-cold-chain-sector/
15 http://web.worldbank.org/WBSITE/EXTERNAL/TOPICS/EXTTRANSPORT/EXTTLF/0,,cont
entMDK:21514122~menuPK:3875957~pagePK:210058~piPK:210062~theSitePK:515434,0
0.html
16 http://www.nsdcindia.org/pdf/transportation-logistics.pdf
17 http://www.mckinsey.com/locations/india/mckinseyonindia/pdf/Logistics_Infrastructure_by20
20_fullreport.pdf
18 Building India, transforming the nation’s logistics infrastructure by Mckinesy India
19 http://go.worldbank.org/FUE8JM6E40
20 http://web.worldbank.org/WBSITE/EXTERNAL/COUNTRIES/SOUTHASIAEXT/EXTSARRE
GTOPTRANSPORT/0,,contentMDK:20703625~menuPK:868822~pagePK:34004173~piPK:
34003707~theSitePK:579598,00.html
21 http://www.adb.org/Documents/Papers/INRM-PolicyBriefs/inrm14.pdf
22 Bottlenecks in the Growth of Coastal Shipping by S. Sundar and Pragya Jaswal
23 http://www.marinersnetwork.com/index2.php?option=com_content&do_pdf=1&id=81
24 ftp://59.165.244.210/ebrok/Research/Sector/Railways%20Sector-IDBICap.pdf
Page 55 of 57
Appendix ―A‖
(Refers to Para 6.19)
Table 17 : Risk Allocation framework for TCW project
S,No Risk Type Sensitivity Risk
Period
(in years)
Primary
Risk
Bearer
Remarks
1. Financing Risk Medium 0-3 Private
sector
Private player has to
achieve financial
closure in a given time
frame after award of
contract.
May seek viability gap
funding or loan on
lower interest rates
2. Delay in land
purchase
Medium 0-1 Private
sector
Care-full research and
analysis of business
model i.e. store more
quantities of few
products by locating
TCW near produce or
by opting less quantity
of more products by
locating TCW near
market.
3. Design and
layout of TCW
Medium 0-1 Private
sector
If TCW is located near
produce then will have
fewer rooms with more
storage else will have
more rooms with less
storage.
Page 56 of 57
4. Regulatory
approvals for
initiation
Low 0-1 Private
sector
Private sector has to
take various
clearances from
various government
bodies for initiation of
project till completion
of project.
5. Construction
Risk
Medium 0-2 Private
sector
Said risk can be
transferred to EPC
contractor and
mitigated award of
turnkey contract with
penalty clause for
delay in construction
time and stipulating
total cost of project.
6. Technology
Obsolesce
Medium 5-15 Private
Sector
Use of proven state of
art technology.
7. Maintenance of
safety and
health hazard
audit
Medium 0-15 Private
sector
Periodic safety audits.
Hire trained
manpower.
Periodic safety drills.
Periodic inspection by
regulatory bodies
regarding practices
adopted at TCW.
8. Capacity
utilization
High 0-10 Private
sector
Aggressive marketing.
Page 57 of 57
and
Public
Sector
Spreading awareness
among farmers about
advantages.
Attracting farmers by
providing them good
quality seeds and
reasonable price for
produce so as to have
a win – win situation
for both parties.
Use or Pay contract
with public sector for a
fixed volume/ tonnage
of storage.
9. Provision of
uninterrupted
power supply
Medium 0-15 Private
sector
Use of gensets for
short and planned
power outages.
Use of solar power for
power deficit area.
Use of modern
technology.
Use of better quality of
insulation material for
maintaining desired
temperature.
10. Force Majeure High 0-12 Private
Sector
Can be mitigated by
insuring project.

More Related Content

What's hot

Lean & Green Operations MSc Dissertation
Lean & Green Operations MSc DissertationLean & Green Operations MSc Dissertation
Lean & Green Operations MSc DissertationJames O'Toole
 
Kuntz_MastersThesis_2016
Kuntz_MastersThesis_2016Kuntz_MastersThesis_2016
Kuntz_MastersThesis_2016Sarah Kuntz
 
Team Two Unit 04-Final V2
Team Two Unit 04-Final V2Team Two Unit 04-Final V2
Team Two Unit 04-Final V2Keith Mikas
 
Routine Data Quality Assessments in Haryana, India: Rounds 1 & 2 Summary Report
Routine Data Quality Assessments in Haryana, India: Rounds 1 & 2 Summary ReportRoutine Data Quality Assessments in Haryana, India: Rounds 1 & 2 Summary Report
Routine Data Quality Assessments in Haryana, India: Rounds 1 & 2 Summary ReportHFG Project
 
Medha Singh Major Report (2)
Medha Singh Major Report (2)Medha Singh Major Report (2)
Medha Singh Major Report (2)Medha Singh
 
Laura aulia 104117023_laporan kp_teknik sipil up_cv1
Laura aulia 104117023_laporan kp_teknik sipil up_cv1Laura aulia 104117023_laporan kp_teknik sipil up_cv1
Laura aulia 104117023_laporan kp_teknik sipil up_cv1laura aulia
 
EXPERIENCE CONCERNING AVAILABILITY AND RELIABILITY OF DIGITAL SUBSTATION AUTO...
EXPERIENCE CONCERNING AVAILABILITY AND RELIABILITY OF DIGITAL SUBSTATION AUTO...EXPERIENCE CONCERNING AVAILABILITY AND RELIABILITY OF DIGITAL SUBSTATION AUTO...
EXPERIENCE CONCERNING AVAILABILITY AND RELIABILITY OF DIGITAL SUBSTATION AUTO...Power System Operation
 
An Investigation into the Treatment of Amplifications of Moments in Timber Be...
An Investigation into the Treatment of Amplifications of Moments in Timber Be...An Investigation into the Treatment of Amplifications of Moments in Timber Be...
An Investigation into the Treatment of Amplifications of Moments in Timber Be...Harrison Wallen
 
Air Quality Management Framework for India
Air Quality Management Framework for IndiaAir Quality Management Framework for India
Air Quality Management Framework for IndiaRadhika Kapoor Lalit
 
Life cycle assessment (LCA) - from analysing methodology development to intro...
Life cycle assessment (LCA) - from analysing methodology development to intro...Life cycle assessment (LCA) - from analysing methodology development to intro...
Life cycle assessment (LCA) - from analysing methodology development to intro...Janie Ling Chin
 
Corporate debt-restructuring
Corporate debt-restructuringCorporate debt-restructuring
Corporate debt-restructuringDharmik
 
JAVA Manual remaining
JAVA Manual remainingJAVA Manual remaining
JAVA Manual remainingFarwa Ansari
 
High Performance Green Building: What is it worth?
High Performance Green Building: What is it worth?High Performance Green Building: What is it worth?
High Performance Green Building: What is it worth?scottbrooker
 
Processing Region 4A Tasks
Processing Region 4A TasksProcessing Region 4A Tasks
Processing Region 4A TasksJoshua Dougan
 
Singapore Competitiveness Report 2009
Singapore Competitiveness Report 2009Singapore Competitiveness Report 2009
Singapore Competitiveness Report 2009Dinah Saw
 
CONTROL METHODOLOGIES FOR DIRECT VOLTAGE AND POWER FLOW IN A MESHED HVDC GRID
CONTROL METHODOLOGIES FOR DIRECT VOLTAGE AND POWER FLOW IN A MESHED HVDC GRIDCONTROL METHODOLOGIES FOR DIRECT VOLTAGE AND POWER FLOW IN A MESHED HVDC GRID
CONTROL METHODOLOGIES FOR DIRECT VOLTAGE AND POWER FLOW IN A MESHED HVDC GRIDPower System Operation
 
Guide for elaboration of clinical study reports for biological product regist...
Guide for elaboration of clinical study reports for biological product regist...Guide for elaboration of clinical study reports for biological product regist...
Guide for elaboration of clinical study reports for biological product regist...Clapbio
 
Monitoring and Supervision Procedures for Exploration and Development Activit...
Monitoring and Supervision Procedures for Exploration and Development Activit...Monitoring and Supervision Procedures for Exploration and Development Activit...
Monitoring and Supervision Procedures for Exploration and Development Activit...Nicholas Varilone
 
PostgreSQL 14 Beta 1 New Features with Examples (English)
PostgreSQL 14 Beta 1 New Features with Examples (English)PostgreSQL 14 Beta 1 New Features with Examples (English)
PostgreSQL 14 Beta 1 New Features with Examples (English)Noriyoshi Shinoda
 

What's hot (20)

Lean & Green Operations MSc Dissertation
Lean & Green Operations MSc DissertationLean & Green Operations MSc Dissertation
Lean & Green Operations MSc Dissertation
 
Kuntz_MastersThesis_2016
Kuntz_MastersThesis_2016Kuntz_MastersThesis_2016
Kuntz_MastersThesis_2016
 
Leininger_umd_0117N_16271
Leininger_umd_0117N_16271Leininger_umd_0117N_16271
Leininger_umd_0117N_16271
 
Team Two Unit 04-Final V2
Team Two Unit 04-Final V2Team Two Unit 04-Final V2
Team Two Unit 04-Final V2
 
Routine Data Quality Assessments in Haryana, India: Rounds 1 & 2 Summary Report
Routine Data Quality Assessments in Haryana, India: Rounds 1 & 2 Summary ReportRoutine Data Quality Assessments in Haryana, India: Rounds 1 & 2 Summary Report
Routine Data Quality Assessments in Haryana, India: Rounds 1 & 2 Summary Report
 
Medha Singh Major Report (2)
Medha Singh Major Report (2)Medha Singh Major Report (2)
Medha Singh Major Report (2)
 
Laura aulia 104117023_laporan kp_teknik sipil up_cv1
Laura aulia 104117023_laporan kp_teknik sipil up_cv1Laura aulia 104117023_laporan kp_teknik sipil up_cv1
Laura aulia 104117023_laporan kp_teknik sipil up_cv1
 
EXPERIENCE CONCERNING AVAILABILITY AND RELIABILITY OF DIGITAL SUBSTATION AUTO...
EXPERIENCE CONCERNING AVAILABILITY AND RELIABILITY OF DIGITAL SUBSTATION AUTO...EXPERIENCE CONCERNING AVAILABILITY AND RELIABILITY OF DIGITAL SUBSTATION AUTO...
EXPERIENCE CONCERNING AVAILABILITY AND RELIABILITY OF DIGITAL SUBSTATION AUTO...
 
An Investigation into the Treatment of Amplifications of Moments in Timber Be...
An Investigation into the Treatment of Amplifications of Moments in Timber Be...An Investigation into the Treatment of Amplifications of Moments in Timber Be...
An Investigation into the Treatment of Amplifications of Moments in Timber Be...
 
Air Quality Management Framework for India
Air Quality Management Framework for IndiaAir Quality Management Framework for India
Air Quality Management Framework for India
 
Life cycle assessment (LCA) - from analysing methodology development to intro...
Life cycle assessment (LCA) - from analysing methodology development to intro...Life cycle assessment (LCA) - from analysing methodology development to intro...
Life cycle assessment (LCA) - from analysing methodology development to intro...
 
Corporate debt-restructuring
Corporate debt-restructuringCorporate debt-restructuring
Corporate debt-restructuring
 
JAVA Manual remaining
JAVA Manual remainingJAVA Manual remaining
JAVA Manual remaining
 
High Performance Green Building: What is it worth?
High Performance Green Building: What is it worth?High Performance Green Building: What is it worth?
High Performance Green Building: What is it worth?
 
Processing Region 4A Tasks
Processing Region 4A TasksProcessing Region 4A Tasks
Processing Region 4A Tasks
 
Singapore Competitiveness Report 2009
Singapore Competitiveness Report 2009Singapore Competitiveness Report 2009
Singapore Competitiveness Report 2009
 
CONTROL METHODOLOGIES FOR DIRECT VOLTAGE AND POWER FLOW IN A MESHED HVDC GRID
CONTROL METHODOLOGIES FOR DIRECT VOLTAGE AND POWER FLOW IN A MESHED HVDC GRIDCONTROL METHODOLOGIES FOR DIRECT VOLTAGE AND POWER FLOW IN A MESHED HVDC GRID
CONTROL METHODOLOGIES FOR DIRECT VOLTAGE AND POWER FLOW IN A MESHED HVDC GRID
 
Guide for elaboration of clinical study reports for biological product regist...
Guide for elaboration of clinical study reports for biological product regist...Guide for elaboration of clinical study reports for biological product regist...
Guide for elaboration of clinical study reports for biological product regist...
 
Monitoring and Supervision Procedures for Exploration and Development Activit...
Monitoring and Supervision Procedures for Exploration and Development Activit...Monitoring and Supervision Procedures for Exploration and Development Activit...
Monitoring and Supervision Procedures for Exploration and Development Activit...
 
PostgreSQL 14 Beta 1 New Features with Examples (English)
PostgreSQL 14 Beta 1 New Features with Examples (English)PostgreSQL 14 Beta 1 New Features with Examples (English)
PostgreSQL 14 Beta 1 New Features with Examples (English)
 

Viewers also liked

Portfolio Gaston Rojas
Portfolio Gaston RojasPortfolio Gaston Rojas
Portfolio Gaston RojasGaston Rojas
 
Wisp Final Copy
Wisp Final CopyWisp Final Copy
Wisp Final Copys10046017
 
Ip aiim anuj rawat
Ip aiim anuj rawatIp aiim anuj rawat
Ip aiim anuj rawatAnuj Rawat
 
vRescue Presentation
vRescue PresentationvRescue Presentation
vRescue PresentationvRescue
 
海外企业Saa s市场趋势
海外企业Saa s市场趋势海外企业Saa s市场趋势
海外企业Saa s市场趋势Lin Tan
 
Developing Silverlight Applications for Windows Phone 7
Developing Silverlight Applications for Windows Phone 7Developing Silverlight Applications for Windows Phone 7
Developing Silverlight Applications for Windows Phone 7Yuriy Opryshko
 
Discreet Business Proposition
Discreet Business PropositionDiscreet Business Proposition
Discreet Business Propositionabphillips30
 
Go Mobile with Windows Phone
Go Mobile with Windows PhoneGo Mobile with Windows Phone
Go Mobile with Windows PhoneYuriy Opryshko
 
Создавая_настроение. Использование_запахов_в_быту_и_на_работе
Создавая_настроение. Использование_запахов_в_быту_и_на_работеСоздавая_настроение. Использование_запахов_в_быту_и_на_работе
Создавая_настроение. Использование_запахов_в_быту_и_на_работеIT Nose
 
Marty Friedman Scenes
Marty Friedman   ScenesMarty Friedman   Scenes
Marty Friedman ScenesPablo Ortega
 
Alluring Scents
Alluring ScentsAlluring Scents
Alluring ScentsIT Nose
 
云盈四海孵化器管理服务
云盈四海孵化器管理服务云盈四海孵化器管理服务
云盈四海孵化器管理服务Lin Tan
 
Creating mood. Using scents in everyday domestic life and work
Creating mood. Using scents in everyday domestic life and workCreating mood. Using scents in everyday domestic life and work
Creating mood. Using scents in everyday domestic life and workIT Nose
 

Viewers also liked (19)

Portfolio Gaston Rojas
Portfolio Gaston RojasPortfolio Gaston Rojas
Portfolio Gaston Rojas
 
Wisp Final Copy
Wisp Final CopyWisp Final Copy
Wisp Final Copy
 
Ip aiim anuj rawat
Ip aiim anuj rawatIp aiim anuj rawat
Ip aiim anuj rawat
 
vRescue Presentation
vRescue PresentationvRescue Presentation
vRescue Presentation
 
海外企业Saa s市场趋势
海外企业Saa s市场趋势海外企业Saa s市场趋势
海外企业Saa s市场趋势
 
Developing Silverlight Applications for Windows Phone 7
Developing Silverlight Applications for Windows Phone 7Developing Silverlight Applications for Windows Phone 7
Developing Silverlight Applications for Windows Phone 7
 
Vocabulary
VocabularyVocabulary
Vocabulary
 
Vocabulary
VocabularyVocabulary
Vocabulary
 
Discreet Business Proposition
Discreet Business PropositionDiscreet Business Proposition
Discreet Business Proposition
 
T37 Rwanda
T37 RwandaT37 Rwanda
T37 Rwanda
 
Go Mobile with Windows Phone
Go Mobile with Windows PhoneGo Mobile with Windows Phone
Go Mobile with Windows Phone
 
Создавая_настроение. Использование_запахов_в_быту_и_на_работе
Создавая_настроение. Использование_запахов_в_быту_и_на_работеСоздавая_настроение. Использование_запахов_в_быту_и_на_работе
Создавая_настроение. Использование_запахов_в_быту_и_на_работе
 
Sales Trainer Competencies, Skills, And Behaviors
Sales Trainer Competencies, Skills, And BehaviorsSales Trainer Competencies, Skills, And Behaviors
Sales Trainer Competencies, Skills, And Behaviors
 
Marty Friedman Scenes
Marty Friedman   ScenesMarty Friedman   Scenes
Marty Friedman Scenes
 
Alluring Scents
Alluring ScentsAlluring Scents
Alluring Scents
 
Web Recipes
Web RecipesWeb Recipes
Web Recipes
 
云盈四海孵化器管理服务
云盈四海孵化器管理服务云盈四海孵化器管理服务
云盈四海孵化器管理服务
 
Creating mood. Using scents in everyday domestic life and work
Creating mood. Using scents in everyday domestic life and workCreating mood. Using scents in everyday domestic life and work
Creating mood. Using scents in everyday domestic life and work
 
habit 6 synergy
habit 6 synergyhabit 6 synergy
habit 6 synergy
 

Similar to Ip aiim anuj rawat

Guidelines cdbus
Guidelines cdbusGuidelines cdbus
Guidelines cdbusMeg Cereno
 
SSTRM - StrategicReviewGroup.ca - Workshop 2: Power/Energy and Sustainability...
SSTRM - StrategicReviewGroup.ca - Workshop 2: Power/Energy and Sustainability...SSTRM - StrategicReviewGroup.ca - Workshop 2: Power/Energy and Sustainability...
SSTRM - StrategicReviewGroup.ca - Workshop 2: Power/Energy and Sustainability...Phil Carr
 
Distributed vs. centralized energy storage for power system applications
Distributed vs. centralized energy storage for power system applicationsDistributed vs. centralized energy storage for power system applications
Distributed vs. centralized energy storage for power system applicationsAndrew Gelston
 
CC janneker thesis - 14 may 2012 final
CC janneker   thesis - 14 may 2012 finalCC janneker   thesis - 14 may 2012 final
CC janneker thesis - 14 may 2012 finalChantal Janneker
 
Determining Public Perceptions and understanding of the role of Nuclear Techn...
Determining Public Perceptions and understanding of the role of Nuclear Techn...Determining Public Perceptions and understanding of the role of Nuclear Techn...
Determining Public Perceptions and understanding of the role of Nuclear Techn...Chantal Janneker
 
Numerical Analysis of Tuned Liquid Dampers - Kamalendu Ghosh (09CE3112)
Numerical Analysis of Tuned Liquid Dampers - Kamalendu Ghosh (09CE3112)Numerical Analysis of Tuned Liquid Dampers - Kamalendu Ghosh (09CE3112)
Numerical Analysis of Tuned Liquid Dampers - Kamalendu Ghosh (09CE3112)Kamalendu Ghosh
 
Sanitation participant manual with appendices 2011-02-1
Sanitation participant manual with appendices 2011-02-1Sanitation participant manual with appendices 2011-02-1
Sanitation participant manual with appendices 2011-02-1rsd kol abundjani
 
Watershed Development in India An Approach Evolving through Experience_0.pdf
Watershed Development in India An Approach Evolving through Experience_0.pdfWatershed Development in India An Approach Evolving through Experience_0.pdf
Watershed Development in India An Approach Evolving through Experience_0.pdfravi936752
 
Water Treatment Unit Selection, Sizing and Troubleshooting
Water Treatment Unit Selection, Sizing and Troubleshooting Water Treatment Unit Selection, Sizing and Troubleshooting
Water Treatment Unit Selection, Sizing and Troubleshooting Karl Kolmetz
 
Energy Systems Optimization Of A Shopping Mall
Energy Systems Optimization Of A Shopping MallEnergy Systems Optimization Of A Shopping Mall
Energy Systems Optimization Of A Shopping MallAristotelisGiannopoulos
 
GroupD_Low Cost Subsea Processing System for Brownfield Developments
GroupD_Low Cost Subsea Processing System for Brownfield DevelopmentsGroupD_Low Cost Subsea Processing System for Brownfield Developments
GroupD_Low Cost Subsea Processing System for Brownfield DevelopmentsOlawale B. SAMUEL, PMP®
 
Biomass
BiomassBiomass
BiomassLieuqn
 
REGIONAL WOOD ENERGY DEVELOPMENT PROGRAMME IN ASIA
REGIONAL WOOD ENERGY DEVELOPMENT PROGRAMME IN ASIAREGIONAL WOOD ENERGY DEVELOPMENT PROGRAMME IN ASIA
REGIONAL WOOD ENERGY DEVELOPMENT PROGRAMME IN ASIAPT carbon indonesia
 
EXPLORING MODULAR CONSTRUCTION WITH THE USE OF SHIPPING CONTAINERS FOR HOUSI...
 EXPLORING MODULAR CONSTRUCTION WITH THE USE OF SHIPPING CONTAINERS FOR HOUSI... EXPLORING MODULAR CONSTRUCTION WITH THE USE OF SHIPPING CONTAINERS FOR HOUSI...
EXPLORING MODULAR CONSTRUCTION WITH THE USE OF SHIPPING CONTAINERS FOR HOUSI...OLANREWAJU AKINOLA
 

Similar to Ip aiim anuj rawat (20)

Clancy95barriers geetal
Clancy95barriers geetalClancy95barriers geetal
Clancy95barriers geetal
 
fac_alahari001_planczhaov1
fac_alahari001_planczhaov1fac_alahari001_planczhaov1
fac_alahari001_planczhaov1
 
Airah Discussion Paper Energy Modelling Protocol Alignment 300911
Airah Discussion Paper   Energy Modelling Protocol Alignment 300911Airah Discussion Paper   Energy Modelling Protocol Alignment 300911
Airah Discussion Paper Energy Modelling Protocol Alignment 300911
 
ErosionSedimentManual.pdf
ErosionSedimentManual.pdfErosionSedimentManual.pdf
ErosionSedimentManual.pdf
 
Guidelines cdbus
Guidelines cdbusGuidelines cdbus
Guidelines cdbus
 
SSTRM - StrategicReviewGroup.ca - Workshop 2: Power/Energy and Sustainability...
SSTRM - StrategicReviewGroup.ca - Workshop 2: Power/Energy and Sustainability...SSTRM - StrategicReviewGroup.ca - Workshop 2: Power/Energy and Sustainability...
SSTRM - StrategicReviewGroup.ca - Workshop 2: Power/Energy and Sustainability...
 
Distributed vs. centralized energy storage for power system applications
Distributed vs. centralized energy storage for power system applicationsDistributed vs. centralized energy storage for power system applications
Distributed vs. centralized energy storage for power system applications
 
CC janneker thesis - 14 may 2012 final
CC janneker   thesis - 14 may 2012 finalCC janneker   thesis - 14 may 2012 final
CC janneker thesis - 14 may 2012 final
 
Determining Public Perceptions and understanding of the role of Nuclear Techn...
Determining Public Perceptions and understanding of the role of Nuclear Techn...Determining Public Perceptions and understanding of the role of Nuclear Techn...
Determining Public Perceptions and understanding of the role of Nuclear Techn...
 
Numerical Analysis of Tuned Liquid Dampers - Kamalendu Ghosh (09CE3112)
Numerical Analysis of Tuned Liquid Dampers - Kamalendu Ghosh (09CE3112)Numerical Analysis of Tuned Liquid Dampers - Kamalendu Ghosh (09CE3112)
Numerical Analysis of Tuned Liquid Dampers - Kamalendu Ghosh (09CE3112)
 
Sanitation participant manual with appendices 2011-02-1
Sanitation participant manual with appendices 2011-02-1Sanitation participant manual with appendices 2011-02-1
Sanitation participant manual with appendices 2011-02-1
 
Watershed Development in India An Approach Evolving through Experience_0.pdf
Watershed Development in India An Approach Evolving through Experience_0.pdfWatershed Development in India An Approach Evolving through Experience_0.pdf
Watershed Development in India An Approach Evolving through Experience_0.pdf
 
Water Treatment Unit Selection, Sizing and Troubleshooting
Water Treatment Unit Selection, Sizing and Troubleshooting Water Treatment Unit Selection, Sizing and Troubleshooting
Water Treatment Unit Selection, Sizing and Troubleshooting
 
Energy Systems Optimization Of A Shopping Mall
Energy Systems Optimization Of A Shopping MallEnergy Systems Optimization Of A Shopping Mall
Energy Systems Optimization Of A Shopping Mall
 
GroupD_Low Cost Subsea Processing System for Brownfield Developments
GroupD_Low Cost Subsea Processing System for Brownfield DevelopmentsGroupD_Low Cost Subsea Processing System for Brownfield Developments
GroupD_Low Cost Subsea Processing System for Brownfield Developments
 
Biomass
BiomassBiomass
Biomass
 
REGIONAL WOOD ENERGY DEVELOPMENT PROGRAMME IN ASIA
REGIONAL WOOD ENERGY DEVELOPMENT PROGRAMME IN ASIAREGIONAL WOOD ENERGY DEVELOPMENT PROGRAMME IN ASIA
REGIONAL WOOD ENERGY DEVELOPMENT PROGRAMME IN ASIA
 
EXPLORING MODULAR CONSTRUCTION WITH THE USE OF SHIPPING CONTAINERS FOR HOUSI...
 EXPLORING MODULAR CONSTRUCTION WITH THE USE OF SHIPPING CONTAINERS FOR HOUSI... EXPLORING MODULAR CONSTRUCTION WITH THE USE OF SHIPPING CONTAINERS FOR HOUSI...
EXPLORING MODULAR CONSTRUCTION WITH THE USE OF SHIPPING CONTAINERS FOR HOUSI...
 
Report_FAT1_Final
Report_FAT1_FinalReport_FAT1_Final
Report_FAT1_Final
 
CDP FINAL REPORT
CDP FINAL REPORTCDP FINAL REPORT
CDP FINAL REPORT
 

Recently uploaded

Sector 62, Noida Call girls :8448380779 Noida Escorts | 100% verified
Sector 62, Noida Call girls :8448380779 Noida Escorts | 100% verifiedSector 62, Noida Call girls :8448380779 Noida Escorts | 100% verified
Sector 62, Noida Call girls :8448380779 Noida Escorts | 100% verifiedDelhi Call girls
 
No Advance 8868886958 Chandigarh Call Girls , Indian Call Girls For Full Nigh...
No Advance 8868886958 Chandigarh Call Girls , Indian Call Girls For Full Nigh...No Advance 8868886958 Chandigarh Call Girls , Indian Call Girls For Full Nigh...
No Advance 8868886958 Chandigarh Call Girls , Indian Call Girls For Full Nigh...Sheetaleventcompany
 
Presentation on Engagement in Book Clubs
Presentation on Engagement in Book ClubsPresentation on Engagement in Book Clubs
Presentation on Engagement in Book Clubssamaasim06
 
Thirunelveli call girls Tamil escorts 7877702510
Thirunelveli call girls Tamil escorts 7877702510Thirunelveli call girls Tamil escorts 7877702510
Thirunelveli call girls Tamil escorts 7877702510Vipesco
 
SaaStr Workshop Wednesday w/ Lucas Price, Yardstick
SaaStr Workshop Wednesday w/ Lucas Price, YardstickSaaStr Workshop Wednesday w/ Lucas Price, Yardstick
SaaStr Workshop Wednesday w/ Lucas Price, Yardsticksaastr
 
Aesthetic Colaba Mumbai Cst Call girls 📞 7738631006 Grant road Call Girls ❤️-...
Aesthetic Colaba Mumbai Cst Call girls 📞 7738631006 Grant road Call Girls ❤️-...Aesthetic Colaba Mumbai Cst Call girls 📞 7738631006 Grant road Call Girls ❤️-...
Aesthetic Colaba Mumbai Cst Call girls 📞 7738631006 Grant road Call Girls ❤️-...Pooja Nehwal
 
BDSM⚡Call Girls in Sector 93 Noida Escorts >༒8448380779 Escort Service
BDSM⚡Call Girls in Sector 93 Noida Escorts >༒8448380779 Escort ServiceBDSM⚡Call Girls in Sector 93 Noida Escorts >༒8448380779 Escort Service
BDSM⚡Call Girls in Sector 93 Noida Escorts >༒8448380779 Escort ServiceDelhi Call girls
 
Bring back lost lover in USA, Canada ,Uk ,Australia ,London Lost Love Spell C...
Bring back lost lover in USA, Canada ,Uk ,Australia ,London Lost Love Spell C...Bring back lost lover in USA, Canada ,Uk ,Australia ,London Lost Love Spell C...
Bring back lost lover in USA, Canada ,Uk ,Australia ,London Lost Love Spell C...amilabibi1
 
lONG QUESTION ANSWER PAKISTAN STUDIES10.
lONG QUESTION ANSWER PAKISTAN STUDIES10.lONG QUESTION ANSWER PAKISTAN STUDIES10.
lONG QUESTION ANSWER PAKISTAN STUDIES10.lodhisaajjda
 
Introduction to Prompt Engineering (Focusing on ChatGPT)
Introduction to Prompt Engineering (Focusing on ChatGPT)Introduction to Prompt Engineering (Focusing on ChatGPT)
Introduction to Prompt Engineering (Focusing on ChatGPT)Chameera Dedduwage
 
If this Giant Must Walk: A Manifesto for a New Nigeria
If this Giant Must Walk: A Manifesto for a New NigeriaIf this Giant Must Walk: A Manifesto for a New Nigeria
If this Giant Must Walk: A Manifesto for a New NigeriaKayode Fayemi
 
BDSM⚡Call Girls in Sector 97 Noida Escorts >༒8448380779 Escort Service
BDSM⚡Call Girls in Sector 97 Noida Escorts >༒8448380779 Escort ServiceBDSM⚡Call Girls in Sector 97 Noida Escorts >༒8448380779 Escort Service
BDSM⚡Call Girls in Sector 97 Noida Escorts >༒8448380779 Escort ServiceDelhi Call girls
 
Causes of poverty in France presentation.pptx
Causes of poverty in France presentation.pptxCauses of poverty in France presentation.pptx
Causes of poverty in France presentation.pptxCamilleBoulbin1
 
Report Writing Webinar Training
Report Writing Webinar TrainingReport Writing Webinar Training
Report Writing Webinar TrainingKylaCullinane
 
Uncommon Grace The Autobiography of Isaac Folorunso
Uncommon Grace The Autobiography of Isaac FolorunsoUncommon Grace The Autobiography of Isaac Folorunso
Uncommon Grace The Autobiography of Isaac FolorunsoKayode Fayemi
 
My Presentation "In Your Hands" by Halle Bailey
My Presentation "In Your Hands" by Halle BaileyMy Presentation "In Your Hands" by Halle Bailey
My Presentation "In Your Hands" by Halle Baileyhlharris
 
Dreaming Music Video Treatment _ Project & Portfolio III
Dreaming Music Video Treatment _ Project & Portfolio IIIDreaming Music Video Treatment _ Project & Portfolio III
Dreaming Music Video Treatment _ Project & Portfolio IIINhPhngng3
 
Dreaming Marissa Sánchez Music Video Treatment
Dreaming Marissa Sánchez Music Video TreatmentDreaming Marissa Sánchez Music Video Treatment
Dreaming Marissa Sánchez Music Video Treatmentnswingard
 
AWS Data Engineer Associate (DEA-C01) Exam Dumps 2024.pdf
AWS Data Engineer Associate (DEA-C01) Exam Dumps 2024.pdfAWS Data Engineer Associate (DEA-C01) Exam Dumps 2024.pdf
AWS Data Engineer Associate (DEA-C01) Exam Dumps 2024.pdfSkillCertProExams
 

Recently uploaded (20)

Sector 62, Noida Call girls :8448380779 Noida Escorts | 100% verified
Sector 62, Noida Call girls :8448380779 Noida Escorts | 100% verifiedSector 62, Noida Call girls :8448380779 Noida Escorts | 100% verified
Sector 62, Noida Call girls :8448380779 Noida Escorts | 100% verified
 
No Advance 8868886958 Chandigarh Call Girls , Indian Call Girls For Full Nigh...
No Advance 8868886958 Chandigarh Call Girls , Indian Call Girls For Full Nigh...No Advance 8868886958 Chandigarh Call Girls , Indian Call Girls For Full Nigh...
No Advance 8868886958 Chandigarh Call Girls , Indian Call Girls For Full Nigh...
 
Presentation on Engagement in Book Clubs
Presentation on Engagement in Book ClubsPresentation on Engagement in Book Clubs
Presentation on Engagement in Book Clubs
 
Thirunelveli call girls Tamil escorts 7877702510
Thirunelveli call girls Tamil escorts 7877702510Thirunelveli call girls Tamil escorts 7877702510
Thirunelveli call girls Tamil escorts 7877702510
 
SaaStr Workshop Wednesday w/ Lucas Price, Yardstick
SaaStr Workshop Wednesday w/ Lucas Price, YardstickSaaStr Workshop Wednesday w/ Lucas Price, Yardstick
SaaStr Workshop Wednesday w/ Lucas Price, Yardstick
 
Aesthetic Colaba Mumbai Cst Call girls 📞 7738631006 Grant road Call Girls ❤️-...
Aesthetic Colaba Mumbai Cst Call girls 📞 7738631006 Grant road Call Girls ❤️-...Aesthetic Colaba Mumbai Cst Call girls 📞 7738631006 Grant road Call Girls ❤️-...
Aesthetic Colaba Mumbai Cst Call girls 📞 7738631006 Grant road Call Girls ❤️-...
 
BDSM⚡Call Girls in Sector 93 Noida Escorts >༒8448380779 Escort Service
BDSM⚡Call Girls in Sector 93 Noida Escorts >༒8448380779 Escort ServiceBDSM⚡Call Girls in Sector 93 Noida Escorts >༒8448380779 Escort Service
BDSM⚡Call Girls in Sector 93 Noida Escorts >༒8448380779 Escort Service
 
Bring back lost lover in USA, Canada ,Uk ,Australia ,London Lost Love Spell C...
Bring back lost lover in USA, Canada ,Uk ,Australia ,London Lost Love Spell C...Bring back lost lover in USA, Canada ,Uk ,Australia ,London Lost Love Spell C...
Bring back lost lover in USA, Canada ,Uk ,Australia ,London Lost Love Spell C...
 
lONG QUESTION ANSWER PAKISTAN STUDIES10.
lONG QUESTION ANSWER PAKISTAN STUDIES10.lONG QUESTION ANSWER PAKISTAN STUDIES10.
lONG QUESTION ANSWER PAKISTAN STUDIES10.
 
Introduction to Prompt Engineering (Focusing on ChatGPT)
Introduction to Prompt Engineering (Focusing on ChatGPT)Introduction to Prompt Engineering (Focusing on ChatGPT)
Introduction to Prompt Engineering (Focusing on ChatGPT)
 
If this Giant Must Walk: A Manifesto for a New Nigeria
If this Giant Must Walk: A Manifesto for a New NigeriaIf this Giant Must Walk: A Manifesto for a New Nigeria
If this Giant Must Walk: A Manifesto for a New Nigeria
 
BDSM⚡Call Girls in Sector 97 Noida Escorts >༒8448380779 Escort Service
BDSM⚡Call Girls in Sector 97 Noida Escorts >༒8448380779 Escort ServiceBDSM⚡Call Girls in Sector 97 Noida Escorts >༒8448380779 Escort Service
BDSM⚡Call Girls in Sector 97 Noida Escorts >༒8448380779 Escort Service
 
Causes of poverty in France presentation.pptx
Causes of poverty in France presentation.pptxCauses of poverty in France presentation.pptx
Causes of poverty in France presentation.pptx
 
Report Writing Webinar Training
Report Writing Webinar TrainingReport Writing Webinar Training
Report Writing Webinar Training
 
Uncommon Grace The Autobiography of Isaac Folorunso
Uncommon Grace The Autobiography of Isaac FolorunsoUncommon Grace The Autobiography of Isaac Folorunso
Uncommon Grace The Autobiography of Isaac Folorunso
 
My Presentation "In Your Hands" by Halle Bailey
My Presentation "In Your Hands" by Halle BaileyMy Presentation "In Your Hands" by Halle Bailey
My Presentation "In Your Hands" by Halle Bailey
 
ICT role in 21st century education and it's challenges.pdf
ICT role in 21st century education and it's challenges.pdfICT role in 21st century education and it's challenges.pdf
ICT role in 21st century education and it's challenges.pdf
 
Dreaming Music Video Treatment _ Project & Portfolio III
Dreaming Music Video Treatment _ Project & Portfolio IIIDreaming Music Video Treatment _ Project & Portfolio III
Dreaming Music Video Treatment _ Project & Portfolio III
 
Dreaming Marissa Sánchez Music Video Treatment
Dreaming Marissa Sánchez Music Video TreatmentDreaming Marissa Sánchez Music Video Treatment
Dreaming Marissa Sánchez Music Video Treatment
 
AWS Data Engineer Associate (DEA-C01) Exam Dumps 2024.pdf
AWS Data Engineer Associate (DEA-C01) Exam Dumps 2024.pdfAWS Data Engineer Associate (DEA-C01) Exam Dumps 2024.pdf
AWS Data Engineer Associate (DEA-C01) Exam Dumps 2024.pdf
 

Ip aiim anuj rawat

  • 1. Page 1 of 57 Indian Logistics Sector: Operational Impediments & Suggested Measures to Overcome Same with Special Reference to Controlled Atmosphere Storage An Independent Project Report submitted to AIIM In partial fulfillment of the requirements of the Post Graduate Programme in Infrastructure Management Course By: Anuj Rawat Roll No - 03
  • 2. Page 2 of 57 DECLARATION I hereby declare that I have followed the directions given in IP Guidelines document and I confirm that this report is my own personal work and that all material other than my own is properly referenced. Student’s Name: Anuj Rawat (Roll No 03) Student’s Signature: Date: July 24, 2011
  • 3. Page 3 of 57 ACKNOWLEDGEMENT In completing this study, I did my level best correcting my shortcomings to possible extent and I sincerely hope that this report will serve its purpose. I extend my heartiest thanks to all those persons whose willing cooperation led to the timely completion of the project. I express my sincere gratitude to Dr B Gangula and Dr. K. K Sharma, my Project Guides, for sharing their valuable knowledge and immense experience in making this project successful. Their words of advice provided great support, kept me motivated and helped me a great deal to complete project. I am also thankful to Dr (Mrs) P Vyas, Chairperson Program Chair for appreciating our concerns/issues and resolving same on priority. I express my thanks to Dr Bakul Dholakia, Director, Adani Institute of Infrastructure Management, for extending his support for said project.
  • 4. Page 4 of 57 Contents LIST OF FIGURES ..............................................................................................................................6 LIST OF TABLES................................................................................................................................7 ABSTRACT .........................................................................................................................................8 CHAPTER 1: INTRODUCTION ........................................................................................................ 10 CHAPTER 2: ROADS ....................................................................................................................... 16 2.1. GENERAL................................................................................................................................... 16 2.2. IMPROVEMENT IN THE ROAD NETWORK....................................................................................... 16 2.3. SHARE OF TRANSPORTATION LOAD........................................................................................... 16 2.4. FLEET CONFIGURATION ............................................................................................................. 18 2.5. CHALLENGES AND SUGGESTED MITIGATION MEASURES ASSOCIATED WITH ROAD....................... 19 CHAPTER 3: RAILWAYS................................................................................................................. 21 3.1. GENERAL................................................................................................................................... 21 3.2. LOSING MARKET SHARE............................................................................................................ 21 3.3. BUDGETARY REALLOCATIONS ................................................................................................... 22 3.4. CHALLENGES AND SUGGESTED MITIGATION MEASURES ASSOCIATED WITH RAILWAYS ............... 22 CHAPTER 4: WATERWAYS & PORTS........................................................................................... 25 4.1. GENERAL................................................................................................................................... 25 4.2. ADVANTAGES ............................................................................................................................ 25 4.3. INLAND WATER TRANSPORTATION............................................................................................. 25 4.4. INLAND WATERWAYS................................................................................................................. 26 4.5. CONDITIONS FOR A WATERWAY1 ............................................................................................... 27 4.6. ADVANTAGES OF WATERWAYS.................................................................................................. 28 4.7. DISADVANTAGES OF INLAND WATER TRANSPORT SYSTEMS ...................................................... 29 4.8. COASTAL SHIPPING ................................................................................................................... 29 4.9. REASONS FOR LESS TRAFFIC .................................................................................................... 29
  • 5. Page 5 of 57 4.10. CHALLENGES AND SUGGESTED MITIGATION MEASURES ASSOCIATED WITH IWT, COSTAL SHIPPING AND PORTS.......................................................................................................................... 30 CHAPTER 5: WAREHOUSING ........................................................................................................ 33 5.1. GENERAL................................................................................................................................... 33 5.2. COST STRUCTURE..................................................................................................................... 34 5.3. SERVICES PROVIDED BY WAREHOUSES ..................................................................................... 35 5.4. GOVERNMENT POLICY ON LOGISTICS PARKS AND FREE TRADE WAREHOUSE ZONES(FTWZ). .. 35 5.5. ISSUES RELATED WITH POOR GROWTH OF WAREHOUSING.......................................................... 36 CHAPTER 6: COLD CHAIN ............................................................................................................. 38 6.1. INTRODUCTION........................................................................................................................... 38 6.2. 2ND GREEN REVOLUTION .......................................................................................................... 38 6.3. INTEGRATED COLD CHAIN CONCEPT ......................................................................................... 39 6.4. DIFFERENCE BETWEEN COLD STORAGE AND TEMPERATURE CONTROLLED WAREHOUSE(TCW 39 6.5. CHILL/FREEZING INJURIES......................................................................................................... 39 6.6. PROCESS................................................................................................................................... 40 6.7. PRE-COOLING ........................................................................................................................... 40 6.8. BENEFITS.................................................................................................................................. 41 6.9. MARKET ANALYSIS.................................................................................................................... 42 6.10. DEMAND AND SUPPLY GAP...................................................................................................... 42 6.11. MARKET SIZE.......................................................................................................................... 43 6.12. COST STRUCTURE. .................................................................................................................. 43 6.13. LOCATION OF TCWS ............................................................................................................... 46 6.14. ISSUES RELATED WITH POOR GROWTH OF WAREHOUSING........................................................ 46 6.15. HINDRANCES IN COMMERCIALIZATION OF TCWS ..................................................................... 47 6.17. STEPS TAKEN BY GOVERNMENT OF INDIA TO PROMOTE TCWS ................................................ 47 6.18. REGULATORY FRAMEWORK ..................................................................................................... 48 6.19. RISK ANALYSIS: ...................................................................................................................... 49 6.20. OWNERSHIP OF COLD CHAIN. .................................................................................................. 49 CHAPTER 7: CONCLUSION............................................................................................................ 51 REFERENCES .................................................................................................................................. 54
  • 6. Page 6 of 57 List of Figures Figure 1: Heads of Logistics.............................................................................................. 10 Figure 2: Spectrum of Logistics......................................................................................... 11 Figure 3: Proposed Expenditiure on Roads for balanced modal mix................................. 17 Figure 4: Truck Ownership in India ................................................................................... 18 Figure 5: Rail spend up to 2020 ........................................................................................ 22 Figure 6 : Inland Waterways of India................................................................................. 27 Figure 7: GST Driven Warehousing reorganization........................................................... 37 Figure 8 : A typical ambient supply chain for fruits and vegetables................................... 38 Figure 9 : Flow Chart of Integrated Cold Chain ................................................................. 39 Figure 10 : Product flow in a Cold Chain........................................................................... 40 Figure 11 : Market Size - Cold Chain ................................................................................ 43 Figure 12: Capital cost break-up TCW .............................................................................. 44 Figure 13 : Typical US Cooperative Cold Chain................................................................ 49 Figure 14: Proposed shift in Inter Modal Transport ........................................................... 51
  • 7. Page 7 of 57 List of Tables Table 1: Country wise Logistics cost as percent of GDP................................................... 12 Table 2: Elements of Logistics costs ................................................................................. 13 Table 3: Comparison of Logistics Performance Index of Comparative Countries ............. 14 Table 4 :Comparison of Key parameters of Logistics, India vs. Global ............................. 15 Table 5: Challenges and Suggested Mitigation measures associated Roads................... 19 Table 6: Indian Railways losing freight market share ........................................................ 21 Table 7: Challenges and Suggested Mitigation measures associated with Railways........ 22 Table 8 : Challenges and Suggested Mitigation measures associated with IWT, Costal Shipping and Ports............................................................................................................ 30 Table 9: Details of types of Warehouses........................................................................... 33 Table 10 : Break Up of Capital cost of Warehouses.......................................................... 34 Table 11 : Break Up of Operating Cost of Warehouse ...................................................... 35 Table 12: Salient aspects of Logistics Parks and FTWZs ................................................. 35 Table 13 : Challenges and Suggested Mitigation measures associated with Warehousing .......................................................................................................................................... 36 Table 14 : Post Harvest Life Comparison of Some Common Use Items........................... 41 Table 15: Demand Supply of TCW storage....................................................................... 42 Table 16 : Challenges and Suggested Mitigation measures associated with Setting Up of Cold Chain ........................................................................................................................ 46 Table 17 : Risk Allocation framework for TCW project ...................................................... 55
  • 8. Page 8 of 57 Abstract Transportation is an essential and major sub head of logistics. In fact it is back bone of entire logistics and supply chain business. A sound transportation system will result in right product in right quantity, in right condition, at right place, in right time at right price to right customer. Despite being the second largest food producer, quite a few people in India do not get two square meals. Main reason behind this is 25-40% of produce gets wasted due to lack of proper handling after harvest and storage. In order to avoid said wastage food grain and agricultural produce is stored in Controlled Atmosphere Storage (CAS)/ Temperature Controlled Warehouses (TCWs), where in spoilage due to aging of produce is arrested. Thus it is essential to know various challenges associated with various components of logistics and CAS/TCW, so that necessary steps can be taken to address them. So in order to find out various issues extensive research and interactions with some industry players was carried out and answers to following questions are addressed in this report:-.  Why logistics costs are more in India Vis a Vis other global competitors? Suggest measures to reduce them.  What are the various challenges faced by Indian Logistics industry in various sectors and how can they be mitigated?  Controlled atmosphere storage facility should be located near the production center or consumption center. Comment  What are the various hindrances in development and commercialization of controlled atmosphere storage?  What are the various measures Government has taken to promote to usage controlled atmosphere storage?
  • 9. Page 9 of 57  How various PPP models can be incorporated in establishing controlled atmosphere storage?
  • 10. Page 10 of 57 Chapter 1: Introduction 1.1. Before we start it is imperative that we should know what we mean by logistics. As per Wikipedia and Oxford dictionary meaning of Logistics are given below:- (a). The word logistics has its origin in the French verb loger to lodge or to quarter. Its original use was to describe the science of movement, supplying & maintenance of military forces in the field. Later on it was used to describe the management of materials flow through an organization, from raw materials through to finished goods. (b). Logistics is considered to have originated in the military's need to supply themselves with arms, ammunition and rations as they moved from their base to a forward position. In ancient Greek, Roman and Byzantine empires, military officers with the title Logistikas were responsible for financial and supply distribution matters. (c). Oxford English Dictionary defines logistics as "the branch of military science relating to procuring, maintaining and transporting materiel, personnel and facilities." Another dictionary definition is "the time-related positioning of resources." (d). Logistics management deals with application of management principles to logistics operations for efficient and cost effective movement of goods and personnel. Figure 1: Heads of Logistics (Source: National Skill Development Corporation, Transportation, Logistics, Warehousing, Packaging Sector 2022-A Report). Logistics Transportation Warehousing Value added service
  • 11. Page 11 of 57 Figure 2: Spectrum of Logistics (Source: Transportation in India vol 1 by KPMG) 1.2. Economic development of any country requires efficient logistics / supply chain management. Logistics infrastructure includes all means of modern transport of a country. Studies of various analysts and organizations have forecasted due to fast pace of economic growth soon India will emerge as a manufacturing hub. Due to which freight traffic will increase by 100%.
  • 12. Page 12 of 57 1.3. The annual logistics cost in India is estimated to be 14% of GDP, while same is only 8% in US. Logistics costs is a huge cost to any industry and generally second to material used in manufacturing. Generally logistics expenditures are to the tune of 5-35% of sales, depending upon terrain, weight, ratio and type of business. Thus by having an efficient logistics our country can save to the tune of US $ 50 billion per annum. Thus inefficient logistics not only retard economic growth but also at times leads to discontented customer. Table 1: Country wise Logistics cost as percent of GDP S.No Country Logistics Cost as percent of GDP 1. China 14.5 2. India 14.0 3. Singapore 12.5 4. United Kingdom 12.2 5. France 11.7 6. Japan 10.5 7. United states 8.7 (Source: IMD (2003)) 1.4. Typically Logistics Costs will include transportation costs, inventory carrying costs (including inventories, handling, warehousing and transportation) and administrative costs. 1.5. Impediments to Indian logistics industry are not only limited to poor physical infrastructure but also includes poor communication, low penetration of Information technology there by hampering flow of information, interstate taxation, carriage of less than truck load and more than full truck load, illiteracy of truck drivers, financial exploitation by fleet operators, monopoly of Indian Railways in freight carriage by rail , lack of
  • 13. Page 13 of 57 dedicated rail freight corridor, low mechanization of ports, poor IT skills of managers also affects logistics industry adversely. Thus it is very relevant to single out these impediments and necessary actions to be undertaken at the earliest to resolve them so as avoid any hindrance in economic growth of nation. 1.6. Presently India’s competitive advantage of low cost manufacturing is greatly eroded due to high logistics costs in general and transportation cost in particular. Due to poor transportation infrastructure and cumbersome documentation, delays are caused there by resulting in holding more inventories which leads to holding more inventory thus increasing inventory cost and warehousing cost etc. Thus in order to reduce logistics cost, our focus should be improved physical infrastructure and policies and rest of things will automatically fall in place. Table 2: Elements of Logistics costs S.No Head Percent Contribution 1. Transportation 40 2. Warehousing , Packaging and losses 26 3. Inventory 24 4. Order processing 10 (Source: Sanyal (2006a)) 1.7. In fact World Bank has derived an Logistics Performance Index, (LPI) is an interactive benchmarking tool to help countries identify the challenges and opportunities they face in their performance on trade logistics and what they can do to improve their performance. Various parameters measured in LPI are given below:- (a) Efficiency of the customs clearance process. (b). Quality of trade and transport related infrastructure. (c). Ease of arranging competitively priced shipments.
  • 14. Page 14 of 57 (d). Competence and quality of logistics servicies. (e). Ability to track and trace consignments. (f). Frequency with which shipments reach the consignee within scheduled time. 1.8. If we compare our country LPI with of other comparative countries whose size/ economy is also developing like our country, we see that only in international shipments and customs we are better off than Brazil and slightly ahead of South Africa in timeliness and in rest of the parameters we are lagging behind. Table 3: Comparison of Logistics Performance Index of Comparative Countries (Source: World Bank)
  • 15. Page 15 of 57 1.9. Comparison of some key parameters pertaining to Indian logistics setup with global averages is given below:- Table 4 :Comparison of Key parameters of Logistics, India vs. Global (Source: Transportation in India vol 1 by KPMG) 1.10. In order to study challenges faced by Indian Logistics, we shall be discussing them under following heads:- (a). Roads (b). Railways. (c). Waterways and Ports.
  • 16. Page 16 of 57 Chapter 2: ROADS 2.1. General India has one of the largest road networks in world, aggregating to present consisting of 200 km of Expressways, 66,754 km of National Highways, 128,000 km of State Highways, 470,000 km of Major District Roads, and about 2,650,000 km of other district and rural roads. National Highways account for only about 2 per cent of the total road length of the country, but carry about 40 per cent of the total traffic across the length and breadth of the country. Out of the total length of National Highways, about 35 per cent is of single lane/ intermediate lane width, about 53 per cent is 2-lane standard, and about 12 per cent is 4-lane standard or more. 2.2. Improvement in the road network : Through the twin objectives of accessibility and mobility has been accorded high priority in developmental planning. The accessibility objective is to be achieved through improved rural roads network through the Pradhan Mantra Gram Sadak Yojana (PMGSY), which aims at connecting every village with all- weather roads. The mobility is to be facilitated through improvement in capacity and strengthening high-density corridors. Considering the importance of the National Highways and the rapid increase in traffic, the Government has taken up the National Highways Development Project (NHDP). The first initiative in this regard was the 4/6 laning of the Golden Quadrilateral followed by the North South – East West (NS–EW) corridor. Further, keeping in view the need for nationwide connectivity, the Committee on Infrastructure, under the chair of the Prime Minister, has approved the a seven phase programme for highway development, with the investment of INR 236,247 crore. 2.3. Share of Transportation Load: Roads are the dominant mode of transportation in India today. They carry almost 90 percent of the country’s passenger traffic and 56 percent of its freight due to lower cost, flexibility and last mile connectivity. The density of India’s highway network -- at 0.66 km of highway per square kilometer of land – is similar to that of the United States (0.65) and much greater than China's (0.16) or Brazil's (0.20). However, most highways in India are narrow and congested with poor surface quality, and 40 percent of India’s villages do not have access to all-weather roads. In order to improve
  • 17. Page 17 of 57 road network and make it congestion free reallocation of budgetary allocations should be carried out. Figure 3: Proposed Expenditiure on Roads for balanced modal mix (Source: Building India, transforming the nation’s logistics infrastructure by Mckinesy India)
  • 18. Page 18 of 57 2.4. Fleet Configuration. Road transport is fragmented and most of the truck operators are having a small fleet of 4-5 trucks. Small fleet operators carry large proportion of national freight and almost most of the regional freight. Drivers of small fleet operators are generally uneducated and paid low wages to use old and vintage equipment so as to capture business with low quotes and hardly any effort is made to provide any value added service. Figure 4: Truck Ownership in India (Source: Transportation in India vol 2 by KPMG)
  • 19. Page 19 of 57 2.5. Challenges and suggested mitigation measures associated with road: Same have been tabulated below:- Table 5: Challenges and Suggested Mitigation measures associated Roads S.No Challenges Suggested Mitigation Measures 1. Poor and inadequate road infrastructure. Stricter norms by Indian Road congress. Adopt PPP mode and involve participation of private players in improvement of infrastructure. 2. Roads passing through congested areas. Construction of bypasses well outside the city limits. 3. Damage to roads by overloading of trucks. Model Concession Agreement to be amended to include provision of weighbridges at all toll collection points. Surprise check of trucks to be carried out and data captured should be electronically transferred to a central location. Strict compliance of Supreme Court of India directions and detain trucks at toll booths so as to avoid damaging of roads. 4. Interstate taxation and multiple check posts. Implementation of GST. 5. Different interpretation of laws. Intervention of Supreme Court of India 6. Delay at toll collection points. Electronic toll collection with daily clearing system and electronic transfer of revenue share to escrow account. 7. Old trucks with Vintage technology. Use of latest and modern multi axle trucks with aerodynamic body, better fuel efficiency and more load carrying capacity.
  • 20. Page 20 of 57 Lower per ton toll rates for modern trucks. Tax benefit for use of modern trucks. Phasing out of trucks older than 15 years. 8. Driver fatigue due to poor design of vehicles. Use of modern trucks with ergonomic design for better crew comfort. Creation of way side amenities for rest of drivers. 9. Unfair competition. Due to fragmented industry, smaller player get away with paying less taxes and avoid regulatory norms. Organized players should showcase value added service like prompt delivery, safety and insurance cover of goods. 10. Multiple check posts and harassment by government officials. Educated drivers. 11. Different rates of taxation among states. Taxation rules pertaining to all states should be same. 12. Delay caused at state borders for checking of documents. Networking of all check posts and RTOs. Driver to file scanned copy of documents at starting station. Revenue to be shared by use of smartcards. Also help in identifying trucks with bogus registration numbers.
  • 21. Page 21 of 57 Chapter 3: RAILWAYS 3.1. General. Indian Railways (IR) is the principal mode of transportation for bulk freight and long distance passenger traffic. It is the world’s second largest rail network under a single management, and has been contributing to the industrial and economic landscape of the country and is one of the world’s largest employers. Of the main two segments— freight and passenger—of IR, It carries some 17 million passengers and 2 million tonnes of freight a day in year. Freight segment accounts for roughly two-thirds of revenue. Within the freight segment, bulk traffic accounts for nearly 95 per cent, of which coal is about 45 per cent. At the end of 2008–09, the IR network was spread over 63,630 route kilometres (rkms), comprising 52,002 rkm of broad gauge and 11,628 rkm of metre gauge. Around 36 per cent of this network is electrified. IR loaded 833 million tons of revenue generating payload and generated 538 billion net tonnes kilometre (BTKM). 3.2. Losing Market Share: Over a period of time railways are losing quite a considerable amount of freight share to road network. Same is evident from table given below:- Table 6: Indian Railways losing freight market share
  • 22. Page 22 of 57 3.3. Budgetary Reallocations: In order to regain its earlier market share railways will have to carry out a introspection and reallocate budgetary allocations. Same has been amplified in the figure given below:- Figure 5: Rail spend up to 2020 (Source: Building India, transforming the nation’s logistics infrastructure by Mckinesy India) 3.4. Challenges and suggested mitigation measures associated with railways: Same have been tabulated below:- Table 7: Challenges and Suggested Mitigation measures associated with Railways S.No Challenges Suggested Mitigation Measures 1. Carriage of Less payload i.e. in tune of 20.3-22.9 tons/axle in goods wagons. Revisit payload guidelines and make it to 30 ton/axle for goods wagon. 2. Non availability of funds to replace poor and old railway tracks and sleepers. Optimal loading of wagons. Invest in better wagons with more carriage capacity. Utilize additional revenue generated for
  • 23. Page 23 of 57 improvement/ replacement of infrastructure. 3 Poor design of wagons. Wagons to have heavy base to bear load and sidewalls of light and composite material so as to reduce tare weight, increase payload with same gross weight. 4. Movement of empty wagons. Revisit tariff structure and share revenue when importers are exporters also. Discount to users on return haulage, so as to recover cost of running and not to earn profits. 4. Delay in loading/unloading of wagons. Use of precision calibrated mechanical handling equipment to load wagons. Use of wider access by fixing sliding doors to have more number of persons for manual loading. 5. Optimum loading of wagons carrying processed food/ delicate items. Modification of covered wagons such that they should have provision to place a horizontal sheet for carrying additional load. 6. Poor access to railway stations. Shift/ construct dedicated freight handling stations on the outskirts of town for speedy and timely movement of cargo. 7. Less freight volume. Run goods train as per a fixed schedule. Invite private players to run dedicated sidings and provide value added door to door service and share revenue. 8. Design of infrastructure. New infrastructure should be created with a futuristic vision. Like instead of double
  • 24. Page 24 of 57 stacking of containers it should cater to triple stacking and also Over Dimension Consignment. 9. Overburdened corridor resulting in low priority and slow movement of goods train. Timely and early completion of dedicated freight corridors. 10. Timely completion of projects. Award of contracts to private players with penalty clause for delay. 11. Sudden fare revision jeopardizes long term contracts. Fare revision should be related either with Whole Sale Price Index / Energy charges. Should be revised every 10% change either way. 12. Shortage of Wagons Bulk users to own private wagons and freight charges to be adjusted accordingly. Will reduce wagon maintaince load of wagons to a large extent. 13. Shortage of funds for track up gradation. Use budgetary allocation for mechanizing loading/unloading sites. Increase speed of trains. Faster turnaround will result in more trips generation. Additional revenue generated can be used for track up gradation in phased manner.
  • 25. Page 25 of 57 Chapter 4: WATERWAYS & PORTS 4.1. General. Historically most of the civilizations came up next to water bodies due to availability of water for daily usage and agricultural purpose. Thereafter initially major industries also came on banks of a water bodies as it not only provided water for industry but also for movement of raw materials and semi finished/ finished goods. Transport over waterways is especially effective when the source and/or destination are waterfront locations and connected. It is one of the most effective and cheapest means of transport as operating costs of fuel and environmental pollution is lowest than for corresponding volumes of movement by road, rail or air. For domestic freight water transport can be divided two categories i.e. Inland waterways which includes rivers, canals and lakes and Coastal shipping. 4.2. Advantages: Major advantage of waterway is the main infrastructure is often naturally available, which only has to be modified i.e. by creating adequate depth, maintained and upgraded by creating suitable infrastructure on coasts. The viability of goods movement using waterways can be analyzed from following perspectives:- (a) Technological. (b). Physical viability. (c). Commercial potential. 4.3. Inland Water Transportation: Inland water transport includes natural modes as navigable rivers and artificial modes such as canals. The Inland waterways have played an important role in the Indian transport system since ancient times as mentioned earlier. However, in recent times the importance of this mode of transport has declined considerably with the expansion of road and rail transport. In addition, diversion of river water for irrigation has also reduced the importance of inland water transport. The decline is also due to deforestation of hill ranges leading to erosion, accumulation of silt in rivers and failure to modernize the fleet to suit local conditions. Development of inland water transport commenced from the Second Five Year Plan and up to the end of Fifth five year plan the total expenditure on this sector was Rs. 34 crore. It
  • 26. Page 26 of 57 was only in the Sixth Five year plan that this sector was given priority and specific schemes of inter-State and national importance for development of inland water transport were taken up. The Seventh Plan was an important landmark in the development of inland water transport. The expenditure on this sector in the Plan (at Rs. 131.85 crore) was more than the expenditure incurred right up to the end of the Sixth Plan. Inland Waterway Authority of India (IWAI) was set up on October 27th 1986, for development and regulation of inland waterways for shipping and navigation which is a big step forward and should help in the accelerated development of inland water transport. In 2007-08 inland waterways were used to carry a freight of 55.82 million tons which was just 0.34% of 14500 million tons of total Indian freight. Actions are being carried out to increase this percentage to 2% by 2025. 4.4. Inland Waterways: Five Inland waterways have been declared. All these waterways are governed by IWAI. Brief about them is given below:-  National Waterway No 1: Ganga – Hooghly River Water System – 1620 KM. From Haldia, (West Bengal) to Allahabad (Uttar Pradesh) passing through Uttar Pradesh, Bihar and West Bengal.  National Waterway No 2: Bramaputra River - 891 KM. From Sadia to Dhubri in Assam.  National Waterway No.3: West Coast Canal Including Champakkara & Udyogamandal Canals - 205 Km. From Kollam to Kottapuram in Kerala.  National Waterway No.4: Integrated Canal System from Kakinada Port to Pondicherry including Godavari & Krishna Rivers - 1095 Km in Andhra Pradesh Tamilnadu and Pondicherry.  National Waterway No.5: East Coast Canal Integrated with Brahmani & Mahanadi Delta River System - 623 Km in West Bengal & Orissa.
  • 27. Page 27 of 57 Figure 6 : Inland Waterways of India ( Source: IWAI website) 4.5. Conditions for a Waterway1. A water body can be declared a Waterway provided it meets following criteria:-  It should possess capability of navigation by mechanically propelled vessels of minimum 300 tonnes (DWT) capacity (45m x 8m x 1.2m), and  It should have a fairway of minimum 40m wide channel with 1.4m depth in case of rivers and minimum 30 m wide channel with 1.8 m depth in case of canals. (Exception may be given in case of irrigation-cum-navigation canals based on request of the concerned State Govt in order to safeguard the interest of irrigation).  It should be continuous stretch of minimum 50 kms; the only exception to be made to waterway length is for urban conglomerations and intra-port traffic, and pass 1: IAWI Website
  • 28. Page 28 of 57 through and serve the interest of more than one states, or connect a vast and prosperous hinterland and major port, or either pass through or connect a strategic region where development of navigation is considered necessary to provide logistic support for economic development or national security, or connect place not served by any other mode of transport. 4.6. Advantages of Waterways: Waterways provide enormous advantages as a mode of transport compared to land and air modes of transports. Some of them are given below:  Low Capital Cost. Requires only 5-10% of cost of developing an equivalent four lane expressway.  Low Maintenance Cost. Maintenance cost is only 20% of equivalent roadway.  Fuel Efficient. Due to fuel efficiency cost of transportation goes down. It is estimated that 1 liter of fuel can move 105 ton-km by inland water transport. Whereas the same amount of fuel can move only 85 ton-km by rail and 24 ton-km by road.  Convenient For Bulk and Over Dimension Cargo.  Easy integration with sea transport - Inland water transport can easily integrated with Sea transport and hence it reduces the extra cost required for land-sea or air- sea transport interface infrastructure development. It also reduces the time taken to transfer the goods to and from sea transport vessels.  Environment Friendly. The biggest advantage of IWT is that its pollution less, less effect on the environment & more on the economy and most importantly no Land acquisition is required.
  • 29. Page 29 of 57 4.7. Disadvantages of Inland Water Transport systems  Low availability of inland waterways - Out of the total inland water body available in the world, very low percentage of it is potentially navigable.  Low speed - Water transport is much slower than its competitors (Source: IWAI website) 4.8. Coastal Shipping. India has a long coastline of 7,516 kms, a number of ports (12 major and 200 minor working ports) and a vast hinterland. Therefore coastal shipping holds a great promise more so because it is the most energy efficient and cheapest mode of transport for carriage of bulky goods like iron and steel, iron ore, coal, timber, etc. over long distances. Despite this only 7% of domestic cargo moved by coastal shipping. 4.9. Reasons for Less traffic. The main factors affecting the growth of coastal shipping adversely are given below:-  High transportation costs. Due to multiple handling of cargo overall transportation cost becomes high.  Poor turnaround time due to port delays, over aged vessels and lack of mechanical handling facilities. It is estimated that at present 70 per cent of ship time is spent at ports and only 30 per cent on voyage.  Imbalance in coastal traffic movement, results in non availability of adequate traffic for both legs of journey there by at times ships have to travel with ballast, on return journey. (Source: www.adb.org/Documents/Papers/INRM-PolicyBriefs/inrm14.pdf)
  • 30. Page 30 of 57 4.10. Challenges and suggested mitigation measures associated with IWT, Costal Shipping and Ports: Same have been tabulated below:- Table 8 : Challenges and Suggested Mitigation measures associated with IWT, Costal Shipping and Ports S.No Challenges Suggested Mitigation Measures 1. Insufficient depth/draft, excessive siltation, frequent shifting of channel. Periodic and regular dredging and create draft up to 2.5 / 3 meters in water channels and at least 17 meters at port . Use of low draft barges. 2. Low speed. Use of modern equipment. 3. Non availability of cargo/ return cargo Tax benefits/holidays for setting up of industry on banks of national waterways. 4. Inefficient handling of goods due to lack of infrastructure. Concessions for creation of infrastructure at selected places under a laid down policy. 5. Disposal of dredged material Use it as embankment for channelizing and increasing depth of channel. 6. Non availability of high technology vessels. Wavier in custom and excise duty for off the shelf purchase. Subsidy/ Viability gap funding for building high technology vessels/barges. 7. Non availability of night navigation aids Budgetary allocation for off the shelf procurement. PPP mode. Private party installs said infrastructure and charges user (BOT Concession)/ Government pays annuity to private party (BOT Annuity). 8. Shore protection work Budgetary allocation for execution of civil work and tree plantation at crucial places.
  • 31. Page 31 of 57 9. High tariffs particularly at ports. Priority berthing rights at earmarked berths with discount on port dues. 10. Lack of talent due to income tax laws. Amend income tax laws to provide same benefits to people employed in vessels engaged in coastal shipping. 11. High cost of bunker fuel Same treatment to be meted out to all vessels whether employed in coastal shipping and inland waterways. 12. Poor infrastructure at ports Upgrade mechanical handling equipment at ports. Discard vintage and inefficient equipment as scrap. Incentivize port labor for achieving certain levels. 13. Poor efficiency at ports Use of modern/ state of art mechanical handling equipment. Procure adequate no of mechanical handling equipment. Participation of private players in creation and up gradation of port infrastructure. 14. Shortage of space for expansion Participatory approach. Persons whose land has been acquired may be allocated a share of profits for duration of concession. 15. Capital intensive Grant of Infrastructure status like roads so as to enjoy tax benefits and borrowing at low cost. 16. Cabotage Law Revisit provisions of Cabotage law and open coastal shipping for foreign players to have more competition.
  • 32. Page 32 of 57 Policy can be revised at a later stage. 17. Poor hinterland connectivity for speedy evacuation of cargo. Connect all ports with broad gauge railway station and national highways. Amend guidelines and all ports having traffic of laid down limits to have railway siding in a stipulated timeframe. 18. High port dues. Faster turnaround of ships will result in more number of ships being turnaround in same time, thereby reducing charges levied on ships. 19. Multiple regulator Policies should be formulated after due consultation with affected ministries and various industries federations like CII and FICCI.
  • 33. Page 33 of 57 Chapter 5: Warehousing 5.1. General. Typically warehousing in India can be divided into two categories, firstly Government and secondly private. Government warehousing basically dealt with storage of food grains in warehouses of Food Corporation of India (FCI) and Central Warehousing Corporation (CWC). On other hand private warehouses/godowns has been dominated by small players with small capacities and poor material handling, stacking and monitoring technologies. In fact quite private warehouse/godowns used to be a medium size room with goods kept all over in an unorganized manner. Generally these warehouses were used by transporters to store goods pending collection from consignee or aggregate goods prior to dispatch a full truck load to a particular destination or by a wholesaler using it for stocking for further distribution. Relevant aspects of different types of Warehouses are given below:- Table 9: Details of types of Warehouses S.No Type of Warehouse Details 1. Private Owned & operated by private entities and individuals. Licensed for exclusive use of goods owned, imported by or on behalf of licensee only. 2. Public Licensed by government to private entities, individuals or cooperative society. Permitted to offer storage facilities to general public or other entities for a fee. Typically located near transportation points and critical in marketing of agricultural products. 3. Bonded Licensed to accept import goods for storage until payment of customs duty. Warehouses give a "Bond" that goods will not be removed without prior consent from customs authorities.
  • 34. Page 34 of 57 Primarily located near ports. Operated by government. Used primarily by importers & exporters. (Source: Research on India Warehouse 2009) As warehouse is one of the vital components of logistics management. It is pertinent to mention here that warehousing cost accounts for about 25-27 per cent of the total logistics cost thus warehousing has become an important focus point. With growth in export import trade, arrival of organized players and government policies like Logistics Hubs and rolling out of Goods and Service Tax (GST) sector is going to witness significant growth. 5.2. Cost structure: Cost break up of various components of warehouse are given below:- (a). Capital Cost. A warehouse with a capacity of 0.15 million sq feet will require a capital outlay of INR 140-150 million. Table 10 : Break Up of Capital cost of Warehouses S.No Head Percentage of Total Cost Remarks 1. Land 14 Vary as per location. Minimum area of 3-5 acres 2. Civil Work 77 Min eco size is 0.12-0.15 million sq ft. 3. Plant & equipment 6 Fork lift, weighing machine, firefighting equipment, racks and pellets etc. 4. Land development 2 5. Misc assets 1 6. Gestation Period - 1-2 years (Source: CRISIL Research, Warehousing 2009)
  • 35. Page 35 of 57 (b). Operating Cost. Table 11 : Break Up of Operating Cost of Warehouse S.No Head Percentage of Total Cost 1. Rentals and Capital Charges 52 2. Labor 26 3. Repairs & Maintenance 10 4. Electricity 8 5. Pallet charges 4 (Source: CRISIL Research, Warehousing 2009) 5.3. Services provided by Warehouses. In fact now warehouses are not only used for storing goods but also value added services like packaging, distribution , transportation, tracking and reverse logistics etc. In fact FCI has outsourced its warehousing and distribution functions to Adani Agro Logistics Limited (AALL) for 20 years in certain locations. AALL will not store food grain in specially designed silos at designated locations but also ferry it to distribution centers located in other parts of India in specially designed wagons under ― USE OR PAY ― contract. 5.4. Government policy on Logistics Parks and Free Trade Warehouse Zones(FTWZ). In order to boost warehousing development, government has invited private sector to build Logistics Parks and FTZW. Salient aspect of Logistics Park and FTWZ are given below. Industry is likely to grow by a rate of CAGR of 9% till 2013-14 and may see an overall investment of up to INR 300 Billion. (Source: CRISIL Research, Warehouse 2009) Table 12: Salient aspects of Logistics Parks and FTWZs S.No Parameter Logistics Park FTWZ 1. Description Includes warehouses, container facilities and cold chain infrastructure Special form of SEZ with focus on warehousing and international trading. 2. Components Rail and Road connectivity. Standard and Bonded
  • 36. Page 36 of 57 Banks, ATMs etc Hotels, Food parks and entertainment facilities. Warehouse. Rail and Road sidings. 3. Focus Domestic Market EXIM trade 4. Regulatory Classified under Infrastructure Industry Designated as foreign territory. Governed under SEZ Act 2005. 5. Specification NA Minimum built up area of 0.5 mn sq mtrs Minimum area of 40 Hectares Minimum capital outlay of INR 1 billion. 6. Incentives 22% tax exemption for continuous operations for 10 years. Granted only to developers. Same as SEZ. Developers and operators can avail benefits 7. Location Near SEZs and dedicated freight corridor FTWZ itself is considered as an SEZ (Source: Research on India Warehouse 2009) 5.5. Issues related with poor growth of warehousing. Various issues related with Warehousing industry and their mitigation measures have been tabulated below:- Table 13 : Challenges and Suggested Mitigation measures associated with Warehousing S.No Challenges Suggested Mitigation Measures 1. Huge investment on setting up of warehouse. Logistics parks may compensate same by giving some tax breaks. 2. Warehouses located in each state due to complex tax structure. Rolling out of GST will result in reduction of warehouses 3. Limited organized and outsourced warehousing Growth in organized retailing will boost warehousing.
  • 37. Page 37 of 57 4. Inefficient handling of goods. Use of IT for better inventory management and modern mechanical handling devices will improve efficiency. Figure 7: GST Driven Warehousing reorganization (Source: Transportation in India vol 2 by KPMG)
  • 38. Page 38 of 57 Chapter 6: COLD CHAIN 6.1. Introduction: India is the world’s second largest producer of food. India produces 47 million tons of fruits and 96 million tons of vegetables annually. Out of this 25-40% of annual agricultural produce is wasted and does not reaches consumer. In fact in 2003 produce worth INR 58,000 crore was wasted while same amount has been reduced to INR 30,000 crore in 2010. Following are reasons for same:- (a). Improper post harvest handling due to lack of awareness among farmers about advantages and methods of pre-cooling. (b). Poor road and transportation infrastructure result in slow movement of produce from to place of origin to point of sale. (c). Unavailability of temperature controlled warehouses. Figure 8 : A typical ambient supply chain for fruits and vegetables (Source: Avon Consulting Research) 6.2. 2nd Green Revolution – As 1st Green Revolution emphasized on modernization and mechanization of means of agriculture. Now due to rapidly rising population and shrinking agriculture land, 2nd Green Revolution has to come by ensuring zero wastage of produce between point of origin and point of sale by proper processing & preservation.
  • 39. Page 39 of 57 6.3. Integrated Cold Chain Concept. Cold Chain is a system which provides a series of facilities for maintaining ideal storage conditions for perishables from the point of origin to the point of sale. Pictorial diagram of same is given below. Figure 9 : Flow Chart of Integrated Cold Chain 6.4. Difference between Cold Storage and Temperature controlled Warehouse(TCW). Cold storage and TCW both use low temperature to store products but TCWs are more scientific and systematic in nature. In fact cold storage preceded TCWs. In cold storage temperature used to be fixed for complete storage, while in case of TCW, temperature of storage is maintained as per product kept inside storage, so as avoid chill / freezing injuries to product. 6.5. Chill/Freezing Injuries. It is basically injury/ decomposition and/or deterioration of produce due to exposure to low temperatures. Temperature is dependent on product and may not be same for everyone. Due to this injury certain products may start producing Ethylene gas also, which may result in damage to other products also which are healthy so far. In fact certain drugs/ injections decompose due chill / freezing injury and lose their potency and may be harmful due to change in composition. Collection Centres Processing centre Temperatur e Controlled Warehouse (TCW) Temperatur e Controlled Transport ( TCTs / Reefer Vans) Point of Sale/ Retail Stores Consumer Handleing/ Refrigitatio n
  • 40. Page 40 of 57 6.6. Process. After collection from farm i.e. point of origin, produce has to go through various stages before it reaches a buyer. Schematic diagram of these activities is given below. In the above activities two processes of Pre-cooling and handling (from point of harvest to point of sale) are very important as small error can be very costly. Details about Pre-cooling are given below. However if produce is not properly handled to include transported, cleaned, graded, sorted and packaged, might result in one bad product may pass through, then due to volume of produce stored it will be a herculean task to find out that bad product later on. Processing of bad product may remind us of old adage that ―One Bad Apple may spoil the Whole Basket‖. Due to enormous volume, size of basket may become quite large, thus there is a requirement of frequent and periodic inspection and turnover of produce stored in the CAS/ TCW. This will lead to arrest the deterioration of other produce at the earliest. Figure 10 : Product flow in a Cold Chain (Source:-http://www.slideshare.net/pxkohli/module-cc) 6.7. Pre-Cooling. Pre-cooling is key component in the preservation of quality for perishable by rapid removal of heat from freshly harvested produce. Due to exposure to sun and ambient temperature a lot of heat is stored inside farm produce. Respiration due to enzymatic oxidation in the growing produce continues after harvest. This process results in the consumption of sugars, starches and moisture without replenishment by the
  • 41. Page 41 of 57 plant. Carbon dioxide and other gases along with heat are generated in the process. If the heat is not removed, the process is accelerated. Growth of molds and the loss of moisture from the produce are also accelerated by heat. Bruising of the produce further accelerates these processes, resulting in the loss of texture, firmness, color, flavor and appearance. In addition, some nutritional value may also be lost. When these losses occur, the produce is generally considered to have lost its freshness and quality. This process is typically done before the produce is put into TCW. In fact pre cooling within 5 hours of harvest can double shelf life of produce. (Ref: http://www1.agric.gov.ab.ca/$department/deptdocs.nsf/all/agdex7461) 6.8. Benefits: By using a cold chain environment we can reap following benefits:- (a). Minimize post-harvest spoilage. (b). Extend shelf life and freshness of produce. (c). Round the year availability of produce. (d). Maintain nutritive value. (e). Prevent decay especially in non vegetarian and dairy products. (f). Safeguard potency of vaccines. Table 14 : Post Harvest Life Comparison of Some Common Use Items S.No Item Post Harvest Life without Controlled Atmosphere Storage (in days) Post Harvest Life with Controlled Atmosphere Storage (in days) 1. Banana 12 28 2. Mango 12 21 3. Apple 21 180 4. Orange 21 84 5. Papaya 21 84 6. Grapes 10 56
  • 42. Page 42 of 57 7. Egg Plant 10 14 8. Cabbage 18 180 9. Tomato 7 21 10. Peas 5 14 6.9. Market Analysis. On perusal of benefits mentioned above it can be inferred that cold chain will be extensively used by following market segment:- (a). Organized retail malls. (b). Exotic vegetable dealers. (c). Frozen non vegetarian product dealers. (d). Hotels. (e). Dairy produce dealers. (f). Wholesale pharmaceuticals distributors. 6.10. Demand and Supply Gap. Cold chain being a nascent industry in India, there is a huge demand and supply gap, same is evident from following data. Table 15: Demand Supply of TCW storage S.No Year Supply (in Thousand Tonnes) Demand (in Thousand Tonnes) Short fall (in Thousand Tonnes) 1 2005-06 17000 82,000 65,000 2 2007-08 19000 84,000 65,000 3 2010-11 23000 90,000 67,000 (Source:- www.transreporter.in/index.php?action=page&id=13&issue=SCM&id1=72)
  • 43. Page 43 of 57 6.11. Market Size. Over past few years market segment of TCWs in value terms have grown at @19% CAGR, while in volume terms it has grown @12-14% CAGR. As per research estimates growth rate in volume will be slightly low in forthcoming years due to capacity addition in last few years. However revenue earned will keep on rising due to increase in utilisation levels from 60% to 70%. Market size from revenue aspect of cold chain is given below:- Market Size - Cold Chain Figure 11 : Market Size - Cold Chain (In Billion of Rs) (Source:- http://www.omafra.gov.on.ca/english/crops/facts/98-021.htm) 6.12. Cost Structure. A cold chain has got two main components i.e. TCWs and TCTs. In order to reduce cost of land and additional civil construction, processing centre and TCWs are co-located. Details of various cost structure of a cold chain are given below:- Cold Chain Cost Rs 250-400 Million TCW Construction (7-10 TCWs) Rs 30-40 million each TCT Cost (15-20 TCTs) Rs 1.5-3.5 million each
  • 44. Page 44 of 57 Minimum Economic Size 4000-5000 Tonnes Capital Cost /Ton Rs 6000-7000 Land (Cost not included) 1.0-1.5 Acres 6.12.1 Cost Component TCW. Details of various components of TCWs are given below:- Figure 12: Capital cost break-up TCW (Source: CRISIL Report) 6.12.2. Operating cost break-up TCW. Extensive and continue air conditioning is required so as to maintain desired temperature in various chambers of TCW therefore cost of power is the main component of operating cost. Civil Construction 42% Refrigeratio n 25% Insulation 20% Others 8% Utility 5% Power 64% Labour 22% Licence 4% Maintenance 10%
  • 45. Page 45 of 57 6.12.3. Solar Power. Some market players in developed countries have tried to reduce power cost by installing solar/ photo volatile panels on roof of warehouse. Life of these panels is around 20 years and cost gets break even in approx six years, there by supplying almost free power for next 14 years or so. Break even period of this option highly depends on geographical location of warehouse. Power is used in a following manner. (i). Initially power from solar panels installed on roof is utilized. (ii). In case of less daylight, consumption and source of power are prioritized. Light dimmers which are activated by sensors are used so as to make up for shortfall power generation and to ensure enough power is available for air conditioning. (iii). In case of totally over- casted sky, power from grid is drawn. (iv). At the time of designing warehouse, emphasis light is available in working area there by reducing power consumption. (Ref:- http://www.nuworldresearch.com/images/051023%20Payback%20example%20DG%20.pdf) ( Ref:- http://www.corbisimages.com/Enlargement/Enlargement.aspx?id=42-4352066&caller=search)
  • 46. Page 46 of 57 6.13. Location of TCWs. While planning location of TCW, following two options are available:- (a). Next to Produce/ Harvest. When TCW is located close to harvest area it is economical for farmers to take their produce to TCW also product is relatively fresh as less time is spent in transportation. It may be possible that TCW may not be utilized for complete year as area may be producing one crop only. Also setup cost may be less due to comparatively cheap land but operational cost may be high as product will require frequent transshipment in TCVs to point of sale. Will require more number of TCVs as turnaround time of TCV will be more. (b). Next to Market. When TCW is located next to market it can be operational throughout the year as different products as per market demand can be stored, however due care and speedy movement of harvested produce has to be carried out as delay will set up aging in produce. Initial setup cost may be high due to costly land prices but operational cost may be less as TCV will be used for shorter distance and frequent replenishment of retail stores is possible. Also few TCVs will be required due to short turnaround time. 6.14. Issues related with poor growth of warehousing. Various issues related with Warehousing industry and their mitigation measures have been tabulated below:- Table 16 : Challenges and Suggested Mitigation measures associated with Setting Up of Cold Chain S.No Challenges Suggested Mitigation Measures 1. Huge Investment on setting up stores & Refrigerated vehicles. Opt for Cooperative or PPP model 2. High Operating cost, erratic Power Supply. Use of Solar Power panels and intelligent lighting system with generator for back up.
  • 47. Page 47 of 57 3. Food Safety-Increased Incident of food borne contamination. Strict adherence to Hazard Analysis Critical Control Points (HACCP) norms. 4. Allied infrastructure like pre cooling, transportation etc are not given any incentive. Case should be projected to government through various channels like CII, FICCI to revise policy. 5. Optimum Utilization of Space Establish backward and forward integration. 6.15. Hindrances in Commercialization of TCWs. (a). High Real Estate Prices. A typical 4000 -5000 ton TCW will require 1-1 ½ acre of land, which may cost INR 1-1 ½ Crore, thereby creating an entry barrier. (b). Erratic Power Supply. Due to power deficit in country, areas face frequent load shedding, thus investor has to procure generator set for power back up. Thus cost on account of procurement and operation of generator goes up. (c). Psyche of Indian Consumer. Indian consumer is price sensitive and may sacrifice quality for price hence products may spend more time in storage and shelf there by reducing margins. 6.17. Steps taken by Government of India to promote TCWs. (a). Cold chain was given status of Infrastructure in finance budget of 2011, where in 100% FDI is permissible. (b). Apart from this government has proposed some tax breaks by means of reducing custom duty to 2.5% and full wavier of exercise duty on plant equipment for refrigeration, air conditioning and conveyor belts. (c). Viability Gap Funding by government up to 25% of project cost is permissible.
  • 48. Page 48 of 57 (d). Launched scheme of mega food parks 6.18. Regulatory framework. In order to ensure safety and quality of products in cold chain it is vital to preserve the safety and quality of refrigerated foods and comply with regulatory norms and industry best practices. Hazard Analysis Critical Control Point (HACCP) spells out norms/practices for processing, handling, distribution and storage of chilled and frozen foods. HACCP provides management a tool aimed at complete commitment to product quality and safety. Seven principles of HACCP, with a brief indication of necessary action are given below: -  Identify the Potential Hazards: Together with the HACCP team (including microbiologists and process engineers) construct a flow diagram for all product/process operations – list all hazards associated with each process step – list measures which will eliminate or reduce hazards.  Determine the critical control points (CCPs) for identified hazards: Determine the CCP (a step at which control can be applied and is essential to eliminate the hazard).  Establish the target levels/tolerances for controlling the CCPs: Establish a predetermined value for control which has been shown to eliminate hazards at a CCP.  Establish/implement monitoring systems for controlling CCPs: Set out a planned sequence of observations or measurements to assess the degree of control on identified CCPs.  Identify corrective actions when a deviation occurs at a CCP: Identify a predetermined action for when the CCP indicates a loss of control.  Verify that the HACCP system is working: Establish and apply methods to ensure that the HACCP system is working, including documentary evidence, e.g. auditing, end product testing, process validation.  Establish a documentation system for procedures and records: Develop and maintain procedures and practices for record keeping.
  • 49. Page 49 of 57 6.19. Risk Analysis: Like any other project, there are lots of parameters which can be beyond the control of operators of TCW. Associated risks, their allocation and mitigation framework is given at appendix ―A‖. 6.20. Ownership of Cold Chain. As cold chain is a capital intensive industry and specially requires huge capital cost in during setup stage. Suggested framework for two ownerships models i.e. Cooperative Model and Public Private Partnership Models is given below:- (a). Cooperative Model. In this various stakeholders contribute and form a cooperative and pool in finances and resources. Setup of a typical US cooperative is given below:- Figure 13 : Typical US Cooperative Cold Chain (Source: Avon Consulting Research) (b). PPP Model : In order to utilize expertise, experience and finance of private sector, TCWs can be established in PPP mode where in they will be used to store precious agri-produce so as to avoid wastage. One such model of Use or Pay in Build-Own-Operate and Transfer Model (BOLT) is discussed here. In
  • 50. Page 50 of 57 said model private player will arrange for finance, construct, own, operate and maintain a TCW for 12-15 years period and there-after handover the infrastructure to public sector for further operation (Provided technology obsolesce has not taken place and equipment installed is functioning efficiently ). Government can contribute in said project by following means:-  Provisioning of government land for creation of infrastructure.  Arranging 30% of capital at low interest rates/ viability gap funding as cost of setting up of TCW chain are high.  Developing necessary infrastructure like provision of connectivity, electricity and water etc on priority.  Arranging mandatory regulatory clearances from single window for early commencement of project.  Getting into contract of Use or Pay for 25-35% of storage space/ tonnage for usage by cooperative stores like Mother Dairy vegetable stores etc to provide off season vegetables at moderate prices. Revenue earned by private player by this arrangement will be utilized for day to day operation.  Provision of power at domestic/ household rates for initial five years i.e. till the time capacity utilization levels comes to 80-85% (whichever happens earlier) and thereafter industrial/ commercial prices. As mentioned earlier that revenue earned by private sector from public sector will be used to pay for day to day expenditure and revenue earned by own operations of TCW of 75-65% space/ tonnage, can be used by private sector can be used to pay back loan amount/ cost of capital.
  • 51. Page 51 of 57 Chapter 7: Conclusion 7.1. In order to improve India’s logistics efficiency and make it comparable to global standards it is suggested that a National Integrated Logistics Policy (NILP) should be laid down. Key objectives of NILP can be:-  Increase rail freight to more than 45% by 2020.  Limiting the economic losses attributed to logistics to less than 4 per cent of GDP (USD100 billion).  Achieving on-time and on-budget delivery of infrastructure projects, which requires an improvement in project implementation relative to current performance. Figure 14: Proposed shift in Inter Modal Transport (Source: Building India, transforming the nation’s logistics infrastructure by Mckinesy India) 7.2. Key programmes of NILP should focus on following issues:-  Rail dedicated freight corridors: Programme should have a dual focus. First, accelerating the construction of two planned DFCs—Delhi- Kolkata and Delhi- Mumbai—and simultaneously incorporating SPVs for three additional DFCs i.e. Kolkata-Mumbai, Delhi-Chennai, Mumbai-Chennai corridors.
  • 52. Page 52 of 57  Coastal freight corridors: Objective is to strengthen the Western i.e., Kandla to Kochi and Eastern i.e., Kolkata to Chennai coastal freight corridors through integrated projects that include last-mile rail and road programmes, transshipment hubs, proactive marketing and accelerated port development.  National expressways: Includes constructing expressways of 100 to 300 km stretches, so as to cater for expected increases in traffic by 2020. While currently 5 to 7 expressways are likely to be built by 2020, ideally, the number of expressways should be increased to over 20 by 2020. Expressways should include high-traffic routes such as Nasik-Shirpur and Ghaziabad-Bareilly.  Last-mile roads: Creating a dedicated last mile programme with over 750 last-mile links to connect in particular port and railway terminals to production and distribution centers.  Last-mile rail: Aim is to ensure last mile rail infrastructure in many of the last 750 mile links. It will include developing track and rail head infrastructure to support 8 to 10 critical coal corridors in mineral rich states such as Jharkhand, Chattisgarh and Orissa.  Multi-modal logistics parks: These parks will predominantly focus on demarcating land for logistics parks at 15 to 20 key points where different modes overlap, near major cities, or along proposed DFC routes. Designed as concessions, these should be equipped with the necessary infrastructure to ensure the seamless movement of freight across modes.  Roads maintenance: This will involve creating long (e.g. 10 years) annuity-based maintenance contracts for 400 km to 500 km stretches. The current practice of issuing contracts for shorter distances of 50 km to 100 km will be done away with. By extending both the duration of contracts and increasing the road stretches to be maintained could act as an incentive to providers to achieve scale and invest in better technology, thereby reducing costs.
  • 53. Page 53 of 57  Adoption of electronic tolling: This will standardize technology for nationwide electronic toll collection (ETC) in future contracts and establishing a nationwide clearing house with set norms and service standards to facilitate transactions, thereby reducing waiting time and improving service levels.  Logistics skills development: Adopting a balanced modal approach will increase demand for requisite skills. In particular, demand for four types of personnel will grow i.e. warehouse managers, logistics managers, coastal seafarers and truck drivers. This in turn will require upgrading the training infrastructure and collaborating with institutes of technology, engineering colleges, marine training institutes and driver training institutes to help meet growing demand.  Enabling access to better equipment and setting common standards: Will involve acquiring access to better equipment such as larger trucks and higher tare load railway wagons and developing common standards to aid inter-modal transport that ensures consistency in containers, pallets and cranes. (Source: Building India, transforming the nation’s logistics infrastructure by Mckinesy India)
  • 54. Page 54 of 57 References S. No. Reference 1 http://www.ieor.iitb.ac.in/files/faculty/narayan/transport/iwt-tec-rep-oct-05.pdf retrieved on 19 Jul 2011. 2 http://www.tcil.com/water.asp retrieved on 19 Jul 2011 3 http://www.scribd.com/doc/58239035/India-Logistic-Paper-Report-Cushman-Wakefield retrieved on 21 Jul 2011. 4 Internal Waterway Authority of India. http://iwai.gov.in 5 Long term perspective on Inland Waterway Transport in India by Dr S Sriram 6 http://planningcommission.nic.in/reports/genrep/rep_logis.pdf 7 www1.agric.gov.ab.ca/$department/deptdocs.nsf/all/agdex7461 8 www.corbisimages.com/Enlargement/Enlargement.aspx?id=42-4352066&caller= search 9 www.nuworldresearch.com/images/051023%20Payback%20example%20DG%20 10 www.slideshare.net/pxkohli/module-cc 11 www.omafra.gov.on.ca/english/crops/facts/98-021.htm 12 www.transreporter.in/index.php?action=page&id=13&issue=SCM&id1=72 13 http://www.constructionupdate.com/News.aspx?nId=+mVddpTDZP5V1ZNbAIP3AA==&Ne wsType=Cold-chain:-Finally-warming-up-to-India--India-Sector 14 http://logisticsweek.com/feature/2011/07/fresh-look-at-cold-chain-sector/ 15 http://web.worldbank.org/WBSITE/EXTERNAL/TOPICS/EXTTRANSPORT/EXTTLF/0,,cont entMDK:21514122~menuPK:3875957~pagePK:210058~piPK:210062~theSitePK:515434,0 0.html 16 http://www.nsdcindia.org/pdf/transportation-logistics.pdf 17 http://www.mckinsey.com/locations/india/mckinseyonindia/pdf/Logistics_Infrastructure_by20 20_fullreport.pdf 18 Building India, transforming the nation’s logistics infrastructure by Mckinesy India 19 http://go.worldbank.org/FUE8JM6E40 20 http://web.worldbank.org/WBSITE/EXTERNAL/COUNTRIES/SOUTHASIAEXT/EXTSARRE GTOPTRANSPORT/0,,contentMDK:20703625~menuPK:868822~pagePK:34004173~piPK: 34003707~theSitePK:579598,00.html 21 http://www.adb.org/Documents/Papers/INRM-PolicyBriefs/inrm14.pdf 22 Bottlenecks in the Growth of Coastal Shipping by S. Sundar and Pragya Jaswal 23 http://www.marinersnetwork.com/index2.php?option=com_content&do_pdf=1&id=81 24 ftp://59.165.244.210/ebrok/Research/Sector/Railways%20Sector-IDBICap.pdf
  • 55. Page 55 of 57 Appendix ―A‖ (Refers to Para 6.19) Table 17 : Risk Allocation framework for TCW project S,No Risk Type Sensitivity Risk Period (in years) Primary Risk Bearer Remarks 1. Financing Risk Medium 0-3 Private sector Private player has to achieve financial closure in a given time frame after award of contract. May seek viability gap funding or loan on lower interest rates 2. Delay in land purchase Medium 0-1 Private sector Care-full research and analysis of business model i.e. store more quantities of few products by locating TCW near produce or by opting less quantity of more products by locating TCW near market. 3. Design and layout of TCW Medium 0-1 Private sector If TCW is located near produce then will have fewer rooms with more storage else will have more rooms with less storage.
  • 56. Page 56 of 57 4. Regulatory approvals for initiation Low 0-1 Private sector Private sector has to take various clearances from various government bodies for initiation of project till completion of project. 5. Construction Risk Medium 0-2 Private sector Said risk can be transferred to EPC contractor and mitigated award of turnkey contract with penalty clause for delay in construction time and stipulating total cost of project. 6. Technology Obsolesce Medium 5-15 Private Sector Use of proven state of art technology. 7. Maintenance of safety and health hazard audit Medium 0-15 Private sector Periodic safety audits. Hire trained manpower. Periodic safety drills. Periodic inspection by regulatory bodies regarding practices adopted at TCW. 8. Capacity utilization High 0-10 Private sector Aggressive marketing.
  • 57. Page 57 of 57 and Public Sector Spreading awareness among farmers about advantages. Attracting farmers by providing them good quality seeds and reasonable price for produce so as to have a win – win situation for both parties. Use or Pay contract with public sector for a fixed volume/ tonnage of storage. 9. Provision of uninterrupted power supply Medium 0-15 Private sector Use of gensets for short and planned power outages. Use of solar power for power deficit area. Use of modern technology. Use of better quality of insulation material for maintaining desired temperature. 10. Force Majeure High 0-12 Private Sector Can be mitigated by insuring project.