Midterm Exam
Create an Excel worksheet with a list of your answers from 1-100. Put your answer choice for each question in a second column
using a CAPITAL LETTER.
On a separate sheet or beginning in a third column, include any calculations used to solve the questions. This includes any
functions you use to assist you.
MULTIPLE CHOICE. Choose the one alternative that best completes the statement or answers the question.
Solve the problem.
1) Alex and Juana went on a 25-mile canoe trip with their class. On the first day they traveled 17 miles. What
percent of the total distance did they canoe?
A) 68% B) 1% C) 0.68% D) 100%
2) On a test, if 115 questions are answered and 41% of them are correct, what is the number of correct answers?
A) 53 B) 74 C) -24 D) 47
Determine whether the given value is a statistic or a parameter.
3) A sample of 120 employees of a company is selected, and the average age is found to be 37 years.
A) Parameter B) Statistic
4) After taking the first exam, 15 of the students dropped the class.
A) Parameter B) Statistic
5) After inspecting all of 55,000 kg of meat stored at the Wurst Sausage Company, it was found that 45,000 kg of
the meat was spoiled.
A) Statistic B) Parameter
6) A health and fitness club surveys 40 randomly selected members and found that the average weight of those
questioned is 157 lb.
A) Statistic B) Parameter
Determine whether the given value is from a discrete or continuous data set.
7) The number of freshmen entering college in a certain year is 621.
A) Discrete B) Continuous
8) The temperature of a cup of coffee is 67.3°F.
A) Continuous B) Discrete
9) The weight of Bill's pack as he sets off on a backpacking trip is 48.3 lb.
A) Discrete B) Continuous
10) The number of limbs on a 2-year-old oak tree is 21.
A) Discrete B) Continuous
Determine whether the given description corresponds to an observational study or an experiment.
11) A marketing firm does a survey to find out how many people use a product. Of the one hundred people
contacted, fifteen said they use the product.
A) Experiment B) Observational study
1
12) A clinic gives a drug to a group of ten patients and a placebo to another group of ten patients to find out if the
drug has an effect on the patients' illness.
A) Experiment B) Observational study
13) A sample of fish is taken from a lake to measure the effect of pollution from a nearby factory on the fish.
A) Observational study B) Experiment
14) A political pollster reports that his candidate has a 10% lead in the polls with 10% undecided.
A) Observational study B) Experiment
Identify which of these types of sampling is used: random, stratified, systematic, cluster, convenience.
15) The name of each contestant is written on a separate card, the cards are placed in a bag, and three names are
picked from the bag.
A) Systematic B) Random C) Convenience D) Cluster E) Stratified
Provide an appropriate response.
16) An education expert is researching teaching meth ...
HMCS Max Bernays Pre-Deployment Brief (May 2024).pptx
Midterm ExamCreate an Excel worksheet with a list of your .docx
1. Midterm Exam
Create an Excel worksheet with a list of your answers from 1-
100. Put your answer choice for each question in a second
column
using a CAPITAL LETTER.
On a separate sheet or beginning in a third column, include any
calculations used to solve the questions. This includes any
functions you use to assist you.
MULTIPLE CHOICE. Choose the one alternative that best
completes the statement or answers the question.
Solve the problem.
1) Alex and Juana went on a 25-mile canoe trip with their class.
On the first day they traveled 17 miles. What
percent of the total distance did they canoe?
A) 68% B) 1% C) 0.68% D) 100%
2) On a test, if 115 questions are answered and 41% of them are
correct, what is the number of correct answers?
A) 53 B) 74 C) -24 D) 47
Determine whether the given value is a statistic or a parameter.
3) A sample of 120 employees of a company is selected, and the
average age is found to be 37 years.
A) Parameter B) Statistic
4) After taking the first exam, 15 of the students dropped the
2. class.
A) Parameter B) Statistic
5) After inspecting all of 55,000 kg of meat stored at the Wurst
Sausage Company, it was found that 45,000 kg of
the meat was spoiled.
A) Statistic B) Parameter
6) A health and fitness club surveys 40 randomly selected
members and found that the average weight of those
questioned is 157 lb.
A) Statistic B) Parameter
Determine whether the given value is from a discrete or
continuous data set.
7) The number of freshmen entering college in a certain year is
621.
A) Discrete B) Continuous
8) The temperature of a cup of coffee is 67.3°F.
A) Continuous B) Discrete
9) The weight of Bill's pack as he sets off on a backpacking trip
is 48.3 lb.
A) Discrete B) Continuous
10) The number of limbs on a 2-year-old oak tree is 21.
A) Discrete B) Continuous
Determine whether the given description corresponds to an
observational study or an experiment.
11) A marketing firm does a survey to find out how many
people use a product. Of the one hundred people
3. contacted, fifteen said they use the product.
A) Experiment B) Observational study
1
12) A clinic gives a drug to a group of ten patients and a
placebo to another group of ten patients to find out if the
drug has an effect on the patients' illness.
A) Experiment B) Observational study
13) A sample of fish is taken from a lake to measure the effect
of pollution from a nearby factory on the fish.
A) Observational study B) Experiment
14) A political pollster reports that his candidate has a 10% lead
in the polls with 10% undecided.
A) Observational study B) Experiment
Identify which of these types of sampling is used: random,
stratified, systematic, cluster, convenience.
15) The name of each contestant is written on a separate card,
the cards are placed in a bag, and three names are
picked from the bag.
A) Systematic B) Random C) Convenience D) Cluster E)
Stratified
Provide an appropriate response.
16) An education expert is researching teaching methods and
wishes to interview teachers from a particular school
district. She randomly selects ten schools from the district and
4. interviews all of the teachers at the selected
schools. Does this sampling plan result in a random sample?
Simple random sample? Explain.
A) No; yes. The sample is not random because teachers in small
schools are more likely to be selected than
teachers in larger schools. It is a simple random sample because
all samples have the same chance of being
selected.
B) Yes; yes. The sample is random because all teachers have the
same chance of being selected. It is a simple
random sample because all samples have the same chance of
being selected.
C) No; no. The sample is not random because teachers in small
schools are more likely to be selected than
teachers in larger schools. It is not a simple random sample
because some samples are not possible, such
as a sample that includes teachers from schools that were not
selected.
D) Yes; no. The sample is random because all teachers have the
same chance of being selected. It is not a
simple random sample because some samples are not possible,
such as a sample that includes teachers
from schools that were not selected.
17) A psychology student wishes to investigate differences in
political opinions between business majors and
political science majors at her college. She randomly selects
100 students from the 260 business majors and 100
students from the 180 political science majors. Does this
sampling plan result in a random sample? Simple
random sample? Explain.
5. A) Yes; yes. The sample is random because all students have the
same chance of being selected. It is a simple
random sample because all samples of size 200 have the same
chance of being selected.
B) No; no. The sample is not random because political science
majors have a greater chance of being selected
than business majors. It is not a simple random sample because
some samples are not possible, such as a
sample consisting of 50 business majors and 150 political
science majors.
C) No; yes. The sample is not random because political science
majors have a greater chance of being selected
than business majors. It is a simple random sample because all
samples of size 200 have the same chance
of being selected.
D) Yes; no. The sample is random because all students have the
same chance of being selected. It is not a
simple random sample because some samples are not possible,
such as a sample consisting of 50 business
majors and 150 political science majors.
2
18) A computer company employs 100 software engineers and
100 hardware engineers. The personnel manager
randomly selects 20 of the software engineers and 20 of the
hardware engineers and questions them about
career opportunities within the company. Does this sampling
plan result in a random sample? Simple random
sample? Explain.
6. A) No; no. The sample is not random because not all employees
have the same chance of being selected. It is
not a simple random sample because some samples are not
possible, such as a sample consisting of 30
software engineers and 10 hardware engineers.
B) Yes; no. The sample is random because all employees have
the same chance of being selected. It is not a
simple random sample because some samples are not possible,
such as a sample consisting of 30 software
engineers and 10 hardware engineers.
C) No; yes. The sample is not random because not all employees
have the same chance of being selected. It is
a simple random sample because all samples of size 40 have the
same chance of being selected.
D) Yes; yes. The sample is random because all employees have
the same chance of being selected. It is a
simple random sample because all samples of size 40 have the
same chance of being selected.
19) The personnel manager at a company wants to investigate
job satisfaction among the female employees. One
evening after a meeting she talks to all 30 female employees
who attended the meeting. Does this sampling plan
result in a random sample? Simple random sample? Explain.
A) Yes; no. The sample is random because all female employees
have the same chance of being selected. It is
not a simple random sample because some samples are not
possible, such as a sample containing female
employees who did not attend the meeting.
B) No; no. The sample is not random because not all female
employees have the same chance of being
7. selected. Those that didn't attend the meeting have no chance of
being selected. It is not a simple random
sample because some samples are not possible, such as a sample
containing female employees who did
not attend the meeting.
C) Yes; yes. The sample is random because all female
employees have the same chance of being selected. It is
a simple random sample because all samples of size 30 have the
same chance of being selected.
D) No; yes. The sample is not random because not all female
employees have the same chance of being
selected. Those that didn't attend the meeting have no chance of
being selected. It is a simple random
sample because all samples of 30 female employees have the
same chance of being selected.
20) A polling company obtains an alphabetical list of names of
voters in a precinct. They select every 20th person
from the list until a sample of 100 is obtained. They then call
these 100 people. Does this sampling plan result in
a random sample? Simple random sample? Explain.
A) No; yes. The sample is not random because not all voters
have the same chance of being selected. The
second person on the list has no chance of being selected. It is a
simple random sample because all
samples of 100 voters have the same chance of being selected.
B) Yes; yes. The sample is random because all voters have the
same chance of being selected. It is a simple
random sample because all samples of 100 voters have the same
chance of being selected.
C) Yes; no. The sample is random because all voters have the
8. same chance of being selected. It is not a simple
random sample because some samples are not possible, such as
a sample containing the second person on
the list.
D) No; no. The sample is not random because not all voters
have the same chance of being selected. The
second person on the list has no chance of being selected. It is
not a simple random sample because some
samples are not possible, such as a sample containing the
second person on the list.
3
21) A researcher obtains an alphabetical list of the 2560
students at a college. She uses a random number generator
to obtain 50 numbers between 1 and 2560. She chooses the 50
students corresponding to those numbers. Does
this sampling plan result in a random sample? Simple random
sample? Explain.
A) No; no. The sample is not random because not all students
have the same chance of being selected. It is not
a simple random sample because some samples are not possible,
such as a sample containing the the first
50 students on the list.
B) Yes; yes. The sample is random because all students have the
same chance of being selected. It is a simple
random sample because all samples of 50 students have the
same chance of being selected.
C) No; yes. The sample is not random because not all students
have the same chance of being selected. It is a
9. simple random sample because all samples of 50 students have
the same chance of being selected.
D) Yes; no. The sample is random because all students have the
same chance of being selected. It is not a
simple random sample because some samples are not possible,
such as a sample containing the first 50
students on the list.
22) An electronics store receives a shipment of eight boxes of
calculators. Each box contains ten calculators. A
quality control inspector chooses a box by putting eight
identical slips of paper numbered 1 to 8 into a hat,
mixing thoroughly and then picking a slip at random. He then
chooses a calculator at random from the box
selected using a similar method with ten slips of paper in a hat.
He repeats the process until he obtains a
sample of 5 calculators for quality control testing. Does this
sampling plan result in a random sample? Simple
random sample? Explain.
A) No; yes. The sample is not random because not all
calculators have the same chance of being selected. It is
a simple random sample because all samples of 5 calculators
have the same chance of being selected.
B) No; no. The sample is not random because not all calculators
have the same chance of being selected. It is
not a simple random sample because some samples are not
possible, such as a sample containing 5
calculators from the same box.
C) Yes; no. The sample is random because all calculators have
the same chance of being selected. It is not a
simple random sample because some samples are not possible,
such as a sample containing 5 calculators
10. from the same box.
D) Yes; yes. The sample is random because all calculators have
the same chance of being selected. It is a
simple random sample because all samples of 5 calculators have
the same chance of being selected.
Identify the type of observational study (cross-sectional,
retrospective, prospective).
23) A statistical analyst obtains data about ankle injuries by
examining a hospital's records from the past 3 years.
A) Prospective B) Cross-sectional C) Retrospective D) None of
these
24) Researchers collect data by interviewing athletes who have
won olympic gold medals from 1992 to 2008.
A) Cross-sectional B) Retrospective C) Prospective D) None of
these
25) A researcher plans to obtain data by following those in
cancer remission since January of 2005.
A) Retrospective B) Prospective C) Cross-sectional D) None of
these
26) A town obtains current employment data by polling 10,000
of its citizens this month.
A) Retrospective B) Prospective C) Cross-sectional D) None of
these
4
Provide an appropriate response.
27) The following frequency distribution analyzes the scores on
11. a math test. Find the class boundaries of scores
interval 40-59.
Scores Number of students
40-59 2
60-75 4
76-82 6
83-94 15
95-99 5
A) 39.5, 58.5 B) 40.5, 59.5 C) 40.5, 58.5 D) 39.5, 59.5
28) The following frequency distribution analyzes the scores on
a math test. Find the class midpoint of scores
interval 40-59.
Scores Number of students
40-59 2
60-75 4
76-82 6
83-94 15
95-99 5
A) 50.5 B) 48.5 C) 49.0 D) 49.5
29) The frequency distribution below summarizes the home sale
prices in the city of Summerhill for the month of
June. Find the class boundaries for class 80.0-110.9.
(Sale price in thousand $) Frequency
80.0 - 110.9 2
111.0 - 141.9 5
142.0 - 172.9 7
173.0 - 203.9 10
204.0 - 234.9 3
12. 235.0 - 265.9 1
A) 79.90, 110.95 B) 80.00, 110.95 C) 79.95, 110.95 D) 79.90,
111.0
5
Construct the cumulative frequency distribution that
corresponds to the given frequency distribution.
30)
Weight (oz)
Number
of Stones
1.2-1.6 5
1.7-2.1 2
2.2-2.6 5
2.7-3.1 5
3.2-3.6 13
A)
Weight (oz)
Cumulative
Frequency
1.2-1.6 5
1.7-2.1 7
2.2-2.6 12
2.7-3.1 17
3.2-3.6 30
B)
13. Weight (oz)
Cumulative
Frequency
Less than 1.7 5
Less than 2.2 7
Less than 2.7 12
Less than 3.2 17
Less than 3.7 28
C)
Weight (oz)
Cumulative
Frequency
Less than 2.2 7
Less than 3.2 17
Less than 3.7 30
D)
Weight (oz)
Cumulative
Frequency
Less than 1.7 5
Less than 2.2 7
Less than 2.7 12
Less than 3.2 17
Less than 3.7 30
6
14. Provide an appropriate response.
31) The frequency distribution for the weekly incomes of
students with part-time jobs is given below.
Construct the corresponding relative frequency distribution.
Round relative frequencies to the nearest
hundredth of a percent if necessary.
Income ($) Frequency
200-300 55
301-400 70
401-500 73
501-600 68
More than 600 10
A)
Income ($)
Relative
Frequency
201-300 15.5%
301-400 22.1%
401-500 31.3%
501-600 16.2%
More than600 14.9%
B)
Income ($)
Relative
Frequency
200-300 25.98%
15. 301-400 24.91%
401-500 3.65%
501-600 19.64%
More than 600 26.07%
C)
Income ($)
Relative
Frequency
200-300 12.5%
301-400 20.1%
401-500 37.3%
501-600 15.2%
More than 600 14.9%
D)
Income ($)
Relative
Frequency
200-300 19.93%
301-400 25.36%
401-500 26.45%
501-600 24.64%
More than 600 3.62%
7
32) The scores on a recent statistics test are given in the
16. frequency distribution below. Construct the corresponding
relative frequency distribution. Round relative frequencies to
the nearest hundredth of a percent if necessary.
Scores Frequency
0-60 3
61-70 10
71-80 11
81-90 4
91-100 1
A)
Scores
Relative
Frequency
0-60 0.21%
61-70 0.24%
71-80 0.55%
81-90 0.03%
91-100 -0.03%
B)
Scores
Relative
Frequency
0-60 10.34%
61-70 34.48%
71-80 37.93%
81-90 13.79%
91-100 3.45%
C)
17. Scores
Relative
Frequency
0-60 12.5%
61-70 20.1%
71-80 37.3%
81-90 15.2%
91-100 14.9%
D)
Scores
Relative
Frequency
0-60 15.5%
61-70 22.1%
71-80 31.3%
81-90 16.2%
91-100 14.9%
33) Sturges' guideline suggests that when constructing a
frequency distribution, the ideal number of classes can be
approximated by 1 + (log n)/(log 2), where n is the number of
data values. Use this guideline to find the ideal
number of classes when the number of data values is 148.
A) 7 B) 10 C) 8 D) 9
8
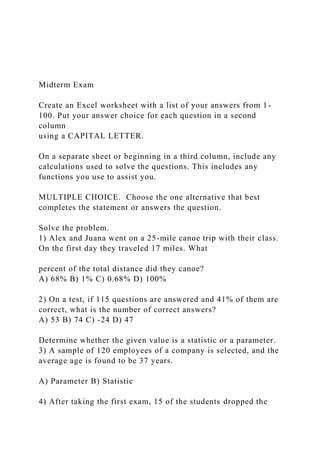
34) A nurse measured the blood pressure of each person who
18. visited her clinic. Following is a relative-frequency
histogram for the systolic blood pressure readings for those
people aged between 25 and 40. The blood pressure
readings were given to the nearest whole number.
Approximately what percentage of the people aged 25-40
had a systolic blood pressure reading between 110 and 119
inclusive?
A) 3.5% B) 0.35% C) 35% D) 30%
35) A nurse measured the blood pressure of each person who
visited her clinic. Following is a relative-frequency
histogram for the systolic blood pressure readings for those
people aged between 25 and 40. The blood pressure
readings were given to the nearest whole number.
Approximately what percentage of the people aged 25-40
had a systolic blood pressure reading between 110 and 139
inclusive?
A) 59% B) 39% C) 89% D) 75%
9
36) A nurse measured the blood pressure of each person who
visited her clinic. Following is a relative-frequency
histogram for the systolic blood pressure readings for those
people aged between 25 and 40. The blood pressure
readings were given to the nearest whole number. What class
width was used to construct the relative
frequency distribution?
A) 100 B) 10 C) 11 D) 9
37) The histogram below represents the number of television
19. sets per household for a sample of U.S. households.
How many households are included in the histogram?
A) 90 B) 95 C) 100 D) 110
10
38) The histogram below represents the number of television
sets per household for a sample of U.S. households.
What is the minimum number of households having the same
number of television sets?
A) 100 B) 20 C) 5 D) 1
Construct the dotplot for the given data.
39) A store manager counts the number of customers who make
a purchase in his store each day. The data are as
follows.
10 11 8 14 7 10 10 11 8 7
5 10 15
A)
5 10 15
B)
5 10 15
C)
5 10 15
20. D)
5 10 15
11
Use the data to create a stemplot.
40) The attendance counts for this season's basketball games are
listed below.
227 239 215 219
221 233 229 233
235 228 245 231
A)
21
22
23
24
5 9
1 7 8 9
1 3 3 5 9
5
B)
21
22
23
24
5 7 9
1 8 9
1 3 3 5 9
21. 5
Solve the problem.
41) A car dealer is deciding what kinds of vehicles he should
order from the factory. He looks at his sales report for
the preceding period. Choose the vertical scale so that the
relative frequencies are represented.
Vehicle Sales
Economy 20
Sports 5
Family 35
Luxury 10
Truck 30
Construct a Pareto chart to help him decide.
A) B)
12
C) D)
Find the mean for the given sample data. Unless indicated
otherwise, round your answer to one more decimal place than
is present in the original data values.
42) Listed below are the amounts of time (in months) that the
employees of a restaurant have been working at the
restaurant. Find the mean.
1 5 6 8 11 14 17 46 61 90 99 126 143 167
22. A) 56.7 months B) 52.9 months C) 31.5 months D) 61.1 months
Find the median for the given sample data.
43) The number of vehicles passing through a bank drive-up
line during each 15-minute period was recorded. The
results are shown below. Find the median number of vehicles
going through the line in a fifteen-minute period.
25 27 25 28
28 25 30 27
35 31 31 29
24 31 25 20
15 27 27 27
A) 28 vehicles B) 31 vehicles C) 26.85 vehicles D) 27 vehicles
Find the mode(s) for the given sample data.
44) The weights (in ounces) of 14 different apples are shown
below.
5.0 6.5 6.0 6.2 6.6 5.0 6.5
4.5 5.8 6.2 5.0 4.5 6.2 6.3
A) no mode B) 5.0 oz, 6.2 oz C) 5.0 oz D) 6.2 oz
Find the midrange for the given sample data.
45) Bill kept track of the number of hours he spent exercising
each week. The results for 15 weeks are shown below.
Find the midrange.
7.1 6.8 7.1 7.2 7.8
7.9 6.5 8.4 8.5 7.2
8.5 6.8 7.9 9.0 7.8
A) 7.50 hr B) 7.75 hr C) 2.5 hr D) 7.8 hr
23. 13
Find the mean of the data summarized in the given frequency
distribution.
46) A company had 80 employees whose salaries are
summarized in the frequency distribution below. Find the
mean salary.
Salary ($) Employees
5,001-10,000 17
10,001-15,000 12
15,001-20,000 12
20,001-25,000 15
25,001-30,000 24
A) $16,706.25 B) $17,500 C) $20,418.75 D) $18,562.50
47) The manager of a bank recorded the amount of time each
customer spent waiting in line during peak business
hours one Monday. The frequency distribution below
summarizes the results. Find the mean waiting time.
Round your answer to one decimal place.
Waiting time
(minutes)
Number of
customers
0 - 3 10
4 - 7 13
8 - 11 12
24. 12 - 15 5
16 - 19 7
20 - 23 1
24 - 27 2
A) 13.5 min B) 7.1 min C) 9.3 min D) 9.4 min
Find the range for the given sample data.
48) Fred, a local mechanic, recorded the price of an oil and
filter change at twelve competing service stations. The
prices (in dollars) are shown below.
32.99 24.95 26.95 28.95
18.95 28.99 30.95 22.95
24.95 26.95 29.95 28.95
A) $32.99 B) $12.00 C) $14.04 D) $10.05
Find the variance for the given data. Round your answer to one
more decimal place than the original data.
49) The owner of a small manufacturing plant employs six
people. As part of their personnel file, she asked each
one to record to the nearest one-tenth of a mile the distance they
travel one way from home to work. The six
distances are listed below:
26 32 29 16 45 19
A) 5043.6 mi2 B) 107.0 mi2 C) 18.9 mi2 D) 15.8 mi2
Find the standard deviation for the given sample data. Round
your answer to one more decimal place than is present in
the original data.
50) Listed below are the amounts of weight change (in pounds)
for 12 women during their first year of work after
25. graduating from college. Positive values correspond to women
who gained weight and negative values
correspond to women who lost weight.
15 -5 14 8 -1 10 -6 1 0 4 -3 9
A) 7.2 lb B) 6.9 lb C) 7.6 lb D) 7.4 lb
14
Find the coefficient of variation for each of the two sets of data,
then compare the variation. Round results to one decimal
place.
51) Listed below are the systolic blood pressures (in mm Hg)
for a sample of men aged 20-29 and for a sample of
men aged 60-69.
Men aged 20-29: 117 122 129 118 131 123
Men aged 60-69: 130 153 141 125 164 139
A) Men aged 20-29: 4.6%
Men aged 60-69: 10.2 %
There is substantially more variation in blood pressures of the
men aged 60-69.
B) Men aged 20-29: 4.4%
Men aged 60-69: 8.3%
There is substantially more variation in blood pressures of the
men aged 60-69.
C) Men aged 20-29: 7.6%
Men aged 60-69: 4.7%
There is more variation in blood pressures of the men aged 20-
29.
26. D) Men aged 20-29: 4.8%
Men aged 60-69: 10.6%
There is substantially more variation in blood pressures of the
men aged 60-69.
Find the standard deviation of the data summarized in the given
frequency distribution.
52) The manager of a bank recorded the amount of time each
customer spent waiting in line during peak business
hours one Monday. The frequency distribution below
summarizes the results. Find the standard deviation.
Round your answer to one decimal place.
Waiting time
(minutes)
Number of
customer
0-3 13
4-7 13
8-11 10
12-15 11
16-19 0
20-23 3
A) 7.0 min B) 5.6 min C) 5.3 min D) 5.9 min
Use the empirical rule to solve the problem.
53) The systolic blood pressure of 18-year-old women is
normally distributed with a mean of 120 mmHg and a
standard deviation of 12 mmHg. What percentage of 18-year-old
27. women have a systolic blood pressure
between 96 mmHg and 144 mmHg?
A) 95% B) 99.7% C) 68% D) 99.99%
Solve the problem.
54) The ages of the members of a gym have a mean of 44 years
and a standard deviation of 12 years. What can you
conclude from Chebyshev's theorem about the percentage of
gym members aged between 26 and 62?
A) The percentage is at most 55.6% B) The percentage is at
least 33.3%
C) The percentage is approximately 33.3% D) The percentage is
at least 55.6%
Solve the problem. Round results to the nearest hundredth.
55) Scores on a test have a mean of 66 and a standard deviation
of 9. Michelle has a score of 57. Convert Michelle's
score to a z-score.
A) 1 B) -9 C) 9 D) -1
15
56) The mean of a set of data is 4.11 and its standard deviation
is 3.03. Find the z score for a value of 10.86.
A) 2.45 B) 2.23 C) 2.53 D) 2.01
57) The mean of a set of data is -2.91 and its standard deviation
is 3.88. Find the z score for a value of 2.80.
A) 1.47 B) 1.62 C) 1.77 D) 1.32
Find the number of standard deviations from the mean. Round
28. your answer to two decimal places.
58) The test scores on the Chapter 10 mathematics test have a
mean of 52 and a standard deviation of 10. Andrea
scored 86 on the test. How many standard deviations from the
mean is that?
A) 0.49 standard deviations above the mean B) 3.40 standard
deviations below the mean
C) 0.49 standard deviations below the mean D) 3.40 standard
deviations above the mean
Find the z-score corresponding to the given value and use the z-
score to determine whether the value is unusual.
Consider a score to be unusual if its z-score is less than -2.00 or
greater than 2.00. Round the z-score to the nearest tenth
if necessary.
59) A test score of 48.4 on a test having a mean of 66 and a
standard deviation of 11.
A) -1.6; unusual B) 1.6; not unusual C) -1.6; not unusual D) -
17.6; unusual
Construct a boxplot for the given data. Include values of the 5-
number summary in all boxplots.
60) The normal monthly precipitation (in inches) for August is
listed for 20 different U.S. cities. Construct a boxplot
for the data set.
0.4 1.0 1.5 1.6 2.0
2.2 2.4 2.7 3.4 3.4
3.5 3.6 3.6 3.7 3.7
3.9 4.1 4.2 4.2 7.0
A) B)
C) D)
29. Express the indicated degree of likelihood as a probability
value.
61) "It will definitely turn dark tonight."
A) 1 B) 0.5 C) 0.30 D) 0.67
Answer the question.
62) What is the probability of an event that is certain to occur?
A) 1 B) 0.95 C) 0.99 D) 0.5
63) What is the probability of an impossible event?
A) 0 B) -1 C) 1 D) 0.1
16
Find the indicated probability.
64) A bag contains 4 red marbles, 3 blue marbles, and 7 green
marbles. If a marble is randomly selected from the
bag, what is the probability that it is blue?
A) 3
14
B) 1
3
C) 1
7
D) 1
11
30. 65) A bag contains 2 red marbles, 3 blue marbles, and 5 green
marbles. If a marble is randomly selected from the
bag, what is the probability that it is blue?
A) 3
10
B) 1
3
C) 1
5
D) 1
7
66) A bag contains 6 red marbles, 3 blue marbles, and 5 green
marbles. If a marble is randomly selected from the
bag, what is the probability that it is blue?
A) 3
14
B) 1
3
C) 1
5
D) 1
11
67) Two 6-sided dice are rolled. What is the probability that the
sum of the two numbers on the dice will be 4?
31. A) 1
12
B) 2
3
C) 11
12
D) 3
68) Two 6-sided dice are rolled. What is the probability that the
sum of the two numbers on the dice will be 5?
A) 1
9
B) 5
6
C) 8
9
D) 4
69) Two 6-sided dice are rolled. What is the probability that the
sum of the two numbers on the dice will be 3?
A) 1
18
B) 1
2
C) 17
18
32. D) 2
Estimate the probability of the event.
70) Of 1232 people who came into a blood bank to give blood,
397 people had high blood pressure. Estimate the
probability that the next person who comes in to give blood will
have high blood pressure.
A) 0.322 B) 0.373 C) 0.29 D) 0.241
Answer the question, considering an event to be "unusual" if its
probability is less than or equal to 0.05.
71) Is it "unusual" to get a 12 when a pair of dice is rolled?
A) Yes B) No
72) Is it "unusual" to get 11 when a pair of dice is rolled?
A) Yes B) No
From the information provided, create the sample space of
possible outcomes.
73) Both Fred and Ed have a bag of candy containing a lemon
drop, a cherry drop, and a lollipop. Each takes out a
piece and eats it. What are the possible pairs of candies eaten?
A) LD-LD CD-LD LP-LP LD-CD CD-CD LD-LP LP-CD CD-LP
LP-LD
B) LD-CD LD-CD LD-CD LD-LP LD-LP LD-LP CD-LP CD-LP
CD-LP
C) CD-LD LD-LP LP-CD LP-LP LD-LD
D) LD-LD CD-LD LP-LP LD-LP CD-CD LD-LP LP-CD CD-LD
LP-LD
17
33. Answer the question.
74) In a certain town, 10% of people commute to work by
bicycle. If a person is selected randomly from the town,
what are the odds against selecting someone who commutes by
bicycle?
A) 9 : 1 B) 1 : 9 C) 9 : 10 D) 1 : 10
75) If an apple is hanging from a string and three flies land on
it, find the probability that all three are on points that
are within the same hemisphere.
A) 0.25 B) 4 C) 0.125 D) 0.333
Determine whether the events are disjoint.
76) Go to a formal dinner affair.
Wear blue jeans.
A) Yes B) No
Find the indicated complement.
77) The probability that Luis will pass his statistics test is 0.49.
Find the probability that he will fail his statistics test.
A) 0.51 B) 0.96 C) 0.25 D) 2.04
78) If a person is randomly selected, find the probability that
his or her birthday is not in May. Ignore leap years.
A) 334
365
B) 31
365
34. C) 31
334
D) 11
12
Find the indicated probability.
79) The table below describes the smoking habits of a group of
asthma sufferers.
Nonsmoker
Occasional
smoker
Regular
smoker
Heavy
smoker Total
Men 431 50 71 49 601
Women 382 48 86 39 555
Total 813 98 157 88 1156
If one of the 1156 people is randomly selected, find the
probability that the person is a man or a heavy smoker.
A) 0.554 B) 0.596 C) 0.511 D) 0.557
80) Of the 64 people who answered "yes" to a question, 6 were
male. Of the 70 people that answered "no" to the
question, 8 were male. If one person is selected at random from
the group, what is the probability that the
person answered "yes" or was male?
35. A) 0.537 B) 0.582 C) 0.094 D) 0.104
18
81) The manager of a bank recorded the amount of time each
customer spent waiting in line during peak business
hours one Monday. The frequency table below summarizes the
results.
Waiting Time
(minutes)
Number of
Customers
0-3 9
4-7 10
8-11 12
12-15 4
16-19 4
20-23 2
24-27 2
If we randomly select one of the customers represented in the
table, what is the probability that the waiting time
is at least 12 minutes or between 8 and 15 minutes?
A) 0.558 B) 0.651 C) 0.093 D) 0.727
82) A 6-sided die is rolled. Find P(3 or 5).
A) 1
3
36. B) 1
36
C) 1
6
D) 2
83) The table below describes the smoking habits of a group of
asthma sufferers.
Nonsmoker
Occasional
smoker
Regular
smoker
Heavy
smoker Total
Men 334 50 68 32 484
Women 357 30 89 37 513
Total 691 80 157 69 997
If one of the 997 people is randomly selected, find the
probability of getting a regular or heavy smoker.
A) 0.227 B) 0.100 C) 0.442 D) 0.157
Is Event B dependent or independent of Event A?
84) A: You cook your chicken improperly.
B: You get salmonella poisoning.
A) Dependent B) Independent
37. Find the indicated probability.
85) In one town, 66% of adults have health insurance. What is
the probability that 4 adults selected at random from
the town all have health insurance? Round to the nearest
thousandth if necessary.
A) 0.19 B) 2.64 C) 0.061 D) 0.66
86) A study conducted at a certain college shows that 65% of
the school's graduates find a job in their chosen field
within a year after graduation. Find the probability that 11
randomly selected graduates all find jobs in their
chosen field within a year of graduating. Round to the nearest
thousandth if necessary.
A) 0.009 B) 7.150 C) 0.169 D) 0.013
19
87) The table below describes the smoking habits of a group of
asthma sufferers.
Nonsmoker
Light
smoker
Heavy
smoker Total
Men 425 38 35 498
Women 381 32 43 456
Total 806 70 78 954
38. If two different people are randomly selected from the 954
subjects, find the probability that they are both
women. Round to four decimal places.
A) 0.2282 B) 0.2285 C) 0.000004809 D) 0.1595
Find the indicated probability. Round to the nearest thousandth.
88) A sample of 4 different calculators is randomly selected
from a group containing 18 that are defective and 40
that have no defects. What is the probability that at least one of
the calculators is defective?
A) 0.785 B) 0.774 C) 0.215 D) 0.180
Find the indicated probability. Express your answer as a
simplified fraction unless otherwise noted.
89) The following table contains data from a study of two
airlines which fly to Small Town, USA.
Number of flights
which were on time
Number of flights
which were late
Podunk Airlines 33 6
Upstate Airlines 43 5
If one of the 87 flights is randomly selected, find the
probability that the flight selected arrived on time.
A) 76
87
B) 43
39. 87
C) 11
76
D) None of the above is correct.
90) The following table contains data from a study of two
airlines which fly to Small Town, USA.
Number of flights
which were on time
Number of flights
which were late
Podunk Airlines 33 6
Upstate Airlines 43 5
If one of the 87 flights is randomly selected, find the
probability that the flight selected arrived on time given
that it was an Upstate Airlines flight.
A) 43
48
B) 43
87
C) 11
76
D) None of the above is correct.
20
40. 91) The table below describes the smoking habits of a group of
asthma sufferers.
Nonsmoker
Light
smoker
Heavy
smoker Total
Men 391 61 65 517
Women 312 72 80 464
Total 703 133 145 981
If one of the 981 subjects is randomly selected, find the
probability that the person chosen is a nonsmoker given
that it is a woman. Round to the nearest thousandth.
A) 0.672 B) 0.318 C) 0.444 D) 0.373
92) The table below describes the smoking habits of a group of
asthma sufferers.
Nonsmoker
Light
smoker
Heavy
smoker Total
Men 320 81 70 471
Women 374 76 87 537
41. Total 694 157 157 1008
If one of the 1008 subjects is randomly selected, find the
probability that the person chosen is a woman given
that the person is a light smoker. Round to the nearest
thousandth.
A) 0.484 B) 0.075 C) 0.142 D) 0.256
Evaluate the expression.
93) 9!
7!
A) 72 B) 2! C) 9
7
D) 63,000
94) 10P5
A) 30,240 B) 252 C) 2 D) 5
95) 7C3
A) 35 B) 70 C) 2 D) 24
96) 9C3
A) 84 B) 168 C) 3 D) 720
Solve the problem.
97) How many ways can an IRS auditor select 3 of 9 tax returns
for an audit?
A) 84 B) 504 C) 6 D) 729
98) The organizer of a television show must select 5 people to
participate in the show. The participants will be
42. selected from a list of 30 people who have written in to the
show. If the participants are selected randomly, what
is the probability that the 5 youngest people will be selected?
A) 1
142,506
B) 1
17,100,720
C) 1
120
D) 4
15
21
99) A tourist in France wants to visit 6 different cities. How
many different routes are possible?
A) 720 B) 6 C) 120 D) 36
100) A tourist in France wants to visit 8 different cities. If the
route is randomly selected, what is the probability that
she will visit the cities in alphabetical order?
A) 1
40,320
B) 1
8
C) 40,320 D) 1
64