
Recommended
Recommended
More Related Content
Recently uploaded
Recently uploaded (20)
Featured
Featured (20)
De defectos
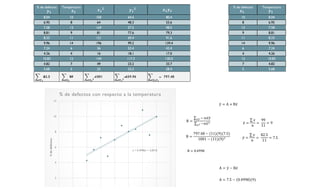
- 1. % de defectos Temperatura % de defectos Temperatura 8.04 10 100 64.6 80.4 10 8.04 6.95 8 64 48.3 55.6 8 6.95 7.58 13 169 57.5 98.5 13 7.58 8.81 9 81 77.6 79.3 9 8.81 8.33 11 121 69.4 91.6 11 8.33 9.96 14 196 99.2 139.4 14 9.96 7.24 6 36 52.4 43.4 6 7.24 4.26 4 16 18.1 17.0 4 4.26 10.83 12 144 117.3 130.0 12 10.83 4.82 7 49 23.2 33.7 7 4.82 5.68 5 25 32.3 28.4 5 5.68 82.5 99 1001 659.96 797.48 𝒙 𝟏 𝟐 𝒚 𝟏 𝟐 𝒙 𝟏 𝒚 𝟏𝒙 𝟏𝒚 𝟏 𝒙 𝟏 𝒀 𝟏 = 𝑿 𝟏 = 𝑿 𝟏 𝟐 = 𝒀 𝟏 𝟐 = 𝑿 𝟏 𝒀 𝟏 = y = 0.4998x + 3.0018 2 4 6 8 10 12 %dedefectos % de defectos con respecto a la temperatura 𝒚 𝟏 ത𝑦 = A + B ҧ𝑥 B = σ 𝑥𝑦 − 𝑛 ҧ𝑥ത𝑦 σ 𝑥2 −𝑛 ҧ𝑥2 ҧ𝑥 = σ 𝑥 𝑛 = 99 11 = 9 ത𝑦 = σ 𝑦 𝑛 = 82.5 11 = 7.5B = 797.48 − (11)(9)(7.5) 1001 − (11)(9)2 B = 0.4998 A = ത𝑦 − B ҧ𝑥 A = 7.5 − 0.4998 (9)
- 2. 0 0 2 4 6 8 10 12 14 16 Temperatura A = 3.0018