This document provides an overview of NoSQL databases. It begins by defining NoSQL and describing the flexible schema-less data models used. It then covers several common types of NoSQL databases - key-value stores, document stores, tabular stores, object data stores, and graph databases. For each type, it provides details on how data is structured and common operations. It also discusses Hive, which is a data warehouse tool for Hadoop, and database sharding techniques.
Comparative study of no sql document, column store databases and evaluation o...ijdms
In the last decade, rapid growth in mobile applications, web technologies, social media generating
unstructured data has led to the advent of various nosql data stores. Demands of web scale are in
increasing trend everyday and nosql databases are evolving to meet up with stern big data requirements.
The purpose of this paper is to explore nosql technologies and present a comparative study of document
and column store nosql databases such as cassandra, MongoDB and Hbase in various attributes of
relational and distributed database system principles. Detailed study and analysis of architecture and
internal working cassandra, Mongo DB and HBase is done theoretically and core concepts are depicted.
This paper also presents evaluation of cassandra for an industry specific use case and results are
published.
EVALUATION CRITERIA FOR SELECTING NOSQL DATABASES IN A SINGLE-BOX ENVIRONMENTijdms
In recent years, NoSQL database systems have become increasingly popular, especially for big data, commercial applications. These systems were designed to overcome the scaling and flexibility limitations plaguing traditional relational database management systems (RDBMSs). Given NoSQL database systems have been typically implemented in large-scale distributed environments serving large numbers of simultaneous users across potentially thousands of geographically separated devices, little consideration has been given to evaluating their value within single-box environments. It is postulated some of the inherent traits of each NoSQL database type may be useful, perhaps even preferable, regardless of scale. Thus, this paper proposes criteria conceived to evaluate the usefulness of NoSQL systems in small-scale single-box environments. Specifically, key value, document, column family, and graph database are discussed with respect to the ability of each to provide CRUD transactions in a single-box environment
The rising interest in NoSQL technology over the last few years resulted in an increasing number of evaluations and comparisons among competing NoSQL technologies From survey we create a concise and up-to-date comparison of NoSQL engines, identifying their most beneficial use from the software engineer point of view.
SURVEY ON IMPLEMANTATION OF COLUMN ORIENTED NOSQL DATA STORES ( BIGTABLE & CA...IJCERT JOURNAL
NOSQL is a database provides a mechanism for storage and retrieval of data that is modeled for huge amount of data which is used in big data and Cloud Computing . NOSQL systems are also called "Not only SQL" to emphasize that they may support SQL-like query languages. A basic classification of NOSQL is based on data model; they are like column, Document, Key-Value etc. The objective of this paper is to study and compare the implantation of various column oriented data stores like Bigtable, Cassandra.
What is NoSQL? How does it come to the picture? What are the types of NoSQL? Some basics of different NoSQL types? Differences between RDBMS and NoSQL. Pros and Cons of NoSQL.
What is MongoDB? What are the features of MongoDB? Nexus architecture of MongoDB. Data model and query model of MongoDB? Various MongoDB data management techniques. Indexing in MongoDB. A working example using MongoDB Java driver on Mac OSX.
HYBRID DATABASE SYSTEM FOR BIG DATA STORAGE AND MANAGEMENTIJCSEA Journal
Relational database systems have been the standard storage system over the last forty years. Recently,
advancements in technologies have led to an exponential increase in data volume, velocity and variety
beyond what relational databases can handle. Developers are turning to NoSQL which is a non- relational
database for data storage and management. Some core features of database system such as ACID have
been compromised in NOSQL databases. This work proposed a hybrid database system for the storage and
management of extremely voluminous data of diverse components known as big data, such that the two
models are integrated in one system to eliminate the limitations of the individual systems. The system is
implemented in MongoDB which is a NoSQL database and SQL. The results obtained, revealed that having
these two databases in one system can enhance storage and management of big data bridging the gap
between relational and NoSQL storage approach.
HYBRID DATABASE SYSTEM FOR BIG DATA STORAGE AND MANAGEMENTIJCSEA Journal
Relational database systems have been the standard storage system over the last forty years. Recently, advancements in technologies have led to an exponential increase in data volume, velocity and variety beyond what relational databases can handle. Developers are turning to NoSQL which is a non- relational database for data storage and management. Some core features of database system such as ACID have been compromised in NOSQL databases. This work proposed a hybrid database system for the storage and management of extremely voluminous data of diverse components known as big data, such that the two models are integrated in one system to eliminate the limitations of the individual systems. The system is
implemented in MongoDB which is a NoSQL database and SQL. The results obtained, revealed that having these two databases in one system can enhance storage and management of big data bridging the gap between relational and NoSQL storage approach.
Relational databases are a technology used universally that enables storage, management and retrieval of
varied data schemas. However, execution of requests can become a lengthy and inefficient process for
some large databases. Moreover, storing large amounts of data requires servers with larger capacities and
scalability capabilities. Relational databases have limitations to deal with scalability for large volumes of
data. On the other hand, non-relational database technologies, also known as NoSQL, were developed to
better meet the needs of key-value storage of large amounts of records. But there is a large amount of
NoSQL candidates, and most have not been compared thoroughly yet. The purpose of this paper is to
compare different NoSQL databases, to evaluate their performance according to the typical use for storing
and retrieving data. We tested 10 NoSQL databases with Yahoo! Cloud Serving Benchmark using a mix of
operations to better understand the capability of non-relational databases for handling different requests,
and to understand how performance is affected by each database type and their internal mechanisms.
Democratizing Fuzzing at Scale by Abhishek Aryaabh.arya
Presented at NUS: Fuzzing and Software Security Summer School 2024
This keynote talks about the democratization of fuzzing at scale, highlighting the collaboration between open source communities, academia, and industry to advance the field of fuzzing. It delves into the history of fuzzing, the development of scalable fuzzing platforms, and the empowerment of community-driven research. The talk will further discuss recent advancements leveraging AI/ML and offer insights into the future evolution of the fuzzing landscape.
Overview of the fundamental roles in Hydropower generation and the components involved in wider Electrical Engineering.
This paper presents the design and construction of hydroelectric dams from the hydrologist’s survey of the valley before construction, all aspects and involved disciplines, fluid dynamics, structural engineering, generation and mains frequency regulation to the very transmission of power through the network in the United Kingdom.
Author: Robbie Edward Sayers
Collaborators and co editors: Charlie Sims and Connor Healey.
(C) 2024 Robbie E. Sayers
Saudi Arabia stands as a titan in the global energy landscape, renowned for its abundant oil and gas resources. It's the largest exporter of petroleum and holds some of the world's most significant reserves. Let's delve into the top 10 oil and gas projects shaping Saudi Arabia's energy future in 2024.
Water scarcity is the lack of fresh water resources to meet the standard water demand. There are two type of water scarcity. One is physical. The other is economic water scarcity.
Student information management system project report ii.pdfKamal Acharya
Our project explains about the student management. This project mainly explains the various actions related to student details. This project shows some ease in adding, editing and deleting the student details. It also provides a less time consuming process for viewing, adding, editing and deleting the marks of the students.
Event Management System Vb Net Project Report.pdfKamal Acharya
In present era, the scopes of information technology growing with a very fast .We do not see any are untouched from this industry. The scope of information technology has become wider includes: Business and industry. Household Business, Communication, Education, Entertainment, Science, Medicine, Engineering, Distance Learning, Weather Forecasting. Carrier Searching and so on.
My project named “Event Management System” is software that store and maintained all events coordinated in college. It also helpful to print related reports. My project will help to record the events coordinated by faculties with their Name, Event subject, date & details in an efficient & effective ways.
In my system we have to make a system by which a user can record all events coordinated by a particular faculty. In our proposed system some more featured are added which differs it from the existing system such as security.
Welcome to WIPAC Monthly the magazine brought to you by the LinkedIn Group Water Industry Process Automation & Control.
In this month's edition, along with this month's industry news to celebrate the 13 years since the group was created we have articles including
A case study of the used of Advanced Process Control at the Wastewater Treatment works at Lleida in Spain
A look back on an article on smart wastewater networks in order to see how the industry has measured up in the interim around the adoption of Digital Transformation in the Water Industry.
Quality defects in TMT Bars, Possible causes and Potential Solutions.PrashantGoswami42
Maintaining high-quality standards in the production of TMT bars is crucial for ensuring structural integrity in construction. Addressing common defects through careful monitoring, standardized processes, and advanced technology can significantly improve the quality of TMT bars. Continuous training and adherence to quality control measures will also play a pivotal role in minimizing these defects.
Forklift Classes Overview by Intella PartsIntella Parts
Discover the different forklift classes and their specific applications. Learn how to choose the right forklift for your needs to ensure safety, efficiency, and compliance in your operations.
For more technical information, visit our website https://intellaparts.com
Hybrid optimization of pumped hydro system and solar- Engr. Abdul-Azeez.pdffxintegritypublishin
Advancements in technology unveil a myriad of electrical and electronic breakthroughs geared towards efficiently harnessing limited resources to meet human energy demands. The optimization of hybrid solar PV panels and pumped hydro energy supply systems plays a pivotal role in utilizing natural resources effectively. This initiative not only benefits humanity but also fosters environmental sustainability. The study investigated the design optimization of these hybrid systems, focusing on understanding solar radiation patterns, identifying geographical influences on solar radiation, formulating a mathematical model for system optimization, and determining the optimal configuration of PV panels and pumped hydro storage. Through a comparative analysis approach and eight weeks of data collection, the study addressed key research questions related to solar radiation patterns and optimal system design. The findings highlighted regions with heightened solar radiation levels, showcasing substantial potential for power generation and emphasizing the system's efficiency. Optimizing system design significantly boosted power generation, promoted renewable energy utilization, and enhanced energy storage capacity. The study underscored the benefits of optimizing hybrid solar PV panels and pumped hydro energy supply systems for sustainable energy usage. Optimizing the design of solar PV panels and pumped hydro energy supply systems as examined across diverse climatic conditions in a developing country, not only enhances power generation but also improves the integration of renewable energy sources and boosts energy storage capacities, particularly beneficial for less economically prosperous regions. Additionally, the study provides valuable insights for advancing energy research in economically viable areas. Recommendations included conducting site-specific assessments, utilizing advanced modeling tools, implementing regular maintenance protocols, and enhancing communication among system components.
Cosmetic shop management system project report.pdfKamal Acharya
Buying new cosmetic products is difficult. It can even be scary for those who have sensitive skin and are prone to skin trouble. The information needed to alleviate this problem is on the back of each product, but it's thought to interpret those ingredient lists unless you have a background in chemistry.
Instead of buying and hoping for the best, we can use data science to help us predict which products may be good fits for us. It includes various function programs to do the above mentioned tasks.
Data file handling has been effectively used in the program.
The automated cosmetic shop management system should deal with the automation of general workflow and administration process of the shop. The main processes of the system focus on customer's request where the system is able to search the most appropriate products and deliver it to the customers. It should help the employees to quickly identify the list of cosmetic product that have reached the minimum quantity and also keep a track of expired date for each cosmetic product. It should help the employees to find the rack number in which the product is placed.It is also Faster and more efficient way.
Final project report on grocery store management system..pdfKamal Acharya
In today’s fast-changing business environment, it’s extremely important to be able to respond to client needs in the most effective and timely manner. If your customers wish to see your business online and have instant access to your products or services.
Online Grocery Store is an e-commerce website, which retails various grocery products. This project allows viewing various products available enables registered users to purchase desired products instantly using Paytm, UPI payment processor (Instant Pay) and also can place order by using Cash on Delivery (Pay Later) option. This project provides an easy access to Administrators and Managers to view orders placed using Pay Later and Instant Pay options.
In order to develop an e-commerce website, a number of Technologies must be studied and understood. These include multi-tiered architecture, server and client-side scripting techniques, implementation technologies, programming language (such as PHP, HTML, CSS, JavaScript) and MySQL relational databases. This is a project with the objective to develop a basic website where a consumer is provided with a shopping cart website and also to know about the technologies used to develop such a website.
This document will discuss each of the underlying technologies to create and implement an e- commerce website.
1. UNIT 5
NoSQL Databases
WHAT IS NOSQL?
NoSQL (Not only Structured Query Language) is a term used to describe those
data stores that are applied to unstructured data.
The term “NoSQL” may convey two different connotations—one implying that
the data management system is not an SQL-compliant one, while other is “Not
only SQL,” suggesting environments that combine traditional SQL (or SQL-like
query languages) with alternative means of querying and access.
Schema-less Models: Increasing Flexibility for Data Manipulation-Key
Value Stores
NoSQL data systems hold out the promise of greater flexibility in database
management while reducing the dependence on more formal database
administration.
NoSQL databases have more relaxed modeling constraints, which may benefit
both the application developer and the end-user.
Different NoSQL frameworks are optimized for different types of analyses.
In fact, the general concepts for NoSQL include schemaless modeling in which
the semantics of the data are embedded within a flexible connectivity and
storage model;
This provides for automatic distribution of data and elasticity with respect to the
use of computing, storage, and network bandwidth in ways that don’t force
specific binding of data to be persistently stored in particular physical locations.
NoSQL databases also provide for integrated data caching that helps reduce data
access latency and speed performance.
The loosening of the relational structure is intended to allow different models to
be adapted to specific types of analyses
Types of NoSql
Key Value Stores
Document Stores
Tabular Stores
Object Data Stores
Graph Databases
2. KEY VALUE STORES
Key/value stores contain data (the value) that can be simply accessed by a given
identifier.
It is a schema-less model in which values (or sets of values, or even more
complex entity objects) are associated with distinct character strings called keys.
In a key/value store, there is no stored structure of how to use the data; the
client that reads and writes to a key/value store needs to maintain and utilize
the logic of how to meaningfully extract the useful elements from the key and the
value.
The key value store does not impose any constraints about data typing or data
structure—the value associated with the key is the value.
The core operations performed on a key value store include:
• Get(key), which returns the value associated with the provided key.
• Put(key, value), which associates the value with the key.
• Multi-get(key1, key2,.., keyN), which returns the list of values associated with
the list of keys.
• Delete(key), which removes the entry for the key from the data store.
Key value stores are essentially very long, and presumably thin tables. The keys
can be hashed using a hash function that maps the key to a particular location
(sometimes called a “bucket”) in the table.
The simplicity of the representation allows massive amounts of indexed data
values to be appended to the same key value table, which can then be sharded,
or distributed across the storage nodes.
Drawbacks of Key Value Store
One is that the model will not inherently provide any kind of traditional database
capabilities (such as atomicity of transactions, or consistency when multiple
transactions are executed simultaneously)—those capabilities must be provided
by the application itself.
Another is that as the model grows, maintaining unique values as keys may
become more difficult, requiring the introduction of some complexity in
generating character strings that will remain unique among a myriad of key.
DOCUMENT STORES
A document store is similar to a key value store in that stored objects are
associated (and therefore accessed via) character string keys. The difference is
that the values being stored, which are referred to as “documents,” provide some
structure and encoding of the managed data.
There are different common encodings, including XML (Extensible Markup
Language), JSON (Java Script Object Notation), BSON (which is a binary encoding
of JSON objects), or other means of serializing data.
3. Document stores are useful when the value of the key/value pair is a file and the
file itself is self-describing.
One of the differences between a key value store and a document store is that
while the former requires the use of a key to retrieve data, the latter often
provides a means (either through a programming API or using a query language)
for querying the data based on the contents.
TABULAR STORES
Tabular, or table-based stores are largely descended from Google’s original
Bigtable design to manage structured data.
The HBase model is an example of a Hadoop-related NoSQL data management
system that evolved from bigtable.
The bigtable NoSQL model allows sparse data to be stored in a three-
dimensional table that is indexed by a row key, a column key that indicates the
specific attribute for which a data value is stored, and a timestamp that may refer
to the time at which the row’s column value was stored.
OBJECT DATA STORES
In some ways, object data stores and object databases seem to bridge the worlds
of schema-less data management and the traditional relational models.
On the one hand, approaches to object databases can be similar to document
stores except that the document stores explicitly serializes the object so the data
values are stored as strings, while object databases maintain the object
structures as they are bound to object-oriented programming languages such as
C++, Objective-C, Java, and Smalltalk.
On the other hand, object database management systems are more likely to
provide traditional ACID (atomicity, consistency, isolation, and durability)
compliance—characteristics that are bound to database reliability.
Object databases are not relational databases and are not queried using SQL
GRAPH DATABASES
Graph databases provide a model of representing individual entities and
numerous kinds of relationships that connect those entities.
More precisely, it employs the graph abstraction for representing connectivity,
consisting of a collection of vertices (which are also referred to as nodes or
points) that represent the modeled entities, connected by edges (which are also
referred to as links, connections, or relationships) that capture the way that two
entities are related.
Graph analytics performed on graph data stores are somewhat different than
more frequently used querying and reporting.
4. HIVE
Hive is a data warehouse infrastructure tool to process structured data in
Hadoop. It resides on top of Hadoop to summarize Big Data, and makes querying
and analyzing easy.
Hive facilitates easy data summarization, ad-hoc queries, and the analysis of
large datasets stored in Hadoop compatible file systems.”
Hive is specifically engineered for data warehouse querying and reporting and is
not intended for use as within transaction processing systems that require real-
time query execution or transaction semantics for consistency at the row level.
Hive runs SQL like queries called HQL (Hive query language) which gets
internally converted to map reduce jobs.
The Hive system provides tools for extracting/ transforming/loading data (ETL)
into a variety of different data formats.
Initially Hive was developed by Facebook, later the Apache Software Foundation
took it up and developed it further as an open source under the name Apache
Hive.
It is used by different companies. For example, Amazon uses it in Amazon Elastic
MapReduce.
Features of Hive
• It stores schema in a database and processed data into HDFS.
• It is designed for OLAP.
• It provides SQL type language for querying called HiveQL or HQL.
• It is familiar, fast, scalable, and extensible.
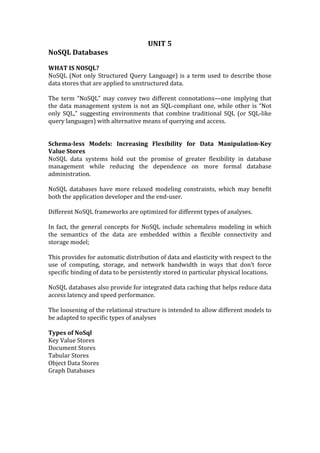
Architecture of Hive
The following component diagram depicts the architecture of Hive:
User Interface
Hive is a data warehouse infrastructure software that can create interaction
between user and HDFS. The user interfaces that Hive supports are Hive Web UI,
Hive command line, and Hive HD Insight (In Windows server).
Meta Store
Hive chooses respective database servers to store the schema or Metadata of
tables, databases, columns in a table, their data types, and HDFS mapping.
HiveQL Process Engine
HiveQL is similar to SQL for querying on schema info on the Metastore. It is one
of the replacements of traditional approach for MapReduce program. Instead of
writing MapReduce program in Java, we can write a query for MapReduce job
and process it.
5. Execution Engine
The conjunction part of HiveQL process Engine and MapReduce is Hive
Execution Engine. Execution engine processes the query and generates results as
same as MapReduce results. It uses the flavor of MapReduce.
HDFS or HBASE
Hadoop distributed file system or HBASE are the data storage techniques to
store data into file system.
Sharding
Sharding is a database architecture pattern related to horizontal partitioning —
the practice of separating one table’s rows into multiple different tables, known
as partitions. Each partition has the same schema and columns, but also entirely
different rows.
Database sharding is a type of horizontal partitioning that splits large databases
into smaller components, which are faster and easier to manage.
A shard is an individual partition that exists on separate database server
instance to spread load.
Auto sharding or data sharding is needed when a dataset is too big to be stored
in a single database.
As both the database size and number of transactions increase, so does the
response time for querying the database. Costs associated with maintaining a
huge database can also skyrocket due to the number and quality of computers
you need to manage your workload.
Data shards, on the other hand, have fewer hardware and software requirements
and can be managed on less expensive servers.
7. While directory based sharding is the most flexible of the sharding methods
discussed here, the need to connect to the lookup table before every query or
write can have a detrimental impact on an application’s performance.
HBASE
HBase is a nonrelational data management environment that distributes massive
datasets over the underlying Hadoop framework.
HBase is derived from Google’s BigTable and is a column-oriented data layout
that, when layered on top of Hadoop, provides a fault-tolerant method for
storing and manipulating large data tables.
Data stored in a columnar layout is amenable to compression, which increases
the amount of data that can be represented while decreasing the actual storage
footprint.
In addition, HBase supports in-memory execution. HBase is not a relational
database, and it does not support SQL queries.
There are some basic operations for HBase:
Get (which access a specific row in the table),
Put (which stores or updates a row in the table),
Scan (which iterates over a collection of rows in the table), and
Delete (which removes a row from the table).
Because it can be used to organize datasets, coupled with the performance
provided by the aspects of the columnar orientation, HBase is a reasonable
alternative as a persistent storage paradigm when running MapReduce
applications.
Features
Linear and modular scalability.
Strictly consistent reads and writes.
Automatic and configurable sharding of tables
Automatic failover support between RegionServers.
Convenient base classes for backing Hadoop MapReduce jobs with Apache
HBase tables.