Organic Name Reactions for the students and aspirants of Chemistry12th.pptx
Cbse report 2013
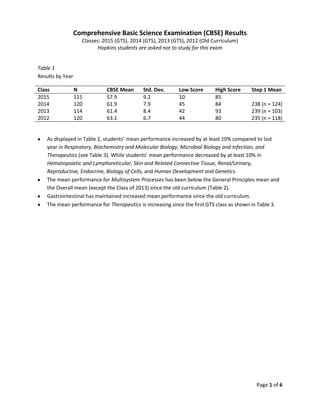
1. Comprehensive Basic Science Examination (CBSE) Results
Classes: 2015 (GTS), 2014 (GTS), 2013 (GTS), 2012 (Old Curriculum)
Hopkins students are asked not to study for this exam
Table 1
Results by Year
Class N CBSE Mean Std. Dev. Low Score High Score Step 1 Mean
2015 115 57.9 9.2 10 85
2014 120 61.9 7.9 45 84 238 (n = 124)
2013 114 61.4 8.4 42 93 239 (n = 103)
2012 120 63.1 6.7 44 80 235 (n = 118)
As displayed in Table 2, students’ mean performance increased by at least 10% compared to last
year in Respiratory, Biochemistry and Molecular Biology, Microbial Biology and Infection, and
Therapeutics (see Table 3). While students’ mean performance decreased by at least 10% in
Hematopoietic and Lymphoreticular, Skin and Related Connective Tissue, Renal/Urinary,
Reproductive, Endocrine, Biology of Cells, and Human Development and Genetics.
The mean performance for Multisystem Processes has been below the General Principles mean and
the Overall mean (except the Class of 2013) since the old curriculum (Table 2).
Gastrointestinal has maintained increased mean performance since the old curriculum.
The mean performance for Therapeutics is increasing since the first GTS class as shown in Table 3.
Page 1 of 6
2. Table 2
Comprehensive Basic Science Examination Performance Organized by Individual Organ Systems and
General Principles Item Topics
Genes to Society Curriculum Old Curriculum
Class of 2015 Class of 2014 Class of 2013 Class of 2012
# of Mean # of Mean # of Mean # of Mean
Topic Items Score Items Score Items Score Items Score
Individual Organ Systems
Hematopoietic and
11 41% 8 58% 9 43% 7 55%
Lymphoreticular
Central and Peripheral
21 56% 26 50% 22 55% 24 60%
Nervous
Skin and Related Connective
4 51% 5 75% 3 54% 8 54%
Tissue
Musculoskeletal 12 67% 10 73% 9 57% 14 54%
Respiratory 10 65% 19 54% 11 63% 13 68%
Cardiovascular 15 55% 13 55% 15 48% 13 61%
Gastrointestinal 13 61% 12 53% 12 53% 10 37%
Renal/Urinary 12 50% 12 63% 12 61% 14 51%
Reproductive 11 64% 14 78% 12 64% 11 55%
Endocrine 10 59% 8 69% 12 54% 10 56%
Immune 10 61% - - - - - -
Organ Systems Mean 129 57% 127 63% 117 55% 124 55%
General Principles
Biochemistry and Molecular
6 61% 11 43% 12 55% 13 51%
Biology
Biology of Cells 6 57% 6 76% 10 66% 7 55%
Human Development and
4 59% 4 74% 6 75% 6 46%
Genetics
Biology of Tissue Response to
4 57% 7 54% 6 67% 6 59%
Disease
Psychosocial, Cultural,
6 68% 8 64% 8 75% 5 72%
Occupational & Environ.
Multisystem Processes 6 37% 6 45% 4 60% 6 57%
Pharmacodynamic and
8 52% 10 55% 10 47% 7 63%
Pharmacokinetic Processes
Microbial Biology and
7 59% 7 42% 9 51% 10 64%
Infection
Immune Response - - 9 54% 12 58% 9 67%
Quantitative Methods 7 72% 5 72% 6 73% 7 85%
General Principles Mean 54 58% 73 58% 83 63% 76 62%
Overall Mean Performance 183 58% 200 60% 200 59% 200 59%
Page 2 of 6
3. Table 3
Comprehensive Basic Science Examination Performance Organized by Normal Processes, Abnormal
Processes, Principles of Therapeutics, and Psychosocial, Cultural, Occupational & Environmental
Considerations Impacting Disease Treatment and Prevention
Genes to Society Curriculum Old Curriculum
Class of 2015 Class of 2014 Class of 2013 Class of 2012
# of Mean # of Mean # of Mean # of Mean
Organ Systems Items Items Score Items Score Items Score Items Score
Normal
35 56% 41 61% 39 56% 38 53%
Abnormal
72 58% 61 63% 62 56% 58 57%
Therapeutics
14 58% 20 48% 11 42% 22 58%
Psychosocial, Cultural,
4 68% 5 68% 5 73% 6 69%
Occupational & Environ.
Figure 1: CBSE Mean Performance
64%
62%
60%
58%
Organ Systems Mean
General Principles Mean
56% Overall Mean Performance
54%
52%
50%
Class of 2015 Class of 2014 Class of 2013 Class of 2012
Page 3 of 6
4. Figure 2: CBSE Individual Organ Systems Performance
80%
70%
60%
50%
40%
30% Class of 2015
Class of 2014
20% Class of 2013
Class of 2012
10%
0%
Page 4 of 6
5. Figure 3: CBSE General Principles Performance
90%
80%
70%
60%
50%
40%
30%
Class of 2015
20% Class of 2014
10% Class of 2013
Class of 2012
0%
Page 5 of 6