1. Bull & Bear Markets
S&P/TSX Composite Index(CAD)
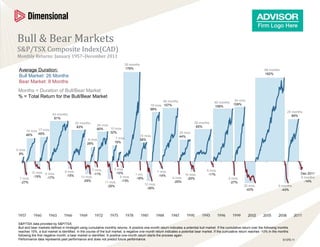
Monthly Returns: January 1957–December 2011
39 months
179%
Average Duration: 68 months
162%
Bull Market: 26 Months
Bear Market: 8 Months
Months = Duration of Bull/Bear Market
% = Total Return for the Bull/Bear Market
36 months 24 mos.
46 months
18 mos. 107% 109%
106%
99%
25 months
43 months 85%
81%
32 months 39 months
24 mos. 65%
63% 10 mos.
60%
19 mos. 17 mos. 32%
49% 25 mos.
46% 15 mos. 44%
9 mos. 7 mos. 38%
28% 19%
5 mos.
9%
7 mos. 3 mos. 5 mos.
12 mos. 6 mos. 8 mos. -10% 7 mos.
-11% 1 mo. 10 mos. -11% Dec 2011
-15% -15% 13 mos. 6 mos. -14%
7 mos. -17% -18% 4 mos. -20% 4 mos. 9 months
-27% -25% 11 mos. -13% -25% -27% -14%
12 mos. 25 mos.
-35% 9 months
-39% -43% -43%
S&P/TSX data provided by S&P/TSX.
Bull and bear markets defined in hindsight using cumulative monthly returns. A positive one-month return indicates a potential bull market. If the cumulative return over the following months
reaches 10%, a bull market is identified. In the course of the bull market, a negative one-month return indicates a potential bear market. If the cumulative return reaches -10% in the months
following the first negative month, a bear market is identified. A positive one-month return starts the process again.
Performance data represents past performance and does not predict future performance. S1375.11
2. Bull & Bear Markets
S&P 500 Index (CAD) 94 months
Monthly Returns: February 1951–December 2011 487%
Average Duration:
Bull Market: 42 Months
Bear Market: 11 Months
Months = Duration of Bull/Bear Market
% = Total Return for the Bull/Bear Market 71 months
303%
66 months
184%
50 months
119%
43 months
89% 30 months 9 mos. 36 mos.25 mos.
69% 73% 30 mos. 24 mos.
26 months 62% 62% 46 months
51% 53% 53%
46%
Cumulative to Date:
59 months, -16%
1 mo. 1 month
15 months 6 months 8 months 3 mos. -11% 10 mos. 4 months -11%
-15% -19% 19 months -11% -13% 3 months -16%
-15% Lowest Point to Date:
-32% 21 months -30% 31 months
-43% -42% 25 months, -42%
The S&P data are provided by Standard & Poor's Index Services Group.
Bull and bear markets are defined in hindsight using cumulative monthly returns. A bear market (1) begins with a negative monthly return, (2) must achieve a cumulative return
less than or equal to -10%, and (3) ends at the most negative cumulative return prior to achieving a positive cumulative return. All data points which are not considered part of
a bear market are designated as a bull market.
S1375.11
3. Bull & Bear Markets
S&P/TSX Composite Index (CAD)
Monthly Returns: February 1956–December 2011
Average Duration:
Bull Market: 58 Months Months = Duration of Bull/Bear Market
Bear Market: 11 Months % = Total Return for the Bull/Bear Market
137 months 81 months
286% 288%
61 months
253%
90 months
203%
68 months
168%
24 mos.
Dec 2011
109%
34 months
40 months 59%
82%
25 mos.
44%
16 mos.
20%
7 months 13 months 4 months 10 mos. 4 months
-25% 11 months 12 months -25% -20%
-27% -27% 25 months 9 months
-35% -39% -43% -43%
S&P/TSX data provided by S&P/TSX.
Bull and bear markets are defined in hindsight using cumulative monthly returns. A bear market (1) begins with a negative monthly return, (2) must achieve a cumulative return less than or equal
to -20%, and (3) ends at the most negative cumulative return prior to achieving a positive cumulative return. All data points which are not considered part of a bear market are designated as a
bull market.
S1375.11
4. Bull & Bear Markets
MSCI EAFE Index, Net Dividends (CAD)
Monthly Returns: January 1970–December 2011
37 months
Average Duration: 326%
Bull Market: 27 Months
Bear Market: 11 Months
Months = Duration of Bull/Bear Market
% = Total Return for the Bull/Bear Market
54 months
187%
72 months
157%
49 months
28 months 114%
95%
17 mos.
73%
7 months
46% 18 months
4 mos. 45%
26 mos. 5 mos.
16% 30% 26% 6 mos.
12%
7 months
5 mos. 9 mos. 4 months 4 months -10% 2 months
11 months 18 months 2 months
-13% -16% -15% -12% -14%
-18% -18% -16% 9 months
18 months -31% Lowest Point to Date:
36 months
-43% -47% 22 months, -46%
Cumulative to Date:
56 months, -34%
MSCI data copyright MSCI 2011, all rights reserved.
Bull and bear markets are defined in hindsight using cumulative monthly returns. A bear market (1) begins with a negative monthly return, (2) must achieve a cumulative return less than or equal
to -10%, and (3) ends at the most negative cumulative return prior to achieving a positive cumulative return. All data points which are not considered part of a bear market are designated as a bull
market.
S1375.11
5. Bull & Bear Markets
MSCI World Index, Net Dividends (CAD)
Monthly Returns: January 1970–December 2011
61 months
376%
Average Duration:
Bull Market: 44 Months
Bear Market: 14 Months
Months = Duration of Bull/Bear Market 94 months
% = Total Return for the Bull/Bear Market 282%
62 months
142%
33 months 46 months
69% 72%
9 mos. 18 mos.
50% 25 months 45%
33%
3 mos. 2 months
20 months 3 months 9 months
6 mos. -11% -11%
-15% -21% -25%
-22% 18 months 36 months Lowest Point to Date:
-42% -45% 25 months, -43%
Cumulative to Date:
59 months, -24%
MSCI data copyright MSCI 2009, all rights reserved.
Bull and bear markets are defined in hindsight using cumulative monthly returns. A bear market (1) begins with a negative monthly return, (2) must achieve a cumulative return less than or equal
to -10%, and (3) ends at the most negative cumulative return prior to achieving a positive cumulative return. All data points which are not considered part of a bear market are designated as a
bull market. S1375.11
Editor's Notes
Talking Points: This graph documents bull and bear market periods in the S&P/TSX Composite Index from January 1957 to December 2011. The market cycles are identified in hindsight using historical cumulative monthly returns. A bear market is identified in hindsight when the market experiences a negative daily return followed by a cumulative loss of at least 10%. The bear market ends at its low point, which is defined as the most negative cumulative return prior to achieving a positive cumulative return . A bull market is defined by data points not considered part of a bear market. All observations are performed after the fact. The rising trend lines in blue designate the bull markets occurring since 1957, and the falling trend lines in red document the bear markets. The bars that frame the trend lines help to describe the length and intensity of the gains and losses. The numbers above or below the bars indicate the duration (in months) and cumulative return percentage of the bull or bear market. Keep in mind that this graph does not show total compounded returns or growth of wealth since 1957. Once each cycle is established, the first month of that cycle resets the performance baseline to zero. Investors may draw a number of lessons from this graph. First, since 1957, bull markets in the S&P 500/TSX Composite Index have lasted longer than bear markets and delivered gains that are disproportionately greater than the bear market losses. Second, fluctuating performance within each trend illustrates that volatility and uncertainty occur even within established market cycles. The immediate trend is not readily apparent to market observers, and in fact, may become clear only in hindsight. This points to the difficulty of accurately predicting and timing market cycles. Finally, the graph suggests the importance of maintaining a disciplined investment approach that views market events and trends from a long-term perspective. Investors who react emotionally to short-term movements are at risk of making ill-timed decisions that compromise long-term performance.
Talking Points: This graph documents bull and bear market periods in the S&P 500 Index from February 1951 to December 2011. The market cycles are identified in hindsight, applying the same methodology as the other slides in the “Bull and Bear Markets” series. Monthly index returns are total returns, which include reinvestment of dividends
Talking Points: This graph documents bull and bear market periods in the S&P/TSX Composite Index from February 1956 to December 2011. The market cycles are identified in hindsight using historical cumulative monthly returns. These returns are total returns, which include reinvestment of dividends. All monthly observations are performed after the fact. This analysis applies the same methodology as the other slides in this series, but applies a higher cumulative net loss to a bear market definition. A bear market is identified in hindsight when the market experiences a negative monthly return followed by a cumulative loss of at least 20%.
Talking Points: This graph documents bull and bear market periods in the MSCI EAFE Index from January 1970 to December 2011. The market cycles are identified in hindsight using historical cumulative monthly returns. These returns consider the reinvestment of dividends, net of foreign government withholding taxes. All monthly observations are performed after the fact. A bear market is identified in hindsight when the market experiences a negative monthly return followed by a cumulative loss of at least 10%. The bear market ends at its low point, which is defined as the most negative cumulative return prior to achieving a positive cumulative return . A bull market is defined by data points not considered part of a bear market. The rising trend lines in blue designate the bull markets occurring since 1970, and the falling trend lines in red document the bear markets. The bars that frame the trend lines help to describe the length and intensity of the gains and losses. The numbers above or below the bars indicate the duration (in months) and cumulative return percentage of the bull or bear market. Keep in mind that this graph does not show total compounded returns or growth of wealth since 1970. Once the cycle is established in retrospect, the first month of that cycle resets the performance baseline to zero. Investors may draw a number of lessons from this graph. First, since 1970, bull markets in the MSCI EAFE Index have lasted longer than bear markets and delivered gains that are disproportionately greater than the bear market losses. Keep in mind, however, that this time series is relatively short. Second, fluctuating performance within each trend illustrates that volatility and uncertainty occur even within established market cycles: bull markets may have short-term dips, and bear markets may have short-term advances. The immediate trend is not readily apparent to market observers, and in fact, may become clear only in hindsight. This illustrates the difficulty of accurately predicting and timing market cycles. Finally, the graph suggests the importance of maintaining a disciplined investment approach that views market events and trends from a long-term perspective. Investors who react emotionally to short-term movements are at risk of making ill-timed decisions that compromise long-term performance.
Talking Points: This graph documents bull and bear market periods in the MSCI World Index from January 1970 to December 2011. The market cycles are identified in hindsight, applying the same methodology as the other slides in the “Bull and Bear Markets” series. Monthly returns consider the reinvestment of dividends, net of foreign government withholding taxes. The graph demonstrates the same principles as the previous data: Since 1970, bull markets in the MSCI World Index have lasted longer than bear markets and delivered gains that are disproportionately greater than the bear market losses. Index performance fluctuates, even within established market cycles Investors who maintain a disciplined investment approach may avoid making ill-timed decisions amidst the market volatility.