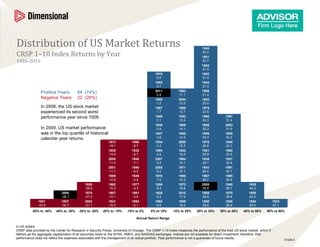
1. Distribution of US Market Returns 1949
CRSP 1–10 Index Returns by Year 20.2
1951
1926–2011 20.7
1963
21.0
1970 1982
0.0 21.0
1953 1944
0.7 21.3
2011 1993 1996
Positive Years: 64 (74%) 0.8 11.1 21.4
Negative Years: 22 (26%) 1960 2004 1983
1.2 12.0 22.0
In 2008, the US stock market 1987 1959 1979
experienced its second worst 1.7 12.7 22.6
performance year since 1926. 1948 1952 1998 1997
2.1 13.4 24.3 31.4
1939 1968 1955 2003
In 2009, US market performance 2.9 14.1 25.2 31.6
was in the top quartile of historical 1947 1965 1999 1985
calendar year returns. 3.6 14.5 25.3 32.2
1973 1966 1934 2006 1976 1936
-18.1 -8.7 4.3 15.5 26.8 32.3
1929 1932 1984 1942 1961 1980
-14.6 -8.7 4.5 16.0 26.9 32.8
2000 1940 2007 1964 1938 1927
-11.4 -7.1 5.8 16.1 28.1 33.4
2001 1990 2005 1971 1943 1991
-11.1 -6.0 6.2 16.1 28.4 34.7
1969 1946 1978 1986 1967 1995
-10.9 -5.9 7.5 16.2 28.7 36.8
1930 1962 1977 1956 1972 2009 1945 1935
-28.5 -10.2 -4.3 8.3 16.8 28.8 38.1 44.3
2008 1974 1957 1981 1926 2010 1989 1975 1958
-36.7 -27.0 -10.1 -3.6 9.2 17.9 28.9 38.8 45.0
1931 1937 2002 1941 1994 1992 1988 1950 1928 1954 1933
-43.5 -34.7 -21.1 -10.0 -0.1 9.8 18.0 29.6 38.9 50.0 57.1
-50% to -40% -40% to -30% -30% to -20% -20% to -10% -10% to 0% 0% to 10% 10% to 20% 20% to 30% 30% to 40% 40% to 50% 50% to 60%
Annual Return Range
In US dollars.
CRSP data provided by the Center for Research in Security Prices, University of Chicago. The CRSP 1-10 Index measures the performance of the total US stock market, which it
defines as the aggregate capitalization of all securities listed on the NYSE, AMEX, and NASDAQ exchanges. Indices are not available for direct investment; therefore, their
performance does not reflect the expenses associated with the management of an actual portfolio. Past performance is not a guarantee of future results. S1248.3
Editor's Notes
Talking Points: The table shows that the average value and small cap premiums in the US equity market have persisted over various performance periods. The higher relative returns reflect compensation for bearing higher risk, as indicated by higher standard deviation. The value premium is defined as the difference between the average returns of value stocks and growth stocks (value minus growth). Value is defined as the top 30% of NYSE stocks by book-to-market ratio (high-BtM stocks); growth is defined as the bottom 30% of the NYSE by BtM (low-BtM stocks). The small cap premium is defined as the difference between the average returns of small cap and large cap stocks (or small minus large). The size breakpoint for small and large is the median NYSE market equity (i.e., the bottom 50% for small and top 50% for large).