1. Missing Opportunity
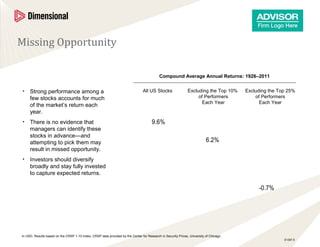
Compound Average Annual Returns: 1926–2011
• Strong performance among a All US Stocks Excluding the Top 10% Excluding the Top 25%
few stocks accounts for much of Performers of Performers
Each Year Each Year
of the market’s return each
year.
• There is no evidence that 9.6%
managers can identify these
stocks in advance—and
attempting to pick them may 6.2%
result in missed opportunity.
• Investors should diversify
broadly and stay fully invested
to capture expected returns.
-0.7%
In USD. Results based on the CRSP 1-10 Index. CRSP data provided by the Center for Research in Security Prices, University of Chicago.
S1397.5
Editor's Notes
Talking Points: This graph shows that a few outperforming stocks may account for a disproportionately large share of the US market’s return in a given year. From 1926 to 2011, the US stock market, as measured by the CRSP 1-10 Index, provided a 9.6% compound average annual return. If the top-performing decile of stocks were excluded each year, the market’s return would drop to 6.2% annualized. Excluding the top quartile of performers each year would reduce the market’s average annual return to -0.7%. Since it is impossible to reliably identify winners before the fact, the most prudent approach is to maintain broad diversification and consistent exposure within a particular asset class. This improves the likelihood that a portfolio will capture outperformance—wherever it may occur.