Beginners Guide to TikTok for Search - Rachel Pearson - We are Tilt __ Bright...
World Market Capitalization Hits $32.3 Trillion in 2011
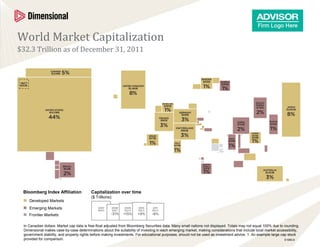
1. World Market Capitalization
$32.3 Trillion as of December 31, 2011
Bloomberg Index Affiliation Capitalization over time
($ Trillions):
Developed Markets
Emerging Markets
Frontier Markets
In Canadian dollars. Market cap data is free-float adjusted from Bloomberg Securities data. Many small nations not displayed. Totals may not equal 100% due to rounding.
Dimensional makes case-by-case determinations about the suitability of investing in each emerging market, making considerations that include local market accessibility,
government stability, and property rights before making investments. For educational purposes; should not be used as investment advice. 1. An example large cap stock
provided for comparison. S1060.6
Editor's Notes
Talking Points: This cartogram depicts the world not according to land mass, but by the size of each country’s stock market relative to the world’s total market value (free-float adjusted). Population, gross domestic product, exports, and other economic measures may influence where people invest. But the map offers a different way to view the universe of equity investment opportunities. If markets are efficient, global capital will migrate to destinations that offer the most attractive risk-adjusted expected returns. Therefore, the relative size and growth of markets may help in assessing the political, economic, and financial forces at work in countries. The cartogram brings into sharp relief the investible opportunity of each country relative to the world. It avoids distortions that may be created or implied by attention to economic or fundamental statistics, such as population, consumption, trade balances, or GDP. By focusing on an investment metric rather than on economic reports, the chart further reinforces the need for a disciplined, strategic approach to global asset allocation. Of course, the investment world is in motion, and these proportions will change over time as capital flows to markets that offer the most attractive returns. The countries we used this year are the same countries represented in the MSCI All Country World IMI Index and the MSCI Frontier Markets Index, with the exception of Saudi Arabia, which was added this year. While we used the same countries as in the MSCI Indices, we did not use the same list of stocks. This year’s map includes a greater representation of small cap stocks, particularly in the emerging and frontier countries, which explains the market capitalization fluctuations in countries such as Chile and Turkey as compared to last year. New this year, Israel has moved from being an emerging to a developed market; and Colombia, Egypt, and Peru have been added to the emerging markets where Dimensional invests. Some Dimensional emerging market strategies may not invest in all of the designated emerging markets.