1. Firm Romeo-T Performance Review
April 28, 2013
Presented by:
Alexander Garza
Josefa Meza-Garcia
Alicia Roemer
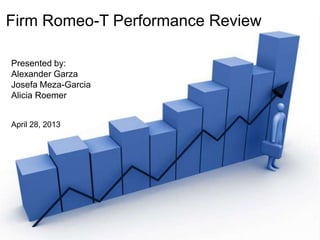
2. Overall Performance
2
Period 0 Period 1 Period 2 Period 3 Period 4 Period 5 Period 6 Period 7 Period 8
Share Price Index 1000 1113 1164 1130 1125 1158 919 671 765
0
200
400
600
800
1000
1200
1400
Price
Share Price Index
• Firm T ended in fourth place among our competitors.
• During this time, we launched two new products, TOPO in period
6 and was kept for the remainder of the simulation, and TOGA in
period 7 that was scrapped after one period.
• Our highest SPI came was during period 5.
•
3. Brand: TONE
• Launched in period 0, TONE was targeted to the High Earners
segment.
3
Period 0 Period 1 Period 2 Period 3 Period 4 Period 5 Period 6 Period 7 Period 8
Revenues 38,086 43,692 50,578 43,038 40,281 30,401 22,617 11,056 11,833
Cost of goods sold -21,322 -20,871 -21,959 -17,722 -18,709 -12,778 -9,628 -4,712 -5,929
Inventory holding costs 0 -2 0 -244 -143 -582 -183 -264 -6
Inventory selling costs 0 0 0 0 -610 0 0 0 -660
Contribution before marketing 16,764 22,819 28,618 25,072 20,820 17,041 12,806 6,080 5,239
Advertising media -1,920 -2,170 -1,250 -1,000 -2,500 -1,275 -1,249 -448 -1,275
Advertising research -80 -80 -1,250 -1,500 -500 -225 -225 -85 -225
Commercial team costs -612 -716 -943 -1,145 -1,408 -1,759 -1,850 -1,321 -1,377
Contribution after marketing 14,152 19,854 25,175 21,427 16,412 13,782 9,481 4,226 2,362
4. Brand: TOPS
• Launched in period 0 to originally target Explorers, we began
marketing more towards Shoppers because the Explorers
market was declining.
• Period 5 was our highest point
• Period 7 was our lowest point, due multiple releases of new
products in the market during period 6, we had to cut spending
costs on all products so as to not go into the negative.
• Changing our target audience helped us gain popularity, and
we remained close to the Shoppers needs throughout the
simulation.
4
Period 0 Period 1 Period 2 Period 3 Period 4 Period 5 Period 6 Period 7 Period 8
Revenues 13,975 13,980 10,915 19,010 26,774 40,623 17,268 7,968 15,022
Cost of goods sold -10,314 -8,335 -6,048 -9,226 -12,137 -16,479 -6,659 -3,141 -13,845
Inventory holding costs -319 -189 -307 0 0 -3 -646 -408 -9
Inventory selling costs 0 0 0 -767 0 0 0 0 -1,020
Contribution before marketing 3,342 5,457 4,560 9,017 14,637 24,141 9,963 4,419 149
Advertising media -1,920 -2,170 -1,500 -1,500 -2,500 -1,525 -1,666 -700 -1,296
Advertising research -80 -105 -1,000 -1,000 -450 -375 -300 -80 -230
Commercial team costs -612 -716 -685 -1,516 -1,734 -2,099 -2,065 -1,323 -1,462
Contribution after marketing 730 2,466 1,375 5,001 9,954 20,142 5,932 2,316 -2,839
5. Brand: TOPO
• Launched in period 6 to target the Savers segment
• By period 8, we had 9% of the Savers market purchasing our
product
5
Period 6 Period 7 Period 8
Revenues 8,101 6,223 14,348
Cost of goods sold -3,886 -3,257 -7,527
Inventory holding costs -600 -352 0
Inventory selling costs 0 0 0
Contribution before marketing 3,614 2,614 6,821
Advertising media -2,940 -667 -1,275
Advertising research -140 -126 -200
Commercial team costs -1,550 -1,323 -995
Contribution after marketing -1,016 499 4,352
6. Brand: TOGA
• TOGA was launched in period 7 in an effort to capture the
Explorers market.
• It was pulled due to dismal performance and to free up money
that could be allocated to more successful products in our line
up.
6
Period 7
Revenues 1,034
Cost of goods sold -1,171
Inventory holding costs -105
Inventory selling costs 0
Contribution before marketing -243
Advertising media -560
Advertising research -20
Commercial team costs -647
Contribution after marketing -1,470
7. Segment Performance
• Highest Point: Period 5
– Introduced new brand TOPO to capture the Shoppers market
• Lowest Point: Period 7
– Four new products were introduced this period, taking away a large percentage of
our market shares.
7
Period 0 Period 1 Period 2 Period 3 Period 4 Period 5 Period 6 Period 7 Period 8
Revenues 52,060 57,673 61,493 62,048 67,056 71,024 47,985 26,281 41,204
Cost of goods sold -31,636 -29,207 -28,008 -26,948 -30,846 -29,256 -20,173 -12,282 -27,301
Inventory holding costs -319 -190 -307 -244 -143 -586 -1,429 -1,129 -14
Inventory selling costs 0 0 0 -767 -610 0 0 0 -1,679
Contribution before marketing 20,105 28,276 33,179 34,089 35,457 41,182 26,383 12,871 12,210
Advertising media -3,840 -4,340 -2,750 -2,500 -5,000 -2,800 -5,855 -2,375 -3,846
Advertising research -160 -185 -2,250 -2,500 -950 -600 -665 -311 -655
Commercial team costs -1,224 -1,432 -1,628 -2,662 -3,142 -3,858 -5,465 -4,614 -3,833
Contribution after marketing 14,881 22,319 26,551 26,427 26,366 33,924 14,397 5,571 3,875
Market research studies -245 -411 -419 -428 -523 -495 -515 -491 -399
Research and development 0 0 -1,700 -1,030 0 -2,140 0 -930 0
Interests paid 0 0 0 0 0 0 0 0 0
Exceptional costs or profits 0 0 0 0 0 0 0 0 -263
Earnings before taxes 14,636 21,908 24,431 24,969 25,843 31,289 13,882 4,150 3,213
8. Markstrat: Lessons Learned
• Product Marketing Strategy - One brand per one customer segment
– Benefits:
• Fit specific customer's needs
• Avoid unclear brand positioning
• More accurate targeted advertising
• R& D projects
– Modify existing brands to improve product that fit customers
needs.
– Create new brands to target other potential growing segments
with lower competition.
• Look at the customer ideal points 2-3 periods ahead of time.
8
9. Markstrat: Lessons Learned
• Market research studies-Semantic scales and multidimensional
scaling
– Predict customer ideal perceptions for periods in the future
– Competitors
– Expansion
• Advertising - Build awareness for brand names and make
consumer familiar with the characteristics and price of your product.
– Reduce advertising media when awareness level is 75%.
– Budget needed to change customers perceptions and reach
good product positioning.
9
10. Looking Back
• We should be more adventurous and aggressive in our
strategies.
– Increase sales force during the first rounds.
– Invest on R&D during the first periods to enter growing
segments.
10
11. Marketing Management
• Segmentation/Targeting
– Changing customer preferences
• Product
– Product variety, Quality Design, Features , Brand name,
Packaging Sizes, Services, Warranties, Returns
• Price
– List price, Discounts, Allowances, Payment period, Credit
terms
• Place
– Channel, Coverage, Assortments, Locations, Inventory,
Transport
• Promotion
– Sales promotion, Advertising, Sales force, Public relations,
Direct marketing
11
13. Product
• Product Differentiation
• Company cost vs. customer value
• Changing trends and customer
preferences
• TONE’s ideal values decreased
• TOPS’ ideal values varied
13
14. Price
• Ideal price value
– Customers change
• Reference Pricing
– Competition has a higher price
• Price Quality Inferences
– Higher price = better quality?
– Becomes useless when cheapened with
price endings (period 1)
• Price Endings
– “Only 244.99!”
14
15. Place
• Specialty Stores vs Merchandising vs Online
• Is online retailing the future?
• Inventory ordering costs
• Stock-out
– Losing out because you don’t have enough to
sell
• Inventory holding costs
– Losing out because you didn’t sell
15
16. Promotion
• Advertising and Marketing
– Research vs. Media
– Research : Needs and wants in flux
– Maintaining awareness is just as
important as creating it.
16