
Recommended
Recommended
More Related Content
What's hot
What's hot (20)
Similar to F2104561
Similar to F2104561 (20)
More from aijbm
Recently uploaded
Recently uploaded (20)
F2104561
- 1. American International Journal of Business Management (AIJBM) ISSN- 2379-106X, www.aijbm.comVolume 2, Issue 10 (October 2019), PP 45-61 *Corresponding Author: David Augustine Bull www.aijbm.com 45 | Page Is Hospital Manager Leadership Adaptability Score related to Subordinate Job Satisfaction? David Augustine Bull, PhD., DBA. M.Sc., MBA. CALM Adjunct Faculty - School of Business American Intercontinental University *Corresponding Author: David Augustine Bull ABSTRACT:-The relationship between Managerial Leadership Adaptability Score and job satisfaction was investigated among 240 randomly selected subordinates, between the ages of 20 – 65 years, working in hospitals within the southern region of the United States. The Hersey’s perspective of the Situational Leadership®Model and Spector’s (1997) Job Satisfaction Scale were used in this investigation to obtain data for analysis. Results of the investigation revealed that the selling leadership style (S2 - 40%) and delegating leadership styles (S4 - 33.3%) were the dominant styles practiced by managers. However, multimodal managerial leadership styles were also identified (S1S2S3, S2S3, and S2S4). Participants considered contingent reward the most critical component of job satisfaction, while communications were considered the least. Sixty percent of the participants indicated that their managers had a low level of adaptability (LAS < 24). Conversely, 10 percent reported that their leader had a high level of adaptability (LAS > 30); and 30 percent said their leaders had moderate flexibility (LAS ≥24≤30). Keywords:-Dominant Leadership Style: Job Satisfaction: Situational Leadership: Leadership Adaptability. I. INTRODUCTION The role of managers in hospital operations is very critical, especially when it comes to day-to-day decision-making on the job. For managers to be active, managerial leadership styles must be built on a solid foundation that outlines a clear vision, mission, and operations strategies for the hospital. Leadership plays a crucial role in many professions including critical hospital jobs, where the need for qualified and experienced personnel is a high priority (Batista, Furtado, &Sila, 2011). In fact, Sfantou, Laliotis, Patelarou, Sifaki-Pistolla, Matalliotakis, and Patelarou (2017) noted that effective leadership of healthcare professionals is critical for strengthening quality and integration of care.To attract and keep such staff, hospital managers must secure employee job satisfaction, while at the same time, encourage trained and qualified candidates to come on board. Employee job satisfaction is critical for retention. Many studies are dealing with job satisfaction address mainly intrinsic and extrinsic job satisfaction, which comprise of many facets. Each of these facets is of varying importance to employees. As a result of this, many research studies on the subject yield mixed results. In this study, managerial leadership style is examined relative to job satisfaction of subordinates to advance recommendations that may be of significance to hospital managers and their staffers. Many pieces of research into the subject has been conducted in the area of leadership and job satisfaction, but very few studies into low job satisfaction are performed in the United States. Specifically, the researcher did not find any research conducted among hospital employees within the southern region of the United States that pertains to Situational Leadership® and job satisfaction. This gap in the literature about the relationship between Situational Leadership® and job satisfaction. In this study, the researcher used Situational Leadership® model as a conceptual framework to study the relationship between the four dimensions of managerial leadership styles (i.e., telling, selling, participating, and delegating) and low job satisfaction among hospital employees. The researcher hopes to help identify and bridge existing gaps in the literature, and as well as determine specific managerial leadership dimensions that either do or do not increase low job satisfaction. The purpose of this quantitative correlational research was to examine the relationship between Situational Leadership® and job satisfaction in hospitals located in the Southern region of the United States. A. Research Questions and Hypotheses The following research questions and hypotheses guided the study: RQ1: What is the relationship between the perceived managerial leadership adaptability score and the job satisfaction of subordinates located in the Southern region of the United States? H10: There is no significant relationship between perceived managerial leadership adaptability score and the job satisfaction of subordinates located in the Southern region of the United States. H1A: There is a significant relationship between perceived managerial leadership score and the job satisfaction of subordinates located in the Southern region of the United States.
- 2. Is Hospital Manager Leadership Adaptability Score related to Subordinate Job Satisfaction? *Corresponding Author: David Augustine Bull www.aijbm.com 46 | Page II. LITERATURE REVIEW A. Conceptual Framework In this study, the researcher drew solely upon Hersey’s perspective of the Situational Leadership® model. A. Situational Leadership® Model (SLM) Situational Leadership® contends that there is no one best way to influence people and that the most effective leadership style depends upon the performance readiness of the subordinates. The SLM describes four leadership dimensions (S1 – S4) with their associated follower readiness levels: Telling Leadership (S1: R1): A leadership style in which the leader demonstrates high directive behavior and little supportive behavior. For followers at Performance Readiness Level 1, the appropriate leadership style is telling. This style consists of above average amounts of task behavior and below average numbers of relationship behavior. Selling Leadership (S2: R2): A leadership style in which is the leader shows high directive behavior and high supportive behavior. For followers at Performance Readiness Level 2, the appropriate leadership style is selling. In this style, the leader uses above average amounts of both task and relationship behavior. The task behavior is to provide direction for the lack of skill, and the relationship behavior is to reinforce the individual for trying. Participating Leadership (S3:R3): A leadership style in which the leader exhibits little directive behavior and high supportive behavior. The appropriate leadership style for Performance Readiness Level 3 is called participating, which incorporates above average amounts of relationship behavior with below average l3amounts of task behavior. People at R3 not only know what, when, how, and where to do things, but also why they need to be doing those things; the level of lack either confidence or willingness to go ahead and do them. The high relationship behavior is designed to encourage them to develop that willingness or courage to perform on their own. Delegating Leadership (D4: R4): A leadership style in which the leader demonstrates little directive behavior and little supportive behavior. The appropriate method for Performance Readiness Level 4 is called delegating, which uses below average amounts of both relationship and task behavior. These individuals know what, how, where, and when to do their jobs, and have the willingness and confidence to accomplish the tasks. It is essential at this stage to reward those efforts with increased autonomy and decreased relationship behavior because independence at this stage is viewed as a reward. At the same time, while the high relationship behavior would be seen by the follower as patronizing. Hersey argued that the matching of the appropriate managerial leadership style to the appropriate readiness level of the subordinate might yield practical results, including employee productivity and performance. Let us examine some of these studies. Managerial Leadership Styles and Job Satisfaction Studies Many researchers have used the SLM as a conceptual framework to study organizational science and other areas of academia (Bodla& Hussain, 2010; Hersey et al. 2013; Jackson, Alberti & Snipes, 2014). For example, Mohamed et al. (2016) conducted a quantitative study to investigate senior teachers' readiness for applying the Situational Leadership® model to classroom instruction. The primary purpose of the study was to examine how faculty at California State University employed leadership strategies to transform their students, teams, and organization. Mohamed identified participants’ perceptions of their leadership styles across 12 situations as outlined in the LEAD instrument. The researcher identified the primary leadership style as the Selling style (S2), amounting to 38% of the sample population. Mohamed et al. then found out that Participating style (S3) was the second most common leadership style with responses amounting to 37% of the total survey answers. The third and fourth most popular responses were telling (S1), which received 19% and delegating style (S4) which received 6% of the total survey answers respectively. Mohamed et al. 's findings were similar to that of Bull (2010). In both studies, leadership played a critical role in shaping the behavior as perceived by the participants. Bull studied Situational Leadership® with employee turnover intent among hospital employees. Turnover among employees correlates with job dissatisfaction in most cases. Bull found out that selling leadership was the most prominent leadership style displayed by managers, followed by participating. The study also revealed that managers had moderate leadership adaptability score, a pattern common among managers in the United States. Mohamed et al. 's study showed that the leadership style adaptability score of the participants was 23, which fell within the low range of (0 – 23). Tsai and Su (2011) showed a positive correlation among managerial leadership styles, job satisfaction, and service-oriented organizational citizen behaviors (OCBs), with leadership styles having a stronger influence on job satisfaction. In another study, Arnold and Ukpere (2012) examined the Situational Leadership® model for appraising employees' readiness within a Solidarity trade union in South Africa. Although the authors found results that were consistent with the Situational Leadership® model, they reported that not all subordinates were insecure as the model depicted. The Arnold and Ukpere report created a controversy in literature and required
- 3. Is Hospital Manager Leadership Adaptability Score related to Subordinate Job Satisfaction? *Corresponding Author: David Augustine Bull www.aijbm.com 47 | Page further studies to clear the controversy about the insecurity of the subordinates. The SLM depicts that the most effective manager is one who remains versatile along the performance curve in the model. Many organizations prioritize the need to develop effective managers in terms of their leadership styles (Roberts, 2015). Jackson et al. (2014) reported that management roles have effects on employee job satisfaction and workplace behaviors. The authors revealed that ineffective display of managerial roles has led to employee dissatisfaction and turnover. In response, consultants have stepped forward to assist in the process of developing effective managers; a move that has helped alleviate the shortages of qualified and experienced workers in many organizations. Arayesh and Noori (2012) suggested that employee-oriented managerial leadership style such as participatory leadership has scored high among employees, simply because it helps them feel they are part of the organization. This sense of belonging promotes job satisfaction and employee productivity. In another study, Arayesh and Noori (2012) investigated the relationship between participatory management and employees’ productivity and satisfaction using a descriptive survey among 37 staff members of the Agricultural Extension Management of Ilam Province, Iran. The authors found that there was a significant relationship between the variables of participatory management and employees' productivity. Specifically, Arayesh and Noori showed that variables such as increasing responsibility, increasing innovation, reduction of administration costs, and increasing efficiency were able to explain 99% of the variation among employees in terms of productivity and job satisfaction. Job Satisfaction Many researchers agree that managerial leadership and job satisfaction are significant predictors for organizationally relevant behavior such as employee turnover (Baig et al., 2013; Bilal, Mansoor, & Rehman, 2012; Kaladeh, 2013; Pantouvakis&Bouranta, 2013). However, employees do not quickly turn over. There is a temporal lag between elements of job dissatisfaction, low organizational commitment, intention to quit, perceived alternatives, ease of movement, and actual separation (Taplin & Winterton, 2007). Taplin and Winterton admonished that the link between dissatisfaction and turnover is very complicated, given the fact that dissatisfaction with work does not always immediately lead workers to quit. Bilal et al. (2012) argued that a dissatisfied employee might leave at any time given the slightest opportunity of a better job elsewhere. To help mitigate employee dissatisfaction, leaders need to deploy effective leadership styles to help alleviate turnover issues. Bormann (2013) reported that effective leadership in individual nursing units directly affects the nursing staff's job satisfaction. Ahmad, Nazir, Adi, Noor, Ghafar, Rahman, and Yushuang(2013) shared Borman’s view and suggested that managers should spend more time on activities to enhance employee satisfaction. Ahmad et al.’s findings were also consistent with that of Koc (2011). Koc examined the impact of managers’ leadership behavior on job satisfaction and performance of 266 employees in an industrial zone in Ankara Ostim, Turkey. Results of the study revealed a significant relationship between managers' leadership behaviors, job satisfaction, and performance of employees. In the same study, the authors reported a positive relationship between job satisfaction and job performance of employees. Researchers have shown that employees who experience job satisfaction are more likely to be productive and stay on the job (Ahmad, Hussain, & Tariq, 2014; Ayob, Lo, Ngui, &Voon, 2011; Kaladeh, 2013; Koc, 2011; Malik, 2013). Most employees would instead take another opportunity than stay dissatisfied on a job. In most cases, inappropriate application of managerial leadership styles has resulted in employee dissatisfaction and subsequent turnover. Parveen and Tariq (2014) studied 350 faculty members in nine universities and revealed that the leadership style of department heads had a significant effect on job satisfaction of faculty members. The authors acknowledged that selling leadership style was the preferred method for department heads to make a decision. In addition to selling leadership style, the leaders of departments in all the universities studied also reported they used participating leadership style. The telling and delegating leadership styles were almost non-existent among faculty heads and were not preferred leadership styles in decisionmaking. Ahmad et al. (2010) examined the relationship between job satisfaction, attitude towards work, and organizational commitment among 310 employees of 15 advertising agencies of Islamabad, Pakistan. The results revealed a weak association between job satisfaction and performance, whereas they found that organizational commitment had a strong positive relationship with performance. The authors also found that employee attitude towards work had a strong positive correlation with job satisfaction. In a similar study, Eka, Hadiwidjojo, &Slamet (2013) examined the influence of Situational Leadership® on job satisfaction among 444 employees in the Trans Jakarta public service agency in Indonesia. The authors found out that Situational Leadership® and job satisfaction can directly improve job performance. Contrary to the Eka, et al.’s (2013) study, Ahmad et al. (2010) discovered that organizational commitment had an insignificant impact on job satisfaction and attitude towards work. MosadeghradandFerdosi (2013) examined the
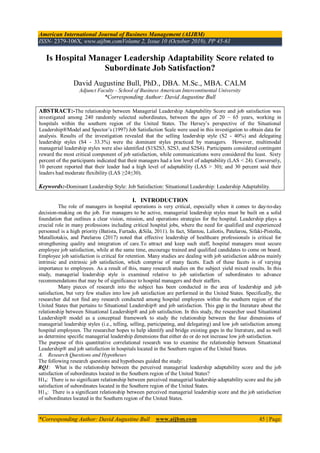
- 4. Is Hospital Manager Leadership Adaptability Score related to Subordinate Job Satisfaction? *Corresponding Author: David Augustine Bull www.aijbm.com 48 | Page relationships between leadership behaviors of managers and variables of job satisfaction and organizational commitment at public hospitals in Iran. The authors revealed that the dominant leadership style of hospital managers was participative style, and employees were moderately satisfied with their jobs and committed to their organization. Salaries, benefits, promotion, contingent rewards, interpersonal relationships, and working conditions were the best predictors of job satisfaction among hospitals employees. Leadership, job satisfaction, and commitment were closely interrelated. III. METHODOLOGY The researcher adopted a non-experimental correlational research design to explore the relationship between Situational Leadership® style and low job satisfaction. A. Population and Sample Selection The sample population consisted of subordinates from participating hospitals. The hospitals were widely distributed geographically within the southern region of the United States. The respondents were full- time employees between the age of 18 and 60 years old. The researcher assumed that in this age range, employees were able to make reliable decisions on different issues they faced. To determine the appropriate sample sizes for a given population under study, researchers have developed various methods, such as and Power Analysis (Cohen, 1992). Approximately 6,000 full-time employees are working in general and behavioral hospitals in the southern region of the United States. In this study, the researcher targeted four hospitals, which had 690 employees, all of whom the researcher invited to participate in the study, which made it possible for the researcher to achieve a sufficient sample size. For inferential testing, a researcher must consider three items: Type I errors, Type II errors, and estimated effect size. Type I errors occur when the researcher rejects the null hypothesis when it is true (Neuman, & Robson, 2015). In this study, the researcher set the Type I error at α = .05. Type II errors occur when the researcher accepts the null hypothesis even though it is false (Neuman & Robson 2015). In this study, the research set the Type II error at β = .80. Regarding effect size, the researcher reviewed other academic studies to determine the estimated effect size consistent with other studies. Based on a meta-analysis of these studies, the researcher set the estimated effect size of r = .18. Using G*Power (Faul, Erdfelder, Lang, & Buchner, 2009), an = .05, a β = .80, and estimated r = .18, a sample size of 239 was determined. (See figure 1 below) Figure 1: Result of the G* Power analysis for sample size selection (Faul, Erdfelder, Lang, & Buchner, 2009)
- 5. Is Hospital Manager Leadership Adaptability Score related to Subordinate Job Satisfaction? *Corresponding Author: David Augustine Bull www.aijbm.com 49 | Page B. Instrumentation The researcher used a demographic questionnaire and two survey instruments: the LEAD – Other surveys, Spector's (1997) Job Satisfaction Scale, and demographic survey. In this study, the researcher did not measure the conditional variable of subordinate performance readiness and psychological willingness to perform a specific task. The purpose of the demographic survey questionnaire was to solicit specific demographic information from the sample population: Gender, measured on a nominal scale Age, measured on an ordinal scale Ethnicity, measured on a nominal scale Education, measured on an ordinal scale. The demographic data was collected and reported for evaluation of subsequent research, not for hypothesis testing. 1)LEAD – Other Instrument The LEAD – Other instrument consists of 12 management situations in which subordinates identified from among four options their perceptions of their supervisor's leadership style. Using the LEAD – Other instrument enabled the researcher to determined subordinate's perceptions of their supervisor’s dominant leadership style and leadership adaptability. The ideal leadership would be an effective combination of all four managerial leadership styles. However, many managers may only have a multimodal leadership profile. Respondents were instructed to select the answer that most closely matched how they think their supervisors would typically respond in a given situation. The researcher calculated the dominant leadership style by adding the number of selection in each category. The leadership style with the most responses was the dominant leadership style of the supervisor. The degree to which an individual's leadership behaviors are appropriate to the demands of a given situation is known as style adaptability. The researcher awarded adaptability points for each case, giving three points for choosing the proper leadership style and smaller scores for moving farther away from the appropriate choice. Therefore, a score of 30 - 36 range indicates a leader with a high degree of adaptability; 24 - 29 range reflects a moderate degree of flexibility; and if the adaptability is less than 24, it demonstrates the need for self- development to recognize subordinate performance readiness (Center for Leadership Studies, 2016). Numerous research studies have used the LEAD – Other with proven validity (Hersey et al., 2013). Aichia and Hui (2007) used the LEAD instrument to determine the dominant leadership styles of principals in private and public schools and their effects on teacher turnover in Taiwan. Additionally, Greene (1980) reported that the LEAD instrument is valid and remains stable across time as a useful tool to measure leadership styles. Greene, therefore, suggested that a user might rely on the results as a consistent indicator of an individual's leadership style. 2) Job satisfaction scale.Many researchers have usedSpector’s (1997) job satisfaction scale with proven consistency (Astrauskaite, Perminas, &Vaitkevicius, 2011; Meade, Thompson, & Watson, 2007). The Job Satisfaction Scale is a 36item scale, which measures subordinate attitudes nine facets of their job. The nine aspects are pay, promotion, supervision, fringe benefits, contingent rewards, operating procedures, coworkers, nature of work, and communication (Spector, 1997). Four survey statements or items asses each facet and the researcher computed a total score from all survey items. The Job Satisfaction Scale has a summated rating scale format with six choices per item ranging from “strongly disagree” to “strongly agree.” Given the Job Satisfaction Scale uses 6-point agree-disagree response choices, we can assume that agreement with positively worded items, and disagreement with negatively worded items would represent satisfaction, whereas conflict with positive-worded items and agreement with negative- worded items represents dissatisfaction. For the 4-item subscales, as well as the 36-item total score, this means that counts with a mean item response (after reverse scoring the negatively worded items) of 4 or more represent satisfaction, whereas mean responses of 3 or less represent dissatisfaction. Mean scores between 3 and 4 are ambivalence. The researcher wrote items in both directions, so about one-half of the questions were reverse scored, and he used the 36-item scores to interpret the scale. C. Validity of Instruments Researchers compare different scales on the same test subjects to demonstrate an instrument's efficacy (Spector, 1997). Hersey et al. (2013) have reported the validity of the LEAD instrument over the years in several studies and have suggested that researchers can rely on this instrument for its consistency. Greene (1980) confirmed the logical validity of the LEAD instrument among a sample of 264 managers in North America. The instrument scores remained relatively stable across time. Many researchers have reported the efficacy of Spector's (1997) Job Satisfaction Scale (Astrauskaite et al., 2011; Dwyer, Jex, & Spector, 1988; Meade et al., 2007). Spector disclosed that his job satisfaction scale had correlated well with other job satisfaction scales (e.g., Job Descriptive Index) ranging from 0.61 for Co-workers to 0.80 for supervision, on subscales like pay,
- 6. Is Hospital Manager Leadership Adaptability Score related to Subordinate Job Satisfaction? *Corresponding Author: David Augustine Bull www.aijbm.com 50 | Page promotion, supervision, Co-workers, and nature of work. In another study, Dwyer et al. (1988) asked supervisors to estimate the job satisfaction of their subordinates. The correlation was 0.54 between incumbents and supervisors, suggesting that supervisors were aware of the feelings of their subordinates towards the job. Based on their studies, Meade et al. (2007) have also maintained that Spector’s (1997) Job Satisfaction Scale is valid. D. Reliability Reliability is the extent to which an experiment, test, or any measuring procedure is replicable and yields the same result with repeated trials (Neuman & Robson, 2015). Spector (1997) states that two types of reliability are essential for evaluating survey instruments: (a) internal consistency reliability estimates, which measures how well items on a scale related to one another, and (b) test-retest reliability, which reflects the stability of a scale over time. Caldwell, Marshall, and Walter (1980) indicated that the educational version of the LEAD had proven validity and reliability. To establish credibility, the authors asked 26 elementary school principals to respond to the LEAD. The results were that two measures of internal consistency yielded reliability coefficients of .810 and .613. Spector (1997) reported the internal consistency for the job satisfaction scale in terms of Alpha Coefficient and Test-Retest Reliability Scores. The Spector's (1997) job satisfaction scale has shown moderate to substantial reliability coefficient reliability over the years (Batura, Skordis-Worrall, Thapa, Basnvat, & Morrison, 2016; Paul & Seok, 2011). E. Data Collection Procedures Permission was sort and granted for the study. Participating hospitals helped provide a list of full-time nonmanagerial employees, training, obtaining informed consent, and distribution survey packages. The researcher provided his telephone number to each participant if they want to exit the study or have further questions. Human resources offices distributed paper surveys to participants. Before accessing the survey, participants read and signed the informed consent form. Those who participated in the study returned the completed questionnaires to the human resource office within two weeks of receipt of the survey packets. The researcher stored the collected data in SPSS 24 for analysis. 1)Descriptive Data Analysis To provide insight into the demographics of the sample population, the researcher will report statistics such as mean, median, and standard deviation for each demographic item which may help in sample analysis development. 2)Reliability Analysis Since this research involves measuring unobservable, latent variables (e.g., job satisfaction), reliability analysis of survey instruments was performed. For each survey instrument, the researcher will calculate the Cronbach’s alpha (α) for each instrument. According to Gliem and Gliem (2003), an α > .70 is considered an acceptable level. 3)Exploratory Data Analysis Once the reliability analysis is concluded, variables will be formed by collapsing items in each survey instrument. For the JSS instrument, ten scales will be created: an overall scale, consisting of Item 1-36, and nine subscales. Once the variables were formed, two tests were performed: Test of Outliers, and Test of Normality. For the LEAD – Other instrument, responses to each situation (1 – 12) will be converted from AD to 0 – 3 based on guidance provided. Once the alpha-to-numeric coding is completed, two mathematical functions were performed. First, all LEAD – Other responses were summed to form the Leadership Adaptability Score. Second, the four leadership styles were counted to identify the Dominant Leadership Style. If no one leadership style was identified, a special multi-modal category was created. 4) Test of Outliers Outliers in data can influence the placement and dispersion of the mean (Leedy& Ormrod, 2013). Outliers can be caused for many reasons (e.g., survey fatigue, survey disinterest, and data entry error). A researcher must evaluate outliers because it could influence the results in hypothesis testing. To identify outliers, the researcher will use a boxplot (See figure 2). A box plot is a method for graphically depicting groups of numerical data and display variations in a sample of the statistical population with any assumptions of underlying statistical distribution (Babbie, 2015). If outliers are detected, the researcher will evaluate each outlier to determine whether the record will be retained or removed. Summary of analysis • JSS • Contingent Reward – M/SD =5.03(.33) • Communication – M/SD = 3.33(.25) • 4 outliers in Coworker scale; records retained • Data not normally distributed (K-S Test p< .001 for all scales) • Nonparametric inferential testing would occur
- 7. Is Hospital Manager Leadership Adaptability Score related to Subordinate Job Satisfaction? *Corresponding Author: David Augustine Bull www.aijbm.com 51 | Page (See boxplot below) Figure 2: Boxplot for JSS Subgroups (Spector 1997) i) Test of Normality.Some statistical tests require data to be normally distributed. As a result, a researcher must evaluate the distribution of variables. The researcher used the Kolmogoroff-Smirnov (K-S) test to evaluate the distribution of each variable. If variables used in hypothesis testing are not normally distributed, nonparametric tests will be used for hypothesis testing. If the variables are normal, then parametric tests will be performed (Babbie, 2015). H. Hypothesis Testing The first research question focused on the relationship between leadership adaptability and job satisfaction. If both variables are normally distributed, the Pearson Product-Moment Correlation Coefficient (r) was used to measure the relationship. However, if either variable are not normally distributed, the non- parametric Spearman’s Rank-Order Correlation Coefficient (rs) will be used as the measure of the relationship. Spearman differs from Pearson as it doesn’t use the actual values; instead, it uses the ranked order of values (Neuman & Robson, 2015). The second research question focuses on examining the differences in job satisfaction based on the dominant leadership style. If the job satisfaction variable is normally distributed, an Analysis of Variance (ANOVA) was used to measure the differences in job satisfaction based on style. However, if the job satisfaction variable is not normally distributed, then the nonparametric Kruskal-Wallis (K-W) H test will be being used to measure the differences. The significance level for the study was α = 0.05, and the research results were significant when the p-value was less than the alpha value. Test values are highly significant when the p-values are less than 0.01 (Greenland, Senn, Rothman, Carlin, Poole, Goodman, & Altman, 2016), which shows that sufficient evidence exists to support the alternative hypothesis.
- 8. Is Hospital Manager Leadership Adaptability Score related to Subordinate Job Satisfaction? *Corresponding Author: David Augustine Bull www.aijbm.com 52 | Page IV. RESULTS Survey packets to all 690 employees were administered via the human resources departments of the participating hospitals, thus enabling 100% contact with the target population. The researcher received 258 survey responses, which represents a 37.4% response rate. Eighteen survey responses were discarded due to failure to properly complete the informed consent form or not completing both instruments. TABLE 1 shows the distribution of demographic characteristics of supervisors starting with age distribution. The age group (20 – 30) years had 75/240 (31.3%) of the participants; (31 – 41) had more participants 97/240 (40.4%); age group (42 – 52) years 64/240 (26.7%); and the age group 53 –63 had the least number of participants 4/240 (1.6%). Table 1. Demographic characteristics of participants Demographics characteristics n % Age 20 – 30 31 – 41 42 – 52 53 – 63 Gender Male Female Educational level High school Associates Bachelors Masters Doctorate Experience in years 0 – 4 5 – 10 11 – 16 ˃ 16 75 97 64 4 98 142 100 90 42 8 - 81 125 32 2 31.3 40.4 26.7 1.6 40.8 59.2 41.7 37.5 17.5 3.3 - 33.8 52.1 13.3 0.8 The next demographic variable was gender. There were more female respondents 142/240 (59.2%) than males 98/240 (40.8%). Regarding the educational level of participants, 79.2 % of the participants had high school diplomas or had earned an Associate Degree. Out of the 20.8% remaining, 17.5% had a bachelor’s degree, 3.3% had a master’s degree, and none had a doctorate degree. Regarding experience on the job, 85.9% had at least 10 years of experience on the job, 13.3% had at least 11 to 16 years on the job, and 0.8% had more than 16 years on the job. Data Analysis Procedures The researcher followed a three-step data analysis process, which involved examining the reliability of the survey instrument, exploring the distribution of variables formed by collapsing the survey individual items, and hypothesis testing. Reliability Analysis Since the JSS survey instrument measures job satisfaction, which is unobservable, the researcher performed a series of reliability analyses to validate the instrument. Prior to calculating the Cronbach’s alpha, specific items had to be reverse coded (Spector, 1997). Upon reverse coding, calculation of the Cronbach's alpha (α) showed the reliability of .80 (N = 36). This exceeded the normally associated reliability of .70 (Mohamad, Sulaiman, Sern, & Salleh, 2015). Due to the number of items on the instrument, a split-half analysis was performed. In a split-half analysis, the Cronbach's alpha is calculated for each half of the instrument, and then a correlation analysis is performed between the forms (Gliem&Gliem, 2003). The Cronbach’s alpha for the first 18 items was .70, while the Cronbach’s alpha for the last 18 items was .56. The correlation between the two forms was .80. While the correlation also meets the minimum acceptable level, there is a concern that dimensions measured in the last half of the instrument may not be reliable due to survey disinterest or fatigue, or participant confusion. A third analysis was performed on Item-Totals. Upon investigation, it was noted that several items had low or negative corrected item-total correlation values. Low or negative values influence the overall reliability of the instrument.Removing low correlated items would increase the overall survey instrument reliability.
- 9. Is Hospital Manager Leadership Adaptability Score related to Subordinate Job Satisfaction? *Corresponding Author: David Augustine Bull www.aijbm.com 53 | Page However, since this instrument has been validated in many different scenarios over time, the researcher decided to maintain the integrity of the instrument but acknowledges this could have an influence on hypothesis testing. Exploratory Data Analysis Two exploratory data analyses were conducted; one for the JSS instrument, and one for the LEAD instrument. JSS. The 36-item instrument was collapsed to form an overall scale. Next, the researcher collapsed specific items associated with a priori dimensions to form the nine job satisfaction subscales. Table 2 depicts the descriptive analysis of this collapsing process. Participants considered Contingent Rewards the most important component of job satisfaction (M = 5.03, SD = .33), while Communication was considered the least important component (M = 3.33, SD = .25). Table 2. Descriptive statistics of the JSS scale JS Facets Mean SD Statistic Std. Error Statistic Pay 4.0500 .01886 .29216 Promotion 3.9500 .01886 .29216 Supervision 4.2250 .02749 .42589 Fringe Benefits 4.0750 .02052 .31788 Contingent Rewards 5.0250 .02102 .32568 Operating Conditions 3.9750 .01688 .26155 Coworkers 4.1750 .01625 .25177 Nature of Work 4.2250 .02552 .39532 Communication 3.3250 .01625 .25177 Total Job Satisfaction Valid (N = 240) 4.1139 .01365 .21142 Note: SD = Standard Deviation Next, the researcher used a boxplot to identify outliers in each of the nine JSS subscales and total JSS score. Four outliers were detected in the Coworker subscale. After investigating these records, no patterns could be discerned, and these records were retained in the dataset. The researcher assessed the 12 – item LEAD Scale for validity of the instrument and its application to this investigation. The results are displayed below in Table 3. The overall Cronbach α = .75 which is an acceptable value for any research study. Aside from this, the researcher also relied on the original validity of the instrument as it has been used I many studies over time. Table 3. Cronbah Alpha for items on the LEAD Scale Next, the researcher calculated the Leadership Adaptability Score (LAS) for each participant. Sixty percent of the participants indicated their leader had a low level of adaptability (LAS < 24). Conversely, 10 percent reported that their leader had a high level of adaptability (LAS > 30); and 30 percent reported their leader had moderate adaptability (LAS ≥24≤30; TABLE 4). Scale Mean if Item Deleted Scale Variance if Item Deleted Corrected Item-Total Correlation Cronbach's Alpha if Item Deleted Situation 1 20.89 21.473 .046 .775 Situation 2 20.69 19.011 .353 .740 Situation 3 20.29 16.415 .746 .683 Situation 4 21.19 16.471 .846 .675 Situation 5 20.19 21.182 .252 .748 Situation 6 19.99 21.561 .139 .757 Situation 7 20.89 14.644 .866 .654 Situation 8 21.12 16.890 .799 .683 Situation 9 20.50 23.766 -.278 .795 Situation 10 19.86 24.220 -.418 .794 Situation 11 20.89 14.644 .866 .654 Situation 12 20.89 21.305 .116 .762
- 10. Is Hospital Manager Leadership Adaptability Score related to Subordinate Job Satisfaction? *Corresponding Author: David Augustine Bull www.aijbm.com 54 | Page Table 4. Managerial Leadership Adaptability Scores N f % Valid % Cum. % Valid 16 19 20 25 26 24 48 72 24 7 10.0 20.0 30.0 10.0 2.9 10.0 20.0 30.0 10.0 2.9 10.0 30.0 60.0 70.0 72.9 27 41 17.1 17.1 90.0 31 2 .8 .8 90.8 32 16 6.7 6.7 97.5 33 6 2.5 2.5 100.0 Total 240 100.0 100.0 Next, the researcher calculated the Dominant Leadership Style (DLS) by identifying the mode DLS for each participant. When the DLS was multi-modal, new categories were identified. Forty percent (40%) of the participants identified their supervisor as following a Selling leadership style, while 33.3% found a Delegating leadership style more dominant (Table 5). Table 5. Managerial Dominant Leadership Style LS f % Valid % Cum. % S1S2S3 S2 S2S4 Valid 24 96 24 10.0 40.0 10.0 10.0 40.0 10.0 10.0 50.0 60.0 S3S4 16 6.7 6.7 66.7 S4 80 33.3 33.3 100.0 Total 240 100.0 100.0 Hypothesis Testing This section describes the results of hypothesis testing. 1) Job Satisfaction and Managerial Leadership Adaptability The first research question focused on the relationship between leadership adaptability and job satisfaction. Since job satisfaction was not normally distributed, the nonparametric Spearman’s Rank-Order Correlation Coefficient (rs) was used as the test statistic. The results of this test was significant, rs(240) = .31, p< .01. This result represents a moderate effect size (Cohen, 1992). As a result of this test, the null hypothesis (H10) can be rejected, and the alternative hypothesis that there is a relationship between job satisfaction and leadership adaptability can be accepted. A post-hoc test was performed to examine the relationship between leadership adaptability and components of job satisfaction. Since multiple tests are performed in isolation, Bonferroni correction was used. The Bonferroni correction is used to AVOID Type 1 errors when examining multiple relationships simultaneously (Posch&Futschik, 2012). An adjusted p-value of .006 (.05/9) was used to reject null hypotheses. Table 6 shows the results of the Spearman’s Correlation between the Leadership Adaptability Score and the Job satisfaction scores. Three strong significant relationships were identified: Leadership Adaptability and Coworkers, rs = .73, p< .000; Leadership Adaptability and Supervision, rs = .65, p< .000; Leadership Adaptability and Contingent Rewards, rs = .49, p< .000. Table 6. Spearman Correlation for DLS and JSS PY PR SV FB CR OC CW NW CM LAS SM rho .13 .22 .65 -.13 .49 -.12 .73 -.13 -.08 Sig. (2-tailed) .04 .00 .00 .05 .00 .06 .00 .05 .20 N = 240, SM = Spearman rho, PY = Pay, PR = Promotion, SV = Supervision, FB = Fringe Benefits, CR = Contingent Rewards, OC = Operating Conditions, CW = Coworkers, NW = Nature of Work, CM = Communication. 2) Job Satisfaction by Managerial Dominant Leadership Style The second research question focused on examining differences in job satisfaction based on the dominant leadership style. Since job satisfaction was not normally distributed, the nonparametric K-W test was used to evaluate the ranked differences. The result of the K-W test was significant, X2 (4, N = 240) = 83.759, p < .01.
- 11. Is Hospital Manager Leadership Adaptability Score related to Subordinate Job Satisfaction? *Corresponding Author: David Augustine Bull www.aijbm.com 55 | Page Thus, the null hypotheses (H20) was rejected, and the alternative hypothesis that there are differences in job satisfaction based on the dominant leadership style was accepted. However, the K-W test only identifies differences between groups; it doesn’t identify which groups are different. Post-hoc tests, using Mann- Whitney’s U test, are needed to identify differences between groups. Figure 2. Interaction between Dominant Leadership Style and Total Job Satisfaction First, the group of participants where multi-modal dominant leadership group S1/S2/S3 was compared to the other groups (Table 7). As shown in Table 8, job satisfaction for the multi-model group S1/S2/S3 is significantly different from the job satisfaction for the other groups and represents a large effect size (Cohen, 1992). Table 7. Difference between Managerial Multimodal DLS Groups and S1S2S3 and Other Groups MDLS Group M-W U Wilcoxon W Z Sig. r S2 (n = 120) .000 300.00 -7.71 <.01 .70 S2/S4 (n = 48) .000 300.00 -6.86 <.01 .99 S3/S4 (n = 40) .000 300.00 -6.25 <.01 .99 S4 (n = 104) .000 300.00 -7.60 <.01 .74 A similar series of tests were performed between MDLS groups S2 and the remaining groups (TABLE 8). Table 8. Difference between MDLS, S2, and Other Groups DLS Group M-W U Wilcoxon W Z Sig. r S2/S4 (n = 120) 576.00 876.00 -3.86 <.01 .35 S3/S4 (n = 112) 384.00 520.00 -3.26 .001 .31 S4 (n = 176) 3360.00 6600.00 -1.45 .147 .11 As noted by the table, significant, moderate differences were identified between MDLS S2 and multi- modal groups S2/S4 and S3/S4; however, a small, but not statistically significant, the difference was identified between MDLS, S2, and MDLS S4. Another series of tests were performed between the multi-model groups S2/S4 and the remaining two groups (Table 8). As noted by TABLE 9, a large significant difference was identified between S2/S4 and S3/S4, and a moderately significant difference was identified between S2/S4 and S4. Finally, the difference between multi-modal group S3/S4 and S4 was examined and the result of the test was not significant, Z (96) = -1.949, p = .051, r = .20. This represents a small effect size (Cohen, 1992).
- 12. Is Hospital Manager Leadership Adaptability Score related to Subordinate Job Satisfaction? *Corresponding Author: David Augustine Bull www.aijbm.com 56 | Page Table 9. Difference between S3/S4 and S4 DLS Group M-W U Wilcoxon W Z Sig. r S3/S4 (n = 40) 0.00 300.00 -6.245 <.01 .99 S4 (n = 104) 576.00 876.00 -3.039 .002 .30 V. DISCUSSION The results implied a significant relationship between Managerial Leadership Adaptability and job satisfaction. A post hoc test revealed strong relationships between Managerial Leadership Adaptability and Coworker; Managerial Leadership Adaptability and Supervision; and Managerial Leadership Adaptability and Contingent Rewards. Further analysis also revealed significant differences in job satisfaction among participants based on managerial dominant leadership style. However, there was no significant difference identified between MDLS S2 and MDLS S4. The reason could be, participants perceived they received frequent training to build up job competencies and are therefore able to execute their duties with autonomy. Overall, based on the results, the researcher concluded that a relationship existed between Managerial Dominant Leadership® style and subordinate job satisfaction among non-managerial hospital employees within the southern region of the United States. Implications Theoretical Implications In this study, the managerial dominant leadership style was selling, followed by delegating leadership style. The identification of managerial multimodal styles suggested that,aside from selling and delegating leadership styles, managers also used a combination of leadership styles to facilitate production. The researcher's findings were consistent with the main premise of the Situational Leadership model. The model depicts that no one leadership style is the best and that effective leaders are those who practice a combination of leadership styles based on the presenting situation. In this study, subordinates perceived selling leadership style was predominantly practiced by their supervisors. In dynamic organizations like hospitals, selling or coaching leadership style is predominantly used to keep employees abreast of new practices and procedures. In healthcare, processed and methods change frequently, and employees are required to learn new methods as fast as possible. The results of this study also revealed a significant moderate relationship between managerial leadership adaptability and job satisfaction. These findings were similar to the findings of Parveen and Tariq (2014). They reported that the preferred style for making decisions by heads of departments was selling leadership style. They also reported that supervisors showed low to moderate adaptability. This view was also shared by Bergold and Thomas (2012) who reported that Americans culturally place a lot of emphasis on supportive roles and share low to moderate adaptability. In this study, more subordinates perceived their supervisors as having low adaptability. Very few participants perceived their supervisors as having high adaptability. This suggests that leaders must try to improve on their leadership adaptability to effectively impact subordinate productivity or performance. Leadership adaptability is associated with the degree to which a leader can vary his or her style to match the performance readiness of an individual in a specific situation (Hersey et al., 2013). For the nine JSS survey subscales, when the split-half analysis was conducted, the first half of the subscales showed an internal consistency of .70 which is acceptable for statistical analysis, while the second half of the scale showed an internal consistency of .56 which raises some concerns. Six supplementary facets of the JSS were not supported in this study. The best JSS facets showing significantly high correlation with Managerial Leadership Adaptability Scores were Coworker, Supervision, and Contingent Reward. There were other items with significantly negative correlations which may have influenced the results of the study. Based on those results, the researcher assumed that some of the JSS subscales did not measure job satisfaction well within the population of healthcare workers in the southern region of the United States. The researcher assumed that participant confusion, survey disinterest, or fatigue may be responsible. Or the instrument is not appropriate for this specific population. Spector had reported that the Job Satisfaction Scale is designed to measure specific items. These items relate to the nature of the discipline or the appropriateness of the instrument for the specific sample under study. He noted that the JSS was specifically designed to measure both global job satisfaction, as well as its dimensions (Spector, 1997). Contingent Rewards was highly correlated with job satisfaction, while Communication showed the least correlation. A simple explanation could be differences in individual perceptions of job satisfaction. Job satisfaction meant different things to different people, and most of the Job Satisfaction Scales measured different facets of job satisfaction (Astrauskaite, Vaikevicus, &Perminas, 2010). In this study, participants revealed that they were more motivated by the reward system put in place by management. This reward system
- 13. Is Hospital Manager Leadership Adaptability Score related to Subordinate Job Satisfaction? *Corresponding Author: David Augustine Bull www.aijbm.com 57 | Page may have been the driving force behind many employees meeting their assigned goals. Reward systems come in diverse forms including an employee of the month designations, promotions, or salary increases. Aside from meeting assigned goals, Contingent Reward system may have resulted in increased interactions between employees and management. Hence the strong relationship between the two variables. With regard to communication, participants did not place more importance on formal communication when it came to their job satisfaction. It is possible that employees knew what their responsibilities were and have been on the job for at least three or more years and have gained competencies to perform their duties without much direction or involvement of management. This may account for the fact that delegating leadership was significantly correlated with subordinate job satisfaction. This finding was consistent with the findings of Butt (2010) who revealed that studies regarding communication and job satisfaction have produced mixed results. Butt reported that while some studies found a correlation between the two variables, similar to the present study, others do not. Managerial Leadership Adaptability was also highly associated with Coworkers, both scoring very low this study. The simple explanation for this is that, over time, employees have developed high competencies in performing their job responsibilities developing autonomy. Even though Coworker support is encouraged in many organizations, in this study, Coworker support was very low partly due to competition generated by their reliance on Contingent Reward and partly due to employees been competent to perform their duties. Leadership Adaptability has also had a strong relationship with Supervision. They both had low scores. The practice of delegating leadership explains the low score for Supervision. In delegating leadership, there is less supervision, with subordinate exerting autonomy. Many employees show satisfaction with job autonomy and hate been micromanaged on the job. They see no need for intense job supervision when they can effectively perform the various tasks assigned to them. Increased job supervision by any supervisor in a case where an employee show competency in completing an assigned task, often results in a leadership style-subordinate readiness mismatch as depicted by the Situational Leadership Model. The result will not imply an effective leadership. Practical Implications Hersey et al. (2013) advanced that effective practical application of the Situational Leadership® model enhances employee retention, job satisfaction, and employee productivity, while it reduces absenteeism and turnover. In this present study, the researcher found that respondents perceived their supervisor's dominant leadership style is selling, followed by delegating leadership style. The results were consistent with earlier studies (Kaladeh, 2013; Parveen & Tariq, 2012; Eka, Hadiwidjojo, &Slamet, 2013). Eka, et al. found that managers improved employee job satisfaction using Situational Leadership® either directly or indirectly. The overall impact was a significant positive influence on job performance. Based on this study and work of others, the implication for healthcare managers is to deploy selling leadership as their primary leadership style, followed by delegating leadership style as their secondary style. In addition, managers may also impact subordinate job satisfaction by practicing multimodal or a combination of leadership styles as needed. The appropriate application of leadership behavior forms the basis of the Situational Leadership® model. Regrettably, according to Henochowicz and Hentherington (2006), even though selling methods have been of great utility for physicians and non-medical managerial leadership, healthcare executives have underutilized the selling leadership style in most of their training sessions and practices. Tsai and Su (2011) also shared Eka, et al.’s (2013) views. Tsai and Su noted that understanding employee satisfaction is critical to organizational success. The authors suggested that managers who employ appropriate leadership behaviors including multimodal leadership styles, could increase job satisfaction and encourage organizational citizenship behaviors. Healthcare administrators may find it valuable to use the selling, delegating, and multimodal leadership styles in hospitals, based on specific job responsibilities. For example, nurses in Intensive Care Units (ICUs) are trained to care for patients with autonomy during their respective shifts. An effective leader should apply a delegating leadership style in this situation. Managers experiencing high staff attrition, low productivity, and excessive use of agency staff, may rely on the results of this study and focus on using the Situational Leadership® approach to help improve the behavioral performance of their employees, and hence organizational productivity. Future implications Healthcare managers may use the results of this study to provide a strong foundation for examining and improving their leadership behaviors. This implies not only in hospitals but also in any establishment where they exercise authority. Findings of this study could help senior managers to augment existing supervisory or staffing schedules to better match subordinates to appropriate supervisors. Managers may also use the researcher’s findings to augment in-service training curricula, policies, and procedures, and other managerial documents to enhance effective leadership skills and foster employee job satisfaction and productivity. Proactive leaders seeking to continue their professional development midcareer may find this study useful in improving their
- 14. Is Hospital Manager Leadership Adaptability Score related to Subordinate Job Satisfaction? *Corresponding Author: David Augustine Bull www.aijbm.com 58 | Page leadership skills. Organizational leaders must know that their employees are the most valuable assets they have. Effective leaders should inform themselves of specific job enhancing facets useful for production. Recommendations Recommendations for future research The research recommends the following: Researchers should determine the relationship between multimodal leadership and job satisfaction. From the literature review, we examined studies with conflicting results about the relationship between specific leadership dimensions such as participating and delegating leadership styles and job satisfaction. The researcher recommends a deeper investigation into subordinate job satisfaction and leadership styles, especially telling, participating, and multimodal leadership styles, to help towards making a concrete determination into job satisfaction and leadership styles. The researcher framed the relationship between job satisfaction and the independent variables of telling, selling, participating, delegating leadership. Other researchers could extend these results by studying more independent variables associated with leadership styles or using different theories related to the situational perspective. This could provide greater insight into the link between non- managerial hospital personnel’s job satisfaction and their managers’ leadership styles. A researcher could also further study the role of demographic factors such as education level, gender, age, ethnicity, and experience to provide greater insight into leadership and job satisfaction issues. A researcher would examine the perceptions of both supervisors and their subordinates, and what role these demographic factors play in job satisfaction among employees. Furthermore, Managerial Leadership Adaptability should be re-investigated. In this study, low leadership adaptability was highly associated with subordinates perceived job satisfaction. Generally, it is expected that leaders exhibit high leadership adaptability, that is, the ability for the leader to vary his or her leadership style based on change within the organization. However, low adaptability has shown a high degree of association in this study. Researchers could determine if any correlation existed between Managerial Dominant Leadership® style and job satisfaction, to help increase the deployment of the Situational Leadership® model in different organizations. Recommendations for practice First, the researcher recommends the practice of selling and delegating leadership styles primarily and multimodal leadership styles based on the appropriate situation. Managers who used selling, delegating and multimodal leadership styles were highly associated with job satisfaction scores. Supervisor Leadership Adaptability was significantly positively correlated to job satisfaction. Hersey et al. claimed that if leaders applied the Situational Leadership® model correctly, then they could reduce employee turnover, absenteeism, and increase employee retention, job satisfaction, and productivity. Healthcare managers could use this information as decision-making input for healthcare managerial strategies. Second, many organizations have a problem with retaining employees. Employee turnover causes organizations to lose valuable knowledge of business processes and systems that are essential for maintaining a competitive advantage. To alleviate this problem, the researcher makes the following recommendations: healthcare organizations must emphasize strategies that could improve job satisfaction, including focusing on the manager’s dominant leadership style. In addition, managers must be held accountable for high turnover rates. VI. CONCLUSION The results implied a significant relationship between Supervisor Leadership Adaptability and job satisfaction. A post hoc test revealed strong relationships between Managerial Leadership Adaptability and Coworker; Managerial Leadership Adaptability and Supervision; and Leadership Adaptability and Contingent Rewards. Further analysis also revealed significant differences in job satisfaction among participants based on supervisor dominant leadership style. However, there was no significant difference identified between MDLS S2 and MDLS S4. The reason could be, participants perceived they received frequent training to build up job competencies and are therefore able to execute their duties with autonomy. Overall, based on the results, the researcher concluded that a relationship existed between Supervisor Dominant Leadership® style and subordinate job satisfaction among non-managerial hospital employees within the southern region of the United States. Exploring this relationship may help healthcare administrators and other businesses to make formidable leadership decisions.
- 15. Is Hospital Manager Leadership Adaptability Score related to Subordinate Job Satisfaction? *Corresponding Author: David Augustine Bull www.aijbm.com 59 | Page REFERENCES [1]. Ahmad, A. R., Adi, M. N. M., Noor, H., Rahman, A. G. A., &Yushuang, T. (2013). The Influence of leadership style on [2]. job satisfaction among nurses. Asian Social Science Journal, 9, 1911-2017. doi:10.5539/ass.v9n9p172 [3]. Ahmad, H., Ahmad, K., & Shah, I. A. (2010). The relation between job satisfaction, job performance attitude towardswork and organizational commitment. European Journal of Social Sciences, 18(2), 257- 267. [4]. Ahmad, N., Hussain, A., & Tariq, M.S. (2014). The linkage between leadership styles and employee performance. [5]. International Journal of Accounting Research, 1(2), 21-29. [6]. Ahmad, R., Ing, H. E., &Bujang, S. (2014). The relationship between selected factors of job satisfaction and job [7]. performance among workers at palm oil industries. International Review of Management and Business Research, 3, 1751-1766. [8]. Aichia, C., & Hui, L. (2007). Transforming service employees and climate: A multilevel, multisource examination oftransformational leadership in building long-term service relationships. Journal of Applied Psychology,92,10061019. doi:10.1037/0021-9010.92.4.1006 [9]. Arayesh, B., & Noori, A. (2012). An examination of the relationship between participatory management and employees'productivity of agricultural extension management: A case study of Ilam, Iran. African Journal of Business Management, 6, 10138-10142. doi:10.5897/AJBM11.1794 [10]. Arnold, N. H., &Ukpere, W. I. (2012). Leadership model for appraising employees' readiness within the Solidarity trade union in South Africa. African Journal of Business Management, 6, 9814-9822. doi:10.5897/AJBM12.1171 [11]. Astrauskaite’, M. Perminas, A., &Vaitkevicius, R. (2011). Job satisfaction survey: A confirmatory factor analysis basedon secondary school teacher sample. International Journal of Business and Management, 6(5), 41–50. doi:10.5539/ijbm.v6n5p41 [12]. Ayob, N. B., Lo, M. C., Ngui, K. S., Vroon, M. L. (2011). The influence of leadership styles on employee’s jobsatisfaction in public sector organizations in Malaysia. International Journal of Business, Management, and Social Sciences, 2(1), 24-32. [13]. Babbie, E. R. (2015). The practice of social research (14th ed). Boston, MA: Cengage Learning. [14]. Baig, R., Bilal, H., Maqsood, S., & Nazir, S. (2013). Manager’s leadership style and employees’ job satisfaction. Humanand Social Research, 1(2), 139 – 144. [15]. Bates, C. (2014). A study of situational leadership theory. A Journal of Radix International Educational and ResearchConsortium, 3(11), 2277 – 1018. [16]. Batista, D. C., Furdado, C. D., & Silva, F. (2011). Leadership and job satisfaction among Azorean hospital nurses:an application of the situational leadership model. Journal of Nursing Management, 19(8), 1047-1057. doi:10.1111/j.1365-2834.2011.01281. [17]. Batura, N., Skordis-Worrall, J., Thapa, R., Basnvat, R. & Morrison, J. (2016). Is the job satisfaction survey a good tool tomeasure job satisfaction among health workers in Nepal? Results of a validation analysis. BHC health Services Research, 16(1-13). Doi:101186/s12913-016-1558-4 [18]. Bergold, J. & Thomas, S. (2012). Participatory research methods: A methodological approach in motion. Historical Social [19]. Research / HistorischeSozialforschung, 37(4), 191-222. doi:10.2307/41756482 [20]. Bilal, R. U., Mansor, M., & Rehman, S. (2012). The impact of leadership on job satisfaction at the workplace. ArabianJournal of Business and Management Review (OMAN Chapter), 1(12), 26–41. [21]. Bodla, M. A., & Hussain, G. (2010). Need for leadership: Empirical evidence from Pakistan. International Journal of Management and Information Systems, 14(5), 79-86. [22]. Bormann, L. (2013). Nurse Manager Leadership behavior and staff nurse job satisfaction. A presentation at theSigma Theta Tau International Conference, April 2013. Retrieved from http://www.nursinglibrary.org/vhl/bitstream/10755/290997/1/Bormann_Lorraine%20B._53751.pdf [23]. Bull, D. A. (2010). Situational leadership and employee turnover intent: A critical examination of healthcare organizations. Retrieved from http://search.proquest.com/docview/288410272 [24]. Bushra, F., Naveed, A., & Usman, A. (2011). Effects of transformational leadership on employee's job satisfaction andorganizational commitment in the banking sector of Lahore (Pakistan). International Journal of Business and Social Science, 2(18), 261 – 267. [25]. Caldwell, S. D., Marshall, J., & Walter, J. E. (1980). Evidence for the validity of situational leadership theory. Journal ofEducational Leadership, 618 – 621. [26]. Charanjit, S. R. (2017). The importance of leadership to organizational success. Retrieved from [27]. https://catalyst.nejm.org/importance-leadership-skills-organizational-success/
- 16. Is Hospital Manager Leadership Adaptability Score related to Subordinate Job Satisfaction? *Corresponding Author: David Augustine Bull www.aijbm.com 60 | Page [28]. Center of Leadership Studies. (2015). Leadership effectiveness and adaptability description scoring matrix. Escondido,CA: Leadership Studies. [29]. Cochran, W. G. (1977). Sampling techniques (3rd ed.). New York, NY: John Wiley & Sons. [30]. Cohen, J. (1992). A power primer. Psychological Bulletin, 112(1), 155- 159.http://dx.doi.org/10.1037/00332909.112.1.155 [31]. Donahue, L. P. (2013). Culturally diverse organizations: An analysis of situational leadership theory on followerreadiness. Retrieved from http://search.proquest.com/docview/1287179723?accountid=45927 [32]. Dwyer, D. J., Jex, S. M., Spector, P. E. (1988). Relations of job stressors to effective, health, and performance outcomes: [33]. A comparison of multiple data sources. Journal of Applied Psychology, 73, 11- 19.doi.apa.org/journals/apl/73/1/11.pdf [34]. Eka, A. T., Hadiwidjojo, D., &Slamet, A. T (2013). The influence of situational leadership on job satisfaction and jobperformance (A study on Trans Jakarta Busway as transportation service in DKL Jakarta). Global Advanced Research Journal of Management and Business Studies,2(2), 105–113. Doi or journal’s home page URL? [35]. Paul F., Erdfelder E., Buchner A., Lang A.-G. (2009). Statistical power analyses using G* Power 3.1: tests for correlationand regression analyses. Behavioral Research Methods, 41, 1149–1160. doi: 10.3758/BRM.41.4.1149 [36]. Gall, M. D., Gall, J. P., & Borg, W. R. (2015). Applying educational research: How to read, do, and use research to solveproblems of practice. (7th Ed.). Boston: Pearson. [37]. Gayle, M. M. (2009). The relationship between employee perception of leadership style and job satisfaction in acommercial laboratory environment. Retrieved from http://nsuworks.nova.edu/hsbe_etd/35/ [38]. Gliem, J. A, &Gliem, R. R. (2003). Calculating, interpreting, and reporting Cronbach’s alpha reliability coefficient forLikert-Type scales. Retrieved from http://pioneer.netserv.chula.ac.th/~ppongsa/2013605/Cronbach.pdf [39]. Greene, J. F. (1980). Executive summary for the LEAD–Self-manual. Escondido, CA: Center for Leadership Studies. [40]. Greenland, S., Senn, S. J., Rothman, K. J., Carlin, J. B., Poole, C., Goodman, S. N., & Altman, D. G. (2016). Statisticaltests, P values, confidence intervals, and power: a guide to misinterpretations. European Journal of Epidemiology, 31, 337–350. http://doi.org/10.1007/s10654-016-0149-3. [41]. Henochowicz, S., & Hetherington, D. (2006). Leadership coaching in healthcare. Leadership and OrganizationDevelopment Journal, 27(3), 183–189. doi:10.1108/01437730610657703 [42]. Hersey, P., Blanchard, K. H., & Johnson, D., E. (2013). Management of organizational behavior: Leading Humanresources. (10th ed.). Englewood Cliffs, NJ: Prentice- Hall. [43]. Jackson, A. R., Alberti, J. L., & Snipes, R. L. (2014). An examination of the impact of gender on leadership style andemployee job satisfaction in the modern workplace. Journal of Organizational Culture, Communication, and Conflict, 18(2), 141-153. [44]. Kaladeh, T, M, A. (2013). A critical analysis of the effect of organizational culture and leadership style on employees’ jobsatisfaction. Interdisciplinary Journal of Research in Business,2(12), 15 – 25. [45]. Koc, H. (2011). The impact of a manager's leadership behaviors on job satisfaction and performance of employees. [46]. African Journal of Business Management, 5(30), 11836 – 11843. doi:10.5897/AJBM10.1229. [47]. Leedy, P. D., & Ormrod, J. E. (2013). Practical research: Planning and design (10thed). Upper Saddle River, N J. [48]. Prentice Hall. [49]. Malik, S. H. (2013). The relationship between leader's behavior and employee's job satisfaction: A Path-Goal approach. [50]. Pakistani Journal of Commerce and Social Science, 7(1), 209–222. Doi or journal’s home page URL? [51]. Meade, A. W., Thompson, L. F., & Watson, A. M. (2007, April). Measurement invariance of the job satisfaction surveyacross work contexts. Paper presented at the 22nd Annual Meeting of the Society for Industrial and Organizational Psychology, New York. [52]. Mendes, E. (2011). US job satisfactionstruggles torecoverto 2008 levels. Retrieved fromhttp://www.gallup.com/poll/147833/job-satisfaction-struggles-recover-2008-levels.aspx [53]. Mohamed, Z., Valcke, M., &Wever, B. (2016). Are they ready to teach? Student teachers’ readiness for the job withreference to teacher competence frameworks, Journal of Education for Teaching, 43:2, 151170, DOI:10.1080/02607476.2016.1257509
- 17. Is Hospital Manager Leadership Adaptability Score related to Subordinate Job Satisfaction? *Corresponding Author: David Augustine Bull www.aijbm.com 61 | Page [54]. Mosadeghrad, A. M. &Ferdosi, M. (2013). Leadership, job satisfaction and organizational commitment in the healthcaresector: Proposing and testing a model. Mater Sociomed, 25, 121-125. doi:10.5455/msm.2013.25.121-126 [55]. Mustapha, N. (2013). The influence of the remuneration package and promotion opportunity on job satisfaction amonglecturers in Malaysia. GSTF Business Review (GBR), 2, 212-216. doi or journal’s home page URL? [56]. Neuman, W. L., & Robson, K. (2015). The basis of social research: Quantitative and qualitative approaches. (3rd Canadian ed.). City, State: Pearson Education Canada. [57]. Pantouvakis, A, &Bouranta, N. (2013). The interrelationship between service features, job satisfaction, and customersatisfaction. TQM Journal,25, 186-201. doi:10.1108/17542731311299618. [58]. Paul, E. S., &Seol, Kheng, P. (2011). Lecturer’s job satisfaction in a public tertiary institution in Singapore:ambivalent and non-ambivalent relationships between job satisfaction and demographic variables. Journal of Higher Education policy & management, 33(2), 141 – 151. Doi: 10.1080/1360080X.2011.550087. [59]. Parveen, S., & Tariq, A. (2014). Leadership style, gender and job satisfaction: A situational leadership approach. [60]. International Journal of Science and Research, 3(12), 43-51. Retrieved from http://www.ijsr.net/ [61]. Posch, M., &Futschik, A. (2012). A uniform improvement of Bonferroni type tests by sequential tests. Journal of theAmerican Statistical Association, 103(481), 299-308. doi:10.1198/016214508000000012 [62]. Rothfelder, K., Ottenbacher, M. C., & Harrington, R. J. (2012). The impact of transformational, transactional and non-leadership styles on employee job satisfaction in the German hospitality industry. Tourism and Hospitality Research, 12, 201-214. doi:10.1177/1467358413493636. [63]. Sfantou, D. F., Laliotis, A., Patelarou, A. E., Sifaki-Pistolla, D., Matalliotakis, M., &Patelarou, E. (2017). Importance ofleadership style towards quality of care measures in healthcare settings: A Systematic Review. Healthcare (Basel, Switzerland), 5(4), 73. doi:10.3390/healthcare5040073 [64]. Spector, P.E. (1997). Job satisfaction: Application, assessment, causes, and consequences. Thousand Oaks, CA.: SagePublications. [65]. Taplin, I. M., & Winterton, J. (2007). The importance of management style in labor retention. International Journal ofSociology and Social Policy, 27(1/2), 5–18. doi or journal’s home page URL? [66]. Tai, C., & Su, C. (2011). Leadership, job satisfaction, and service-oriented organizational citizen behaviors in-flightattendants. African Journal of Business Management, 5, 1915–1926. doi or journal’s home page URL? [67]. Van Vliet, V. (2012). Situational leadership(Hersey & Blanchard). Retrieved from http://www.toolshero.com/situational-leadership-hersey-blanchard *Corresponding Author: David Augustine Bull Adjunct Faculty - School of Business American Intercontinental University