Food Calories and Fat Relationship
•Download as DOCX, PDF•
0 likes•252 views

A math lesson covering common core standard 8.S.P.3

Recommended
More Related Content
Similar to Food Calories and Fat Relationship
Similar to Food Calories and Fat Relationship (20)
More from Aaron Maurer
More from Aaron Maurer (20)
Recently uploaded
Recently uploaded (20)
Food Calories and Fat Relationship
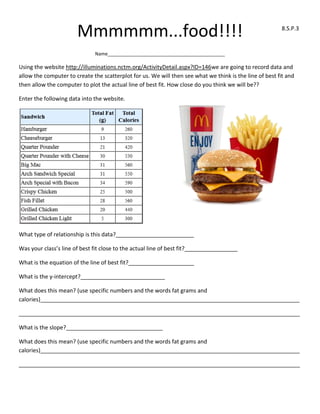
- 1. Mmmmmm...food!!!! 8.S.P.3 Name_____________________________________________ Using the website http://illuminations.nctm.org/ActivityDetail.aspx?ID=146we are going to record data and allow the computer to create the scatterplot for us. We will then see what we think is the line of best fit and then allow the computer to plot the actual line of best fit. How close do you think we will be?? Enter the following data into the website. What type of relationship is this data?_________________________ Was your class’s line of best fit close to the actual line of best fit?_________________ What is the equation of the line of best fit?_____________________ What is the y-intercept?___________________________ What does this mean? (use specific numbers and the words fat grams and calories)___________________________________________________________________________________ __________________________________________________________________________________________ What is the slope?_______________________________ What does this mean? (use specific numbers and the words fat grams and calories)___________________________________________________________________________________ __________________________________________________________________________________________
- 2. Equation: y = _________ x + __________ y represents_______________________ x represents_______________________ Using the equation above, if you ordered a sandwich that had 24 grams of fat, how many calories would you expect to be in the sandwich (label your answer!)? Compare this to the graph on the board. Using the equation above, how many fat grams would a sandwich with 510.56 calories in it have (label your answer!)? Compare this to the graph on the board.