Hero or Foe - The Importance of Context
•Download as PPTX, PDF•
0 likes•929 views

SWD Example for the MSBA program at U of L.

Recommended
Recommended
More Related Content
Recently uploaded
Recently uploaded (20)
Featured
Featured (20)
Hero or Foe - The Importance of Context
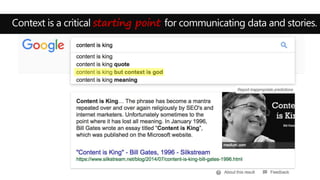
- 1. Context is a critical starting point for communicating data and stories.
- 2. Without context, Harry Potter is more aggressive than Voldemort. Note: This data is from the 2017 6th Annual Harry Potter Conference at Chestnut Hill College in Philadelphia, PA
- 3. Context equips your receiver with an accurate interpretive framework. Note: This data is from the 2017 6th Annual Harry Potter Conference at Chestnut Hill College in Philadelphia, PA
Editor's Notes
- Context is especially important in the field of analytics. Just as communication begins before you ever start building your first data visualization, like any good story, a visual data story requires context—a setting, a plot, a goal—before we can begin to communicate. Discovering this context is part of the storytelling process In this lesson, we will focus on understanding the importance of context in data visualization and visual storytelling, how to ask the right questions in analysis that will help you begin to build out your story framework, and how to let context drive the story as you share it with your audience.
- To aid in visualizing the story of good versus evil in Harry Potter, we can visualize all the instances where characters in each of the books acted aggressively. When we visualize this data at the most superficial level—aggressive acts enacted by Harry and Voldemort in each of the books—these “lightning bolts” seem to show that over the course of the series Harry committed significantly more aggressive behaviors than did his nemesis, Lord Voldemort. In this version of the story, our good wizard suddenly looks a little more sociopathic then we might have expected. The good news to Potter fans is that if we look at the data like this we are overlooking critical context and showcasing a faulty story. Remember, the danger of a story told wrong is the prospect of making a bad decision based on inaccurate or otherwise incorrect information, and this logic applies to any story—even Harry’s. If we’d presented this visual to, for example, Rowling’s publisher prior to the series being published, we may never have been introduced the Wizarding World.
- To make sure we’re including context in a meaningful way, we need to revisit our initial assumptions of how we approached visualizing two key variables: the two characters and their aggressive acts. In the previous attempt, we simply visualized a count of aggressive acts and neglected to consider the context in which the acts were committed (or the influence of the character on the narrative). Doing so puts an undue spotlight on Harry and presents an immediate contextual fallacy. This is Harry’s story, and as the protagonist all of his actions, aggressive or not, are heavily documented. In contrast, Voldemort, while a main character, has a lesser presence in the story. This logic helps us see critical context we neglected in a simple counting exercise. Rather than how many aggressive acts were committed by each character, we need to look at how often each character appears and how often they commit aggressive acts when mentioned. Out of Context: How many times Harry and Voldemort acted aggressively. In Context: How often Harry and Voldemort acted aggressively when mentioned. Putting the data back into a relevant context, when we visualize again we see something very different.