
Recommended
Recommended
More Related Content
What's hot
What's hot (20)
Similar to Best London Boroughs for Airbnb Property Investment
Similar to Best London Boroughs for Airbnb Property Investment (20)
Recently uploaded
Recently uploaded (20)
Best London Boroughs for Airbnb Property Investment
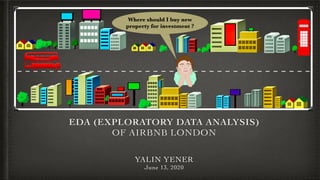
- 1. EDA (EXPLORATORY DATA ANALYSIS) OF AIRBNB LONDON Where should I buy new property for investment ? YALIN YENER June 13, 2020
- 3. Introduction Methodology Results Conclusions Future Work Appendix Business Need: Finding best location to buy a new property for investment that host on Airbnb.Total Budget : £750.000, Preferred Location: Inner London Solution: Using Airbnb London data, House Prices Index (House Price, Sales Volume, Yearly Increment) data, Council Tax data, GIS Boundary data and analyse to find best location for buying new house. Objectives: Answering these questions for each borough • Number of properties that host on Airbnb • Average price per night • Estimate Occupancy day per year • Calculate annual income, annual expense and annual return, initial expense etc. • Calculate return of investment rate and total profit Suggest the most suitable place for my client3
- 4. 4 Introduction Methodology Results Conclusions Future Work Appendix VisualisationAnalyseBusiness Need Data WranglingData Acquire –John W. Tukey, 1970 “Exploratory Data Analysis is a detective work” “EDA can never be the whole story, but nothing else can serve as the foundation stone--as the first step ”
- 5. 5 Introduction Results Conclusions Future Work Appendix Data Sources Tools Mayor of London • Average House Price (1996-2019) (xlsx) • Sales Volume (1996-2019) (xlsx) • Council Tax (2020) (xlsx) Data Data Visualization Analytics Platform Thematic Map Inside Airbnb • 09 January, 2020 • Detail Listings data (csv) Spatial Data • Borough Border (geojson) • Airbnb Point (csv) Methodology
- 6. 6 Introduction Methodology Results Conclusions Future Work Appendix Brief Insight from Data Number of Borough: 33 Number of Properties: 87235 Number of Host: 14783 Average Price for All London: £129.61 Most Expensive Borough for Airbnb Properties: Kensington and Chelsea /£220.92 Cheapest Borough for Airbnb Properties: Bexley /£58.05 Most Hosted Borough: Westminster / 9925 / %11.4 Least Hosted Borough: Bexley / 255 / %0.3 Most have room type: Entime home / apt %56 Most Expensive Average House Price: Kensington and Chelsea /£1 243 722 Cheapest Average House Price: Barking and Dagenham /£298 620
- 7. 7 Introduction Methodology Results Future Work Appendix ROI Rate: City of London and Westminster are most suitable boroughs for buying new property. Because of metrics that shown below: Price/Night Occupancy Annual Return (Income - Expense) House Price Initial Expenses Net Profit (After 1 year)* Wandsworth and Westminster are most suitable boroughs for buying new property. Because of ROI Rate’s metrics + metrics that below: Annual Increment Sales Volume * If you have to sell the property Conclusions
- 8. 8 Introduction Methodology Results Future Work AppendixConclusions
- 9. 9 Introduction Methodology Results Conclusions Future Work Appendix Client Constraint: Total Budget : £750.000, Preferred Location: Inner London ROI Rate: 1.Tower Hamlets 2.Southwark 3.Wandsworth Net Profit: 1.Wandsworth 2.Lambeth 3.Southwark
- 10. 10 Introduction Methodology Results Future Work AppendixConclusions
- 11. 11 Introduction Methodology Results Conclusions Future Work Appendix This project can be extended further by; • Analysing UK House Price Index based on zip code on Wandsworth , Tower Hamlets, Lambeth and Southwark. • Using booking.com data for average accommodation price. • Using reviews data (airbnb, booking) & social media (Instagram, Twitter, Foursquare) and acquire comments about location.
- 12. THANK YOU YALIN YENER +44 7786 761559 yalinyener@gmail.com https://github.com/yalinyener https://medium.com/@yalinyener https://www.linkedin.com/in/yalinyener
- 13. 13 Introduction Methodology Results Conclusions Future Work Appendix
- 14. 14 Introduction Methodology Results Conclusions Future Work Appendix
- 15. 15 Introduction Methodology Results Conclusions Future Work Appendix
- 16. 16 Introduction Methodology Results Conclusions Future Work Appendix
- 17. 17 Introduction Methodology Results Conclusions Future Work Appendix