Financial Protection and Improved Access to Health Care: A Spotlight on Pharm...
Midyear v7
1. Data-driven strategies for automated dispensing
cabinet (ADC) inventory optimization
Xander Miller and Michelle McCrea, RPh
Massachusetts General Hospital, Boston, MA
Background
Objectives
Acknowledgments
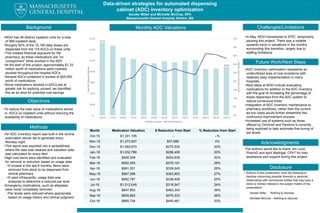
Challenges/LimitationsMonthly ADC Valuations
Methods
Future Work/Next Steps
Disclosure
• Authors of this presentation have the following to
disclose concerning possible financial or personal
relationships with commercial entities that may have a
direct or indirect interest in the subject matter of this
presentation:
Xander Miller - Nothing to disclose
Michelle McCrea – Nothing to disclose
•MGH has 46 distinct inpatient units for a total
of 999 inpatient beds
•Roughly 82% of the 10,189 daily doses are
dispensed from the 118 ADCs on these units
•This creates financial exposure for the
pharmacy, as these medications are “on
consignment” while stocked in the ADC
•At the start of this project, approximately $1.33
million worth of medications were routinely
stocked throughout the hospital ADCs
•Several ADCs contained in excess of $45,000
worth of medications
•Since medications stocked in ADCs are at
greater risk for expiring unused, we identified
this as an area for potential cost savings
•To reduce the total value of medications stored
in ADCs on inpatient units without reducing the
availability of medications
•An ADC inventory report was built in the central
automation server set to generate every
Monday night
•This report was exported into a spreadsheet,
where the data was cleaned and valuation data
was calculated for every item
•High cost items were identified and evaluated
for removal or reduction based on usage data
•If unused in the last 6 months, items were
removed from stock to be dispensed from
central pharmacy
•If used infrequently, usage data was
analyzed to determine a reduced par level
•Emergency medications, such as alteplase,
were never completely removed
•Par levels were reduced where appropriate
based on usage history and clinical judgment
•In May, MGH transitioned to EPIC, temporarily
pausing this project. There was a notable
upwards trend in valuations in the months
surrounding this transition, largely due to
staffing limitations
The authors would like to thank Jim Lund,
PharmD and April Madrigal, CPhT for their
assistance and support during this project
•ADC inventory optimization represents an
underutilized area of cost avoidance with
relatively easy implementation in many
hospitals
•Next steps at MGH include evaluating
medications for addition to the ADC inventory
with the goal of increasing the percentage of
doses dispensed from the ADC system to
reduce turnaround times
•Integration of ADC inventory maintenance to
pharmacy workflows, rather than the current
ad-hoc basis would further streamline this
continuous improvement process
•Increased use of systems such as those
offered by Omnicell and Pandora is currently
being explored to help automate fine-tuning of
par levels
Month Medication Valuation $ Reduction from Start % Reduction from Start
Oct-15 $1,331,195 -- --%
Nov-15 $1,273,507 $57,689 4%
Dec-15 $1,060,670 $270,525 20%
Jan-16 $1,032,786 $298,409 22%
Feb-16 $926,558 $404,638 30%
Mar-16 $952,005 $379,191 28%
Apr-16 $991,551 $339,645 26%
May-16 $967,296 $363,900 27%
Jun-16 $992,787 $338,409 25%
Jul-16 $1,012,648 $318,547 24%
Aug-16 $847,853 $483,343 36%
Sep-16 $855,862 $475,333 36%
Oct-16 $885,734 $445,461 33%
$1.33
$0.89
0%
5%
10%
15%
20%
25%
30%
35%
40%
45%
$-
$0.20
$0.40
$0.60
$0.80
$1.00
$1.20
$1.40
10/2015 11/2015 12/2015 1/2016 2/2016 3/2016 4/2016 5/2016 6/2016 7/2016 8/2016 9/2016 10/2016
PercentReductioninADCValuation
TotalADCValuation(Millions)
Monthly Valuation Percent Reduction