SlideShare a Scribd company logo
1 of 4
Download to read offline
1 www.quandl.com
R Cheat Sheet
Vector and Matrix Operations
Construction
c()
cbind()
rbind()
matrix()
Concatenate
Column Concatenate
Row Concatenate
Create matrix
v <- c(1,2,3,4) # 1 2 3 4
cbind(v,v) # 2 Columns
rbind(v,v) # 2 Rows
mat <- matrix(v,nrow=2,ncol=2)
Selection
v[1]
tail(v,1)
mat[2,1]
mat[1,]
mat[,2]
v[c(1,3)]
v[-c(1,3)]
mat[,c(1,2)]
mat[,1:5]
mat[,“col”]
		
Utility
length()
dim()
sort()
order()
names()
			
Length of vector			
Dimensions of vector/matrix/dataframe			
Sorts vector			
Index to sort vector e.g. sort(v) == v[order(v)]		
Names of columns
			
Select first		
Select last		
Select row 2, column 1		
Select row 1		
Select column 2		
Select the first and third values	
Select all but the first and third values	
Select columns 1 and 2
Select columns 1 to 5		
Select column named “col”
Basic Syntax
#
<- or =
<<-
v[1]
*
%*%
/
%/%
%%
Comments
Assignment
Global Assignment
First element in a vector
Scalar Multiplication
Matrix Multiplication
Division
Integer Division
Remainder
# This is not interpreted
a <- 1; b = 2
a <<- 10 # Not recommended
v[1]
c(1,1)*c(1,1) # 1 1
c(1,1)%*%c(1,1) # 2
1/2 # 0.5
1%/%2 # 0
7%%6 # 1
Example
2 www.quandl.com
Time Series
Time Series Classes
ts(data, frequency)
zoo(data, index)
xts(data, index)
tis()
irts()
timeSeries()
Structures
data.frame(…)
list(name=var)
ts(data, frequency)
Tests 	 		 The package tseries is required for a most of these functions
adf.test
jarque.bera.test
kpss.test
po.test
pp.test
runs.test
terasvirta.test
white.test
box.test
From R base, handles regularly spaced time series				
Part of the zoo package, handles irregularily spaced data using arbitrary time
date classes				
Modification to zoo, gives more power to selecting date subsets				
Uses POSIXct time stamps				
From the package tseries and uses POSIXct time stamps				
Uses timeDate time stamps	 			
Computes the Augmented Dickey-Fuller test for the null that the series
has a unit root
Tests the null of normaility for the series using the Jarque-Bera test statistics			
Computes the KPSS test for the null that the series is level or trend stationary			
Computes the Phillips-Ouliaris test for the null that the series in not cointegrated
Computes the Phillips-Perron test for the null that the series has a unit root			
Computes the runs test for randomness of the binary series				
Generically computes Teraesvirta’s neural network test for neglected
nonlinearity for the time series				
Generically computes the White neural network test for neglected
nonlinearity for the time series				
Compute the Box-Pierce or Ljung-Box test statistics for examining the null of independence
in a given series									
Takes multiple variables with the same number of rows and creates a dataframe
R’s implementation of a hash, takes multiple variables or variable tag pairs		
Creates a regularly spaced time series object				
	
Apply
apply(data, axis, fun)
lapply(data, fun)
tapply(data, index, fun)
			I/O
read.table(“filename”, sep=”,”)
read.csv()
fromJSON()
xmlTreeParse()
write.csv()
			
Apply the function fun to data along axis
Apply the function fun to the list or vector data				
Apply the function fun to data along the list of factors index			
			
Reads information in from file with a variable delimiter
Read csv file into dataframe				
Read JSON formatted file or string into a list - Requires RJSONIO				
Read XML formatted file or string into a list - Requires XML				
Writes a dataframe or matrix (or tries to convert input to one) and writes to csv			
				
			
For a great introduction to using apply see this article.
3 www.quandl.com
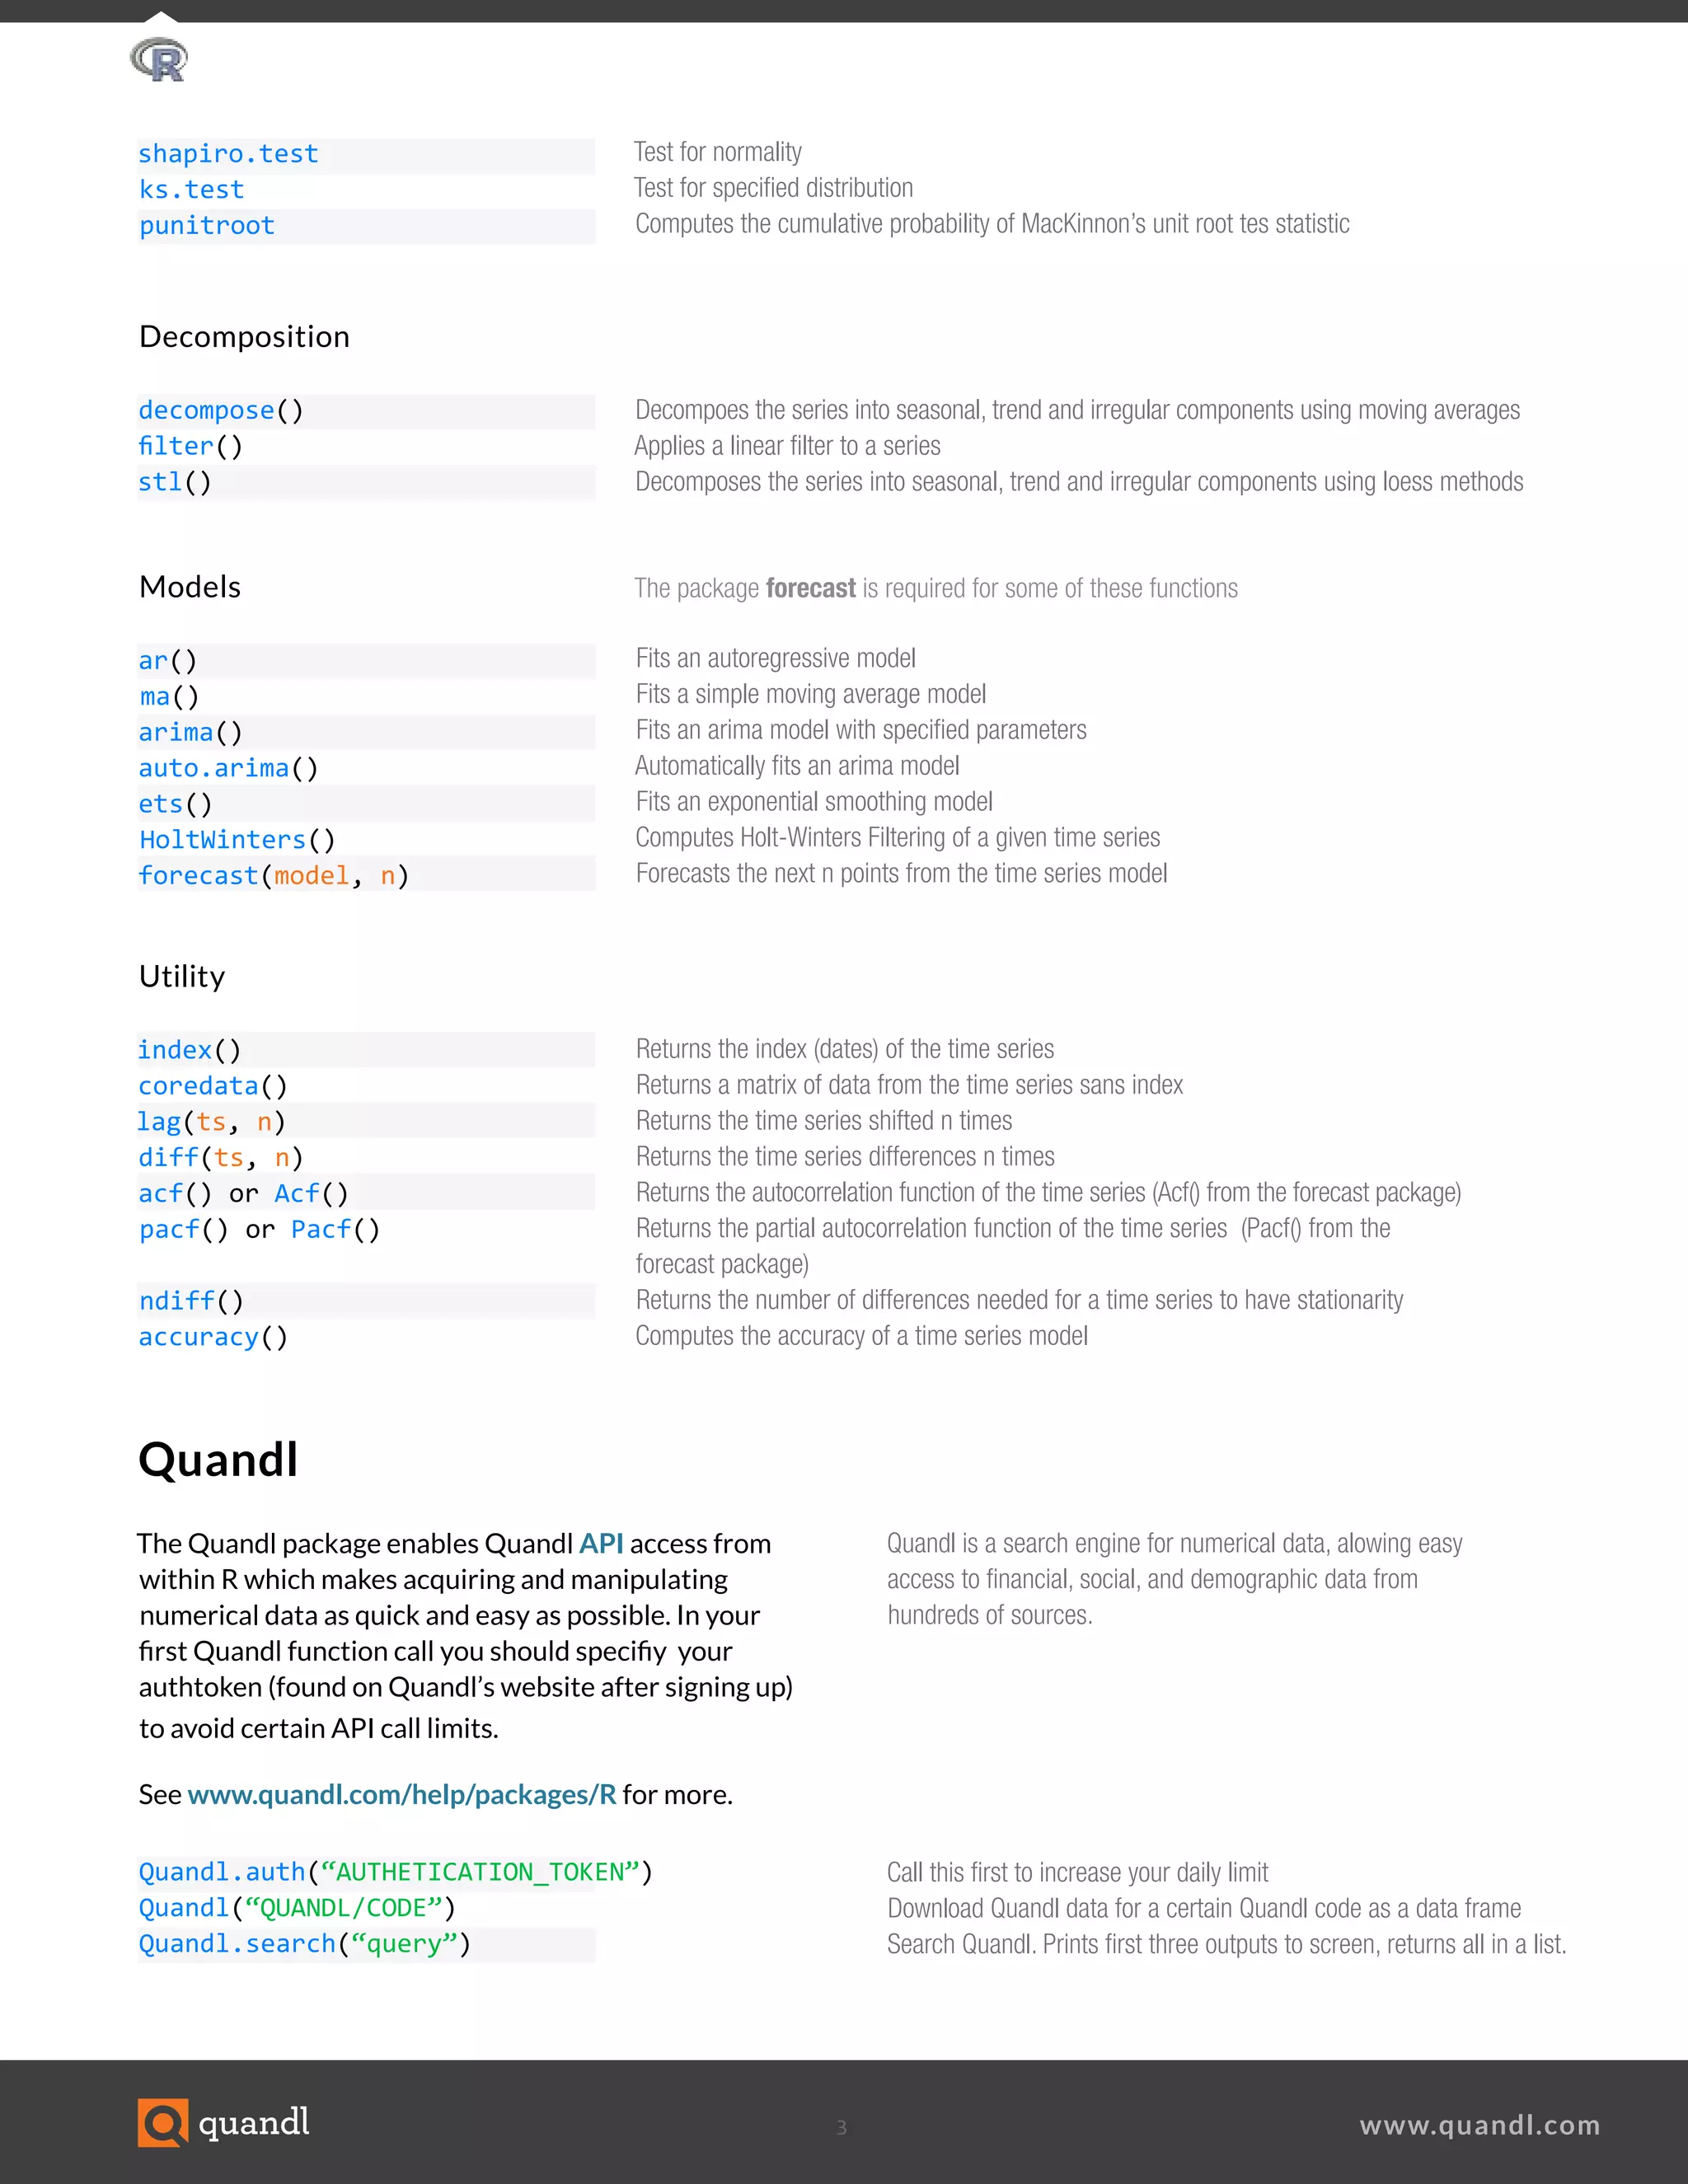
Quandl is a search engine for numerical data, alowing easy
access to financial, social, and demographic data from
hundreds of sources.
Quandl
The Quandl package enables Quandl API access from
within R which makes acquiring and manipulating
numerical data as quick and easy as possible. In your
first Quandl function call you should specifiy your
authtoken (found on Quandl’s website after signing up)
to avoid certain API call limits.
See www.quandl.com/help/packages/R for more.
Models				The package forecast is required for some of these functions
ar()
ma()
arima()
auto.arima()
ets()
HoltWinters()
forecast(model, n)
Utility
index()
coredata()
lag(ts, n)
diff(ts, n)
acf() or Acf()
pacf() or Pacf()
ndiff()
accuracy()
Fits an autoregressive model
Fits a simple moving average model	
Fits an arima model with specified parameters	
Automatically fits an arima model	
Fits an exponential smoothing model	
Computes Holt-Winters Filtering of a given time series
Forecasts the next n points from the time series model					
Returns the index (dates) of the time series				
Returns a matrix of data from the time series sans index				
Returns the time series shifted n times			
Returns the time series differences n times				
Returns the autocorrelation function of the time series (Acf() from the forecast package)		
Returns the partial autocorrelation function of the time series (Pacf() from the
forecast package)				
Returns the number of differences needed for a time series to have stationarity	
Computes the accuracy of a time series model				 	
Decomposition
decompose()
filter()
stl()
Decompoes the series into seasonal, trend and irregular components using moving averages
Applies a linear filter to a series	
Decomposes the series into seasonal, trend and irregular components using loess methods	
	
shapiro.test
ks.test
punitroot
Test for normality				
Test for specified distribution				
Computes the cumulative probability of MacKinnon’s unit root tes statistic							
								
Quandl.auth(“AUTHETICATION_TOKEN”)
Quandl(“QUANDL/CODE”)
Quandl.search(“query”)	
Call this first to increase your daily limit
Download Quandl data for a certain Quandl code as a data frame
Search Quandl. Prints first three outputs to screen, returns all in a list.
4 www.quandl.com
Plotting
plot(ts)
title(main, sub, xlab, ylab)
ggplot()
aes()
geom_line()
geom_boxplot()
xlab()
ylab()
ggtitle()
theme()
R base plot function			
Adds labels to the currently open plot	
Creates a ggplot object				
Creates a properly formatted list of variables for use in ggplot				
Plots data with a line connecting them				
Plots data in the form of box and whiskers plot				
Edit the x axis label			
Edit the y axis label			
Edit the plot title				
Modify a large number of options for the plot from grid elements to colors				
Aside from the built in plotting function in R, ggplot2 is a very powerful plotting package.
See http://docs.ggplot2.org/current/ for complete documentation.
Plotting example with ggplot2
library(Quandl)					
library(ggplot2)					
data_series <- Quandl(“GOOG/NASDAQ_AAPL”, start_date=”2005-01-01”)[,c(1,5)]				
my.plot <- ggplot(data=data_series, aes(x=Date, y=Close)) +	
geom_line(color=”#FAB521”) + # Adding a colored line					
theme(panel.background = element_rect(fill=’#393939’), panel.grid.major.x = element_blank(),
panel.grid.major.y = element_line(colour=’white’, size=0.1),
panel.grid.minor = element_line(colour=’white’, size=0.1)) + # modifying background color
# and grid options					
xlab(“Date”) + ylab(“Closing Price”) + ggtitle(“AAPL”) # Adding titles				
	
my.plot # Generates the plot

More Related Content

What's hot

Scientific Computing with Python - NumPy | WeiYuan
Scientific Computing with Python - NumPy | WeiYuanScientific Computing with Python - NumPy | WeiYuan
Scientific Computing with Python - NumPy | WeiYuanWei-Yuan Chang
 
Spark 4th Meetup Londond - Building a Product with Spark
Spark 4th Meetup Londond - Building a Product with SparkSpark 4th Meetup Londond - Building a Product with Spark
Spark 4th Meetup Londond - Building a Product with Sparksamthemonad
 
Grouping & Summarizing Data in R
Grouping & Summarizing Data in RGrouping & Summarizing Data in R
Grouping & Summarizing Data in RJeffrey Breen
 
Python for R Users
Python for R UsersPython for R Users
Python for R UsersAjay Ohri
 
&#49892;&#54744;&#49444;&#44228;&#49892;&#49845;
&#49892;&#54744;&#49444;&#44228;&#49892;&#49845;&#49892;&#54744;&#49444;&#44228;&#49892;&#49845;
&#49892;&#54744;&#49444;&#44228;&#49892;&#49845;yosm
 
Broom: Converting Statistical Models to Tidy Data Frames
Broom: Converting Statistical Models to Tidy Data FramesBroom: Converting Statistical Models to Tidy Data Frames
Broom: Converting Statistical Models to Tidy Data FramesWork-Bench
 
Intoduction to numpy
Intoduction to numpyIntoduction to numpy
Intoduction to numpyFaraz Ahmed
 
Introduction to Pandas and Time Series Analysis [PyCon DE]
Introduction to Pandas and Time Series Analysis [PyCon DE]Introduction to Pandas and Time Series Analysis [PyCon DE]
Introduction to Pandas and Time Series Analysis [PyCon DE]Alexander Hendorf
 
Morel, a Functional Query Language
Morel, a Functional Query LanguageMorel, a Functional Query Language
Morel, a Functional Query LanguageJulian Hyde
 
Python - Numpy/Pandas/Matplot Machine Learning Libraries
Python - Numpy/Pandas/Matplot Machine Learning LibrariesPython - Numpy/Pandas/Matplot Machine Learning Libraries
Python - Numpy/Pandas/Matplot Machine Learning LibrariesAndrew Ferlitsch
 
Introduction to NumPy (PyData SV 2013)
Introduction to NumPy (PyData SV 2013)Introduction to NumPy (PyData SV 2013)
Introduction to NumPy (PyData SV 2013)PyData
 
Statistical inference for (Python) Data Analysis. An introduction.
Statistical inference for (Python) Data Analysis. An introduction.Statistical inference for (Python) Data Analysis. An introduction.
Statistical inference for (Python) Data Analysis. An introduction.Piotr Milanowski
 
Python for R developers and data scientists
Python for R developers and data scientistsPython for R developers and data scientists
Python for R developers and data scientistsLambda Tree
 
Basic of python for data analysis
Basic of python for data analysisBasic of python for data analysis
Basic of python for data analysisPramod Toraskar
 

What's hot (20)

Scientific Computing with Python - NumPy | WeiYuan
Scientific Computing with Python - NumPy | WeiYuanScientific Computing with Python - NumPy | WeiYuan
Scientific Computing with Python - NumPy | WeiYuan
 
Spark 4th Meetup Londond - Building a Product with Spark
Spark 4th Meetup Londond - Building a Product with SparkSpark 4th Meetup Londond - Building a Product with Spark
Spark 4th Meetup Londond - Building a Product with Spark
 
Rsplit apply combine
Rsplit apply combineRsplit apply combine
Rsplit apply combine
 
Grouping & Summarizing Data in R
Grouping & Summarizing Data in RGrouping & Summarizing Data in R
Grouping & Summarizing Data in R
 
Python for R Users
Python for R UsersPython for R Users
Python for R Users
 
NUMPY
NUMPY NUMPY
NUMPY
 
&#49892;&#54744;&#49444;&#44228;&#49892;&#49845;
&#49892;&#54744;&#49444;&#44228;&#49892;&#49845;&#49892;&#54744;&#49444;&#44228;&#49892;&#49845;
&#49892;&#54744;&#49444;&#44228;&#49892;&#49845;
 
Broom: Converting Statistical Models to Tidy Data Frames
Broom: Converting Statistical Models to Tidy Data FramesBroom: Converting Statistical Models to Tidy Data Frames
Broom: Converting Statistical Models to Tidy Data Frames
 
Intoduction to numpy
Intoduction to numpyIntoduction to numpy
Intoduction to numpy
 
Introduction to Pandas and Time Series Analysis [PyCon DE]
Introduction to Pandas and Time Series Analysis [PyCon DE]Introduction to Pandas and Time Series Analysis [PyCon DE]
Introduction to Pandas and Time Series Analysis [PyCon DE]
 
Stack Data structure
Stack Data structureStack Data structure
Stack Data structure
 
Morel, a Functional Query Language
Morel, a Functional Query LanguageMorel, a Functional Query Language
Morel, a Functional Query Language
 
Python Scipy Numpy
Python Scipy NumpyPython Scipy Numpy
Python Scipy Numpy
 
Python - Numpy/Pandas/Matplot Machine Learning Libraries
Python - Numpy/Pandas/Matplot Machine Learning LibrariesPython - Numpy/Pandas/Matplot Machine Learning Libraries
Python - Numpy/Pandas/Matplot Machine Learning Libraries
 
Introduction to NumPy (PyData SV 2013)
Introduction to NumPy (PyData SV 2013)Introduction to NumPy (PyData SV 2013)
Introduction to NumPy (PyData SV 2013)
 
R seminar dplyr package
R seminar dplyr packageR seminar dplyr package
R seminar dplyr package
 
Statistical inference for (Python) Data Analysis. An introduction.
Statistical inference for (Python) Data Analysis. An introduction.Statistical inference for (Python) Data Analysis. An introduction.
Statistical inference for (Python) Data Analysis. An introduction.
 
Python for R developers and data scientists
Python for R developers and data scientistsPython for R developers and data scientists
Python for R developers and data scientists
 
Basic of python for data analysis
Basic of python for data analysisBasic of python for data analysis
Basic of python for data analysis
 
Lec2
Lec2Lec2
Lec2
 

Similar to R Cheat Sheet

R programming & Machine Learning
R programming & Machine LearningR programming & Machine Learning
R programming & Machine LearningAmanBhalla14
 
Two methods for optimising cognitive model parameters
Two methods for optimising cognitive model parametersTwo methods for optimising cognitive model parameters
Two methods for optimising cognitive model parametersUniversity of Huddersfield
 
Stata cheat sheet: data processing
Stata cheat sheet: data processingStata cheat sheet: data processing
Stata cheat sheet: data processingTim Essam
 
Data Wrangling with dplyr and tidyr Cheat Sheet
Data Wrangling with dplyr and tidyr Cheat SheetData Wrangling with dplyr and tidyr Cheat Sheet
Data Wrangling with dplyr and tidyr Cheat SheetDr. Volkan OBAN
 
NOSQL and Cassandra
NOSQL and CassandraNOSQL and Cassandra
NOSQL and Cassandrarantav
 
R data mining-Time Series Analysis with R
R data mining-Time Series Analysis with RR data mining-Time Series Analysis with R
R data mining-Time Series Analysis with RDr. Volkan OBAN
 
Introducing Reactive Machine Learning
Introducing Reactive Machine LearningIntroducing Reactive Machine Learning
Introducing Reactive Machine LearningJeff Smith
 
Practical data science_public
Practical data science_publicPractical data science_public
Practical data science_publicLong Nguyen
 
R Programming.pptx
R Programming.pptxR Programming.pptx
R Programming.pptxkalai75
 
Stata Programming Cheat Sheet
Stata Programming Cheat SheetStata Programming Cheat Sheet
Stata Programming Cheat SheetLaura Hughes
 
Intro to tsql unit 10
Intro to tsql   unit 10Intro to tsql   unit 10
Intro to tsql unit 10Syed Asrarali
 
Mini-lab 1: Stochastic Gradient Descent classifier, Optimizing Logistic Regre...
Mini-lab 1: Stochastic Gradient Descent classifier, Optimizing Logistic Regre...Mini-lab 1: Stochastic Gradient Descent classifier, Optimizing Logistic Regre...
Mini-lab 1: Stochastic Gradient Descent classifier, Optimizing Logistic Regre...Yao Yao
 
2014.06.24.what is ubix
2014.06.24.what is ubix2014.06.24.what is ubix
2014.06.24.what is ubixJim Cooley
 
Scala collections api expressivity and brevity upgrade from java
Scala collections api  expressivity and brevity upgrade from javaScala collections api  expressivity and brevity upgrade from java
Scala collections api expressivity and brevity upgrade from javaIndicThreads
 

Similar to R Cheat Sheet (20)

R programming & Machine Learning
R programming & Machine LearningR programming & Machine Learning
R programming & Machine Learning
 
Two methods for optimising cognitive model parameters
Two methods for optimising cognitive model parametersTwo methods for optimising cognitive model parameters
Two methods for optimising cognitive model parameters
 
R Language Introduction
R Language IntroductionR Language Introduction
R Language Introduction
 
Stata cheat sheet: data processing
Stata cheat sheet: data processingStata cheat sheet: data processing
Stata cheat sheet: data processing
 
Data Wrangling with dplyr and tidyr Cheat Sheet
Data Wrangling with dplyr and tidyr Cheat SheetData Wrangling with dplyr and tidyr Cheat Sheet
Data Wrangling with dplyr and tidyr Cheat Sheet
 
NOSQL and Cassandra
NOSQL and CassandraNOSQL and Cassandra
NOSQL and Cassandra
 
R data mining-Time Series Analysis with R
R data mining-Time Series Analysis with RR data mining-Time Series Analysis with R
R data mining-Time Series Analysis with R
 
Introducing Reactive Machine Learning
Introducing Reactive Machine LearningIntroducing Reactive Machine Learning
Introducing Reactive Machine Learning
 
R Basics
R BasicsR Basics
R Basics
 
Practical data science_public
Practical data science_publicPractical data science_public
Practical data science_public
 
R Programming.pptx
R Programming.pptxR Programming.pptx
R Programming.pptx
 
Aggregate.pptx
Aggregate.pptxAggregate.pptx
Aggregate.pptx
 
Stata Programming Cheat Sheet
Stata Programming Cheat SheetStata Programming Cheat Sheet
Stata Programming Cheat Sheet
 
3 Data Structure in R
3 Data Structure in R3 Data Structure in R
3 Data Structure in R
 
Intro to tsql unit 10
Intro to tsql   unit 10Intro to tsql   unit 10
Intro to tsql unit 10
 
Data transformation-cheatsheet
Data transformation-cheatsheetData transformation-cheatsheet
Data transformation-cheatsheet
 
Mini-lab 1: Stochastic Gradient Descent classifier, Optimizing Logistic Regre...
Mini-lab 1: Stochastic Gradient Descent classifier, Optimizing Logistic Regre...Mini-lab 1: Stochastic Gradient Descent classifier, Optimizing Logistic Regre...
Mini-lab 1: Stochastic Gradient Descent classifier, Optimizing Logistic Regre...
 
Introduction to r
Introduction to rIntroduction to r
Introduction to r
 
2014.06.24.what is ubix
2014.06.24.what is ubix2014.06.24.what is ubix
2014.06.24.what is ubix
 
Scala collections api expressivity and brevity upgrade from java
Scala collections api  expressivity and brevity upgrade from javaScala collections api  expressivity and brevity upgrade from java
Scala collections api expressivity and brevity upgrade from java
 

More from Dr. Volkan OBAN

Conference Paper:IMAGE PROCESSING AND OBJECT DETECTION APPLICATION: INSURANCE...
Conference Paper:IMAGE PROCESSING AND OBJECT DETECTION APPLICATION: INSURANCE...Conference Paper:IMAGE PROCESSING AND OBJECT DETECTION APPLICATION: INSURANCE...
Conference Paper:IMAGE PROCESSING AND OBJECT DETECTION APPLICATION: INSURANCE...Dr. Volkan OBAN
 
Covid19py Python Package - Example
Covid19py  Python Package - ExampleCovid19py  Python Package - Example
Covid19py Python Package - ExampleDr. Volkan OBAN
 
Object detection with Python
Object detection with Python Object detection with Python
Object detection with Python Dr. Volkan OBAN
 
Python - Rastgele Orman(Random Forest) Parametreleri
Python - Rastgele Orman(Random Forest) ParametreleriPython - Rastgele Orman(Random Forest) Parametreleri
Python - Rastgele Orman(Random Forest) ParametreleriDr. Volkan OBAN
 
Linear Programming wi̇th R - Examples
Linear Programming wi̇th R - ExamplesLinear Programming wi̇th R - Examples
Linear Programming wi̇th R - ExamplesDr. Volkan OBAN
 
"optrees" package in R and examples.(optrees:finds optimal trees in weighted ...
"optrees" package in R and examples.(optrees:finds optimal trees in weighted ..."optrees" package in R and examples.(optrees:finds optimal trees in weighted ...
"optrees" package in R and examples.(optrees:finds optimal trees in weighted ...Dr. Volkan OBAN
 
k-means Clustering in Python
k-means Clustering in Pythonk-means Clustering in Python
k-means Clustering in PythonDr. Volkan OBAN
 
Naive Bayes Example using R
Naive Bayes Example using  R Naive Bayes Example using  R
Naive Bayes Example using R Dr. Volkan OBAN
 
k-means Clustering and Custergram with R
k-means Clustering and Custergram with Rk-means Clustering and Custergram with R
k-means Clustering and Custergram with RDr. Volkan OBAN
 
Data Science and its Relationship to Big Data and Data-Driven Decision Making
Data Science and its Relationship to Big Data and Data-Driven Decision MakingData Science and its Relationship to Big Data and Data-Driven Decision Making
Data Science and its Relationship to Big Data and Data-Driven Decision MakingDr. Volkan OBAN
 
Data Visualization with R.ggplot2 and its extensions examples.
Data Visualization with R.ggplot2 and its extensions examples.Data Visualization with R.ggplot2 and its extensions examples.
Data Visualization with R.ggplot2 and its extensions examples.Dr. Volkan OBAN
 
Scikit-learn Cheatsheet-Python
Scikit-learn Cheatsheet-PythonScikit-learn Cheatsheet-Python
Scikit-learn Cheatsheet-PythonDr. Volkan OBAN
 
Python Pandas for Data Science cheatsheet
Python Pandas for Data Science cheatsheet Python Pandas for Data Science cheatsheet
Python Pandas for Data Science cheatsheet Dr. Volkan OBAN
 
Pandas,scipy,numpy cheatsheet
Pandas,scipy,numpy cheatsheetPandas,scipy,numpy cheatsheet
Pandas,scipy,numpy cheatsheetDr. Volkan OBAN
 
ReporteRs package in R. forming powerpoint documents-an example
ReporteRs package in R. forming powerpoint documents-an exampleReporteRs package in R. forming powerpoint documents-an example
ReporteRs package in R. forming powerpoint documents-an exampleDr. Volkan OBAN
 
ReporteRs package in R. forming powerpoint documents-an example
ReporteRs package in R. forming powerpoint documents-an exampleReporteRs package in R. forming powerpoint documents-an example
ReporteRs package in R. forming powerpoint documents-an exampleDr. Volkan OBAN
 
R-ggplot2 package Examples
R-ggplot2 package ExamplesR-ggplot2 package Examples
R-ggplot2 package ExamplesDr. Volkan OBAN
 
R Machine Learning packages( generally used)
R Machine Learning packages( generally used)R Machine Learning packages( generally used)
R Machine Learning packages( generally used)Dr. Volkan OBAN
 
treemap package in R and examples.
treemap package in R and examples.treemap package in R and examples.
treemap package in R and examples.Dr. Volkan OBAN
 

More from Dr. Volkan OBAN (20)

Conference Paper:IMAGE PROCESSING AND OBJECT DETECTION APPLICATION: INSURANCE...
Conference Paper:IMAGE PROCESSING AND OBJECT DETECTION APPLICATION: INSURANCE...Conference Paper:IMAGE PROCESSING AND OBJECT DETECTION APPLICATION: INSURANCE...
Conference Paper:IMAGE PROCESSING AND OBJECT DETECTION APPLICATION: INSURANCE...
 
Covid19py Python Package - Example
Covid19py  Python Package - ExampleCovid19py  Python Package - Example
Covid19py Python Package - Example
 
Object detection with Python
Object detection with Python Object detection with Python
Object detection with Python
 
Python - Rastgele Orman(Random Forest) Parametreleri
Python - Rastgele Orman(Random Forest) ParametreleriPython - Rastgele Orman(Random Forest) Parametreleri
Python - Rastgele Orman(Random Forest) Parametreleri
 
Linear Programming wi̇th R - Examples
Linear Programming wi̇th R - ExamplesLinear Programming wi̇th R - Examples
Linear Programming wi̇th R - Examples
 
"optrees" package in R and examples.(optrees:finds optimal trees in weighted ...
"optrees" package in R and examples.(optrees:finds optimal trees in weighted ..."optrees" package in R and examples.(optrees:finds optimal trees in weighted ...
"optrees" package in R and examples.(optrees:finds optimal trees in weighted ...
 
k-means Clustering in Python
k-means Clustering in Pythonk-means Clustering in Python
k-means Clustering in Python
 
Naive Bayes Example using R
Naive Bayes Example using  R Naive Bayes Example using  R
Naive Bayes Example using R
 
R forecasting Example
R forecasting ExampleR forecasting Example
R forecasting Example
 
k-means Clustering and Custergram with R
k-means Clustering and Custergram with Rk-means Clustering and Custergram with R
k-means Clustering and Custergram with R
 
Data Science and its Relationship to Big Data and Data-Driven Decision Making
Data Science and its Relationship to Big Data and Data-Driven Decision MakingData Science and its Relationship to Big Data and Data-Driven Decision Making
Data Science and its Relationship to Big Data and Data-Driven Decision Making
 
Data Visualization with R.ggplot2 and its extensions examples.
Data Visualization with R.ggplot2 and its extensions examples.Data Visualization with R.ggplot2 and its extensions examples.
Data Visualization with R.ggplot2 and its extensions examples.
 
Scikit-learn Cheatsheet-Python
Scikit-learn Cheatsheet-PythonScikit-learn Cheatsheet-Python
Scikit-learn Cheatsheet-Python
 
Python Pandas for Data Science cheatsheet
Python Pandas for Data Science cheatsheet Python Pandas for Data Science cheatsheet
Python Pandas for Data Science cheatsheet
 
Pandas,scipy,numpy cheatsheet
Pandas,scipy,numpy cheatsheetPandas,scipy,numpy cheatsheet
Pandas,scipy,numpy cheatsheet
 
ReporteRs package in R. forming powerpoint documents-an example
ReporteRs package in R. forming powerpoint documents-an exampleReporteRs package in R. forming powerpoint documents-an example
ReporteRs package in R. forming powerpoint documents-an example
 
ReporteRs package in R. forming powerpoint documents-an example
ReporteRs package in R. forming powerpoint documents-an exampleReporteRs package in R. forming powerpoint documents-an example
ReporteRs package in R. forming powerpoint documents-an example
 
R-ggplot2 package Examples
R-ggplot2 package ExamplesR-ggplot2 package Examples
R-ggplot2 package Examples
 
R Machine Learning packages( generally used)
R Machine Learning packages( generally used)R Machine Learning packages( generally used)
R Machine Learning packages( generally used)
 
treemap package in R and examples.
treemap package in R and examples.treemap package in R and examples.
treemap package in R and examples.
 

Recently uploaded

From idea to production in a day – Leveraging Azure ML and Streamlit to build...
From idea to production in a day – Leveraging Azure ML and Streamlit to build...From idea to production in a day – Leveraging Azure ML and Streamlit to build...
From idea to production in a day – Leveraging Azure ML and Streamlit to build...Florian Roscheck
 
Call Us ➥97111√47426🤳Call Girls in Aerocity (Delhi NCR)
Call Us ➥97111√47426🤳Call Girls in Aerocity (Delhi NCR)Call Us ➥97111√47426🤳Call Girls in Aerocity (Delhi NCR)
Call Us ➥97111√47426🤳Call Girls in Aerocity (Delhi NCR)jennyeacort
 
Predicting Salary Using Data Science: A Comprehensive Analysis.pdf
Predicting Salary Using Data Science: A Comprehensive Analysis.pdfPredicting Salary Using Data Science: A Comprehensive Analysis.pdf
Predicting Salary Using Data Science: A Comprehensive Analysis.pdfBoston Institute of Analytics
 
Indian Call Girls in Abu Dhabi O5286O24O8 Call Girls in Abu Dhabi By Independ...
Indian Call Girls in Abu Dhabi O5286O24O8 Call Girls in Abu Dhabi By Independ...Indian Call Girls in Abu Dhabi O5286O24O8 Call Girls in Abu Dhabi By Independ...
Indian Call Girls in Abu Dhabi O5286O24O8 Call Girls in Abu Dhabi By Independ...dajasot375
 
EMERCE - 2024 - AMSTERDAM - CROSS-PLATFORM TRACKING WITH GOOGLE ANALYTICS.pptx
EMERCE - 2024 - AMSTERDAM - CROSS-PLATFORM  TRACKING WITH GOOGLE ANALYTICS.pptxEMERCE - 2024 - AMSTERDAM - CROSS-PLATFORM  TRACKING WITH GOOGLE ANALYTICS.pptx
EMERCE - 2024 - AMSTERDAM - CROSS-PLATFORM TRACKING WITH GOOGLE ANALYTICS.pptxthyngster
 
1:1定制(UQ毕业证)昆士兰大学毕业证成绩单修改留信学历认证原版一模一样
1:1定制(UQ毕业证)昆士兰大学毕业证成绩单修改留信学历认证原版一模一样1:1定制(UQ毕业证)昆士兰大学毕业证成绩单修改留信学历认证原版一模一样
1:1定制(UQ毕业证)昆士兰大学毕业证成绩单修改留信学历认证原版一模一样vhwb25kk
 
Consent & Privacy Signals on Google *Pixels* - MeasureCamp Amsterdam 2024
Consent & Privacy Signals on Google *Pixels* - MeasureCamp Amsterdam 2024Consent & Privacy Signals on Google *Pixels* - MeasureCamp Amsterdam 2024
Consent & Privacy Signals on Google *Pixels* - MeasureCamp Amsterdam 2024thyngster
 
Call Girls In Dwarka 9654467111 Escorts Service
Call Girls In Dwarka 9654467111 Escorts ServiceCall Girls In Dwarka 9654467111 Escorts Service
Call Girls In Dwarka 9654467111 Escorts ServiceSapana Sha
 
办理学位证纽约大学毕业证(NYU毕业证书)原版一比一
办理学位证纽约大学毕业证(NYU毕业证书)原版一比一办理学位证纽约大学毕业证(NYU毕业证书)原版一比一
办理学位证纽约大学毕业证(NYU毕业证书)原版一比一fhwihughh
 
Top 5 Best Data Analytics Courses In Queens
Top 5 Best Data Analytics Courses In QueensTop 5 Best Data Analytics Courses In Queens
Top 5 Best Data Analytics Courses In Queensdataanalyticsqueen03
 
High Class Call Girls Noida Sector 39 Aarushi 🔝8264348440🔝 Independent Escort...
High Class Call Girls Noida Sector 39 Aarushi 🔝8264348440🔝 Independent Escort...High Class Call Girls Noida Sector 39 Aarushi 🔝8264348440🔝 Independent Escort...
High Class Call Girls Noida Sector 39 Aarushi 🔝8264348440🔝 Independent Escort...soniya singh
 
ASML's Taxonomy Adventure by Daniel Canter
ASML's Taxonomy Adventure by Daniel CanterASML's Taxonomy Adventure by Daniel Canter
ASML's Taxonomy Adventure by Daniel Cantervoginip
 
INTERNSHIP ON PURBASHA COMPOSITE TEX LTD
INTERNSHIP ON PURBASHA COMPOSITE TEX LTDINTERNSHIP ON PURBASHA COMPOSITE TEX LTD
INTERNSHIP ON PURBASHA COMPOSITE TEX LTDRafezzaman
 
Beautiful Sapna Vip Call Girls Hauz Khas 9711199012 Call /Whatsapps
Beautiful Sapna Vip  Call Girls Hauz Khas 9711199012 Call /WhatsappsBeautiful Sapna Vip  Call Girls Hauz Khas 9711199012 Call /Whatsapps
Beautiful Sapna Vip Call Girls Hauz Khas 9711199012 Call /Whatsappssapnasaifi408
 
Advanced Machine Learning for Business Professionals
Advanced Machine Learning for Business ProfessionalsAdvanced Machine Learning for Business Professionals
Advanced Machine Learning for Business ProfessionalsVICTOR MAESTRE RAMIREZ
 
Call Girls in Defence Colony Delhi 💯Call Us 🔝8264348440🔝
Call Girls in Defence Colony Delhi 💯Call Us 🔝8264348440🔝Call Girls in Defence Colony Delhi 💯Call Us 🔝8264348440🔝
Call Girls in Defence Colony Delhi 💯Call Us 🔝8264348440🔝soniya singh
 
IMA MSN - Medical Students Network (2).pptx
IMA MSN - Medical Students Network (2).pptxIMA MSN - Medical Students Network (2).pptx
IMA MSN - Medical Students Network (2).pptxdolaknnilon
 
专业一比一美国俄亥俄大学毕业证成绩单pdf电子版制作修改
专业一比一美国俄亥俄大学毕业证成绩单pdf电子版制作修改专业一比一美国俄亥俄大学毕业证成绩单pdf电子版制作修改
专业一比一美国俄亥俄大学毕业证成绩单pdf电子版制作修改yuu sss
 

Recently uploaded (20)

From idea to production in a day – Leveraging Azure ML and Streamlit to build...
From idea to production in a day – Leveraging Azure ML and Streamlit to build...From idea to production in a day – Leveraging Azure ML and Streamlit to build...
From idea to production in a day – Leveraging Azure ML and Streamlit to build...
 
Call Us ➥97111√47426🤳Call Girls in Aerocity (Delhi NCR)
Call Us ➥97111√47426🤳Call Girls in Aerocity (Delhi NCR)Call Us ➥97111√47426🤳Call Girls in Aerocity (Delhi NCR)
Call Us ➥97111√47426🤳Call Girls in Aerocity (Delhi NCR)
 
Predicting Salary Using Data Science: A Comprehensive Analysis.pdf
Predicting Salary Using Data Science: A Comprehensive Analysis.pdfPredicting Salary Using Data Science: A Comprehensive Analysis.pdf
Predicting Salary Using Data Science: A Comprehensive Analysis.pdf
 
Indian Call Girls in Abu Dhabi O5286O24O8 Call Girls in Abu Dhabi By Independ...
Indian Call Girls in Abu Dhabi O5286O24O8 Call Girls in Abu Dhabi By Independ...Indian Call Girls in Abu Dhabi O5286O24O8 Call Girls in Abu Dhabi By Independ...
Indian Call Girls in Abu Dhabi O5286O24O8 Call Girls in Abu Dhabi By Independ...
 
EMERCE - 2024 - AMSTERDAM - CROSS-PLATFORM TRACKING WITH GOOGLE ANALYTICS.pptx
EMERCE - 2024 - AMSTERDAM - CROSS-PLATFORM  TRACKING WITH GOOGLE ANALYTICS.pptxEMERCE - 2024 - AMSTERDAM - CROSS-PLATFORM  TRACKING WITH GOOGLE ANALYTICS.pptx
EMERCE - 2024 - AMSTERDAM - CROSS-PLATFORM TRACKING WITH GOOGLE ANALYTICS.pptx
 
Deep Generative Learning for All - The Gen AI Hype (Spring 2024)
Deep Generative Learning for All - The Gen AI Hype (Spring 2024)Deep Generative Learning for All - The Gen AI Hype (Spring 2024)
Deep Generative Learning for All - The Gen AI Hype (Spring 2024)
 
1:1定制(UQ毕业证)昆士兰大学毕业证成绩单修改留信学历认证原版一模一样
1:1定制(UQ毕业证)昆士兰大学毕业证成绩单修改留信学历认证原版一模一样1:1定制(UQ毕业证)昆士兰大学毕业证成绩单修改留信学历认证原版一模一样
1:1定制(UQ毕业证)昆士兰大学毕业证成绩单修改留信学历认证原版一模一样
 
Consent & Privacy Signals on Google *Pixels* - MeasureCamp Amsterdam 2024
Consent & Privacy Signals on Google *Pixels* - MeasureCamp Amsterdam 2024Consent & Privacy Signals on Google *Pixels* - MeasureCamp Amsterdam 2024
Consent & Privacy Signals on Google *Pixels* - MeasureCamp Amsterdam 2024
 
Call Girls In Dwarka 9654467111 Escorts Service
Call Girls In Dwarka 9654467111 Escorts ServiceCall Girls In Dwarka 9654467111 Escorts Service
Call Girls In Dwarka 9654467111 Escorts Service
 
Call Girls in Saket 99530🔝 56974 Escort Service
Call Girls in Saket 99530🔝 56974 Escort ServiceCall Girls in Saket 99530🔝 56974 Escort Service
Call Girls in Saket 99530🔝 56974 Escort Service
 
办理学位证纽约大学毕业证(NYU毕业证书)原版一比一
办理学位证纽约大学毕业证(NYU毕业证书)原版一比一办理学位证纽约大学毕业证(NYU毕业证书)原版一比一
办理学位证纽约大学毕业证(NYU毕业证书)原版一比一
 
Top 5 Best Data Analytics Courses In Queens
Top 5 Best Data Analytics Courses In QueensTop 5 Best Data Analytics Courses In Queens
Top 5 Best Data Analytics Courses In Queens
 
High Class Call Girls Noida Sector 39 Aarushi 🔝8264348440🔝 Independent Escort...
High Class Call Girls Noida Sector 39 Aarushi 🔝8264348440🔝 Independent Escort...High Class Call Girls Noida Sector 39 Aarushi 🔝8264348440🔝 Independent Escort...
High Class Call Girls Noida Sector 39 Aarushi 🔝8264348440🔝 Independent Escort...
 
ASML's Taxonomy Adventure by Daniel Canter
ASML's Taxonomy Adventure by Daniel CanterASML's Taxonomy Adventure by Daniel Canter
ASML's Taxonomy Adventure by Daniel Canter
 
INTERNSHIP ON PURBASHA COMPOSITE TEX LTD
INTERNSHIP ON PURBASHA COMPOSITE TEX LTDINTERNSHIP ON PURBASHA COMPOSITE TEX LTD
INTERNSHIP ON PURBASHA COMPOSITE TEX LTD
 
Beautiful Sapna Vip Call Girls Hauz Khas 9711199012 Call /Whatsapps
Beautiful Sapna Vip  Call Girls Hauz Khas 9711199012 Call /WhatsappsBeautiful Sapna Vip  Call Girls Hauz Khas 9711199012 Call /Whatsapps
Beautiful Sapna Vip Call Girls Hauz Khas 9711199012 Call /Whatsapps
 
Advanced Machine Learning for Business Professionals
Advanced Machine Learning for Business ProfessionalsAdvanced Machine Learning for Business Professionals
Advanced Machine Learning for Business Professionals
 
Call Girls in Defence Colony Delhi 💯Call Us 🔝8264348440🔝
Call Girls in Defence Colony Delhi 💯Call Us 🔝8264348440🔝Call Girls in Defence Colony Delhi 💯Call Us 🔝8264348440🔝
Call Girls in Defence Colony Delhi 💯Call Us 🔝8264348440🔝
 
IMA MSN - Medical Students Network (2).pptx
IMA MSN - Medical Students Network (2).pptxIMA MSN - Medical Students Network (2).pptx
IMA MSN - Medical Students Network (2).pptx
 
专业一比一美国俄亥俄大学毕业证成绩单pdf电子版制作修改
专业一比一美国俄亥俄大学毕业证成绩单pdf电子版制作修改专业一比一美国俄亥俄大学毕业证成绩单pdf电子版制作修改
专业一比一美国俄亥俄大学毕业证成绩单pdf电子版制作修改
 

R Cheat Sheet

  • 1. 1 www.quandl.com R Cheat Sheet Vector and Matrix Operations Construction c() cbind() rbind() matrix() Concatenate Column Concatenate Row Concatenate Create matrix v <- c(1,2,3,4) # 1 2 3 4 cbind(v,v) # 2 Columns rbind(v,v) # 2 Rows mat <- matrix(v,nrow=2,ncol=2) Selection v[1] tail(v,1) mat[2,1] mat[1,] mat[,2] v[c(1,3)] v[-c(1,3)] mat[,c(1,2)] mat[,1:5] mat[,“col”] Utility length() dim() sort() order() names() Length of vector Dimensions of vector/matrix/dataframe Sorts vector Index to sort vector e.g. sort(v) == v[order(v)] Names of columns Select first Select last Select row 2, column 1 Select row 1 Select column 2 Select the first and third values Select all but the first and third values Select columns 1 and 2 Select columns 1 to 5 Select column named “col” Basic Syntax # <- or = <<- v[1] * %*% / %/% %% Comments Assignment Global Assignment First element in a vector Scalar Multiplication Matrix Multiplication Division Integer Division Remainder # This is not interpreted a <- 1; b = 2 a <<- 10 # Not recommended v[1] c(1,1)*c(1,1) # 1 1 c(1,1)%*%c(1,1) # 2 1/2 # 0.5 1%/%2 # 0 7%%6 # 1 Example
  • 2. 2 www.quandl.com Time Series Time Series Classes ts(data, frequency) zoo(data, index) xts(data, index) tis() irts() timeSeries() Structures data.frame(…) list(name=var) ts(data, frequency) Tests The package tseries is required for a most of these functions adf.test jarque.bera.test kpss.test po.test pp.test runs.test terasvirta.test white.test box.test From R base, handles regularly spaced time series Part of the zoo package, handles irregularily spaced data using arbitrary time date classes Modification to zoo, gives more power to selecting date subsets Uses POSIXct time stamps From the package tseries and uses POSIXct time stamps Uses timeDate time stamps Computes the Augmented Dickey-Fuller test for the null that the series has a unit root Tests the null of normaility for the series using the Jarque-Bera test statistics Computes the KPSS test for the null that the series is level or trend stationary Computes the Phillips-Ouliaris test for the null that the series in not cointegrated Computes the Phillips-Perron test for the null that the series has a unit root Computes the runs test for randomness of the binary series Generically computes Teraesvirta’s neural network test for neglected nonlinearity for the time series Generically computes the White neural network test for neglected nonlinearity for the time series Compute the Box-Pierce or Ljung-Box test statistics for examining the null of independence in a given series Takes multiple variables with the same number of rows and creates a dataframe R’s implementation of a hash, takes multiple variables or variable tag pairs Creates a regularly spaced time series object Apply apply(data, axis, fun) lapply(data, fun) tapply(data, index, fun) I/O read.table(“filename”, sep=”,”) read.csv() fromJSON() xmlTreeParse() write.csv() Apply the function fun to data along axis Apply the function fun to the list or vector data Apply the function fun to data along the list of factors index Reads information in from file with a variable delimiter Read csv file into dataframe Read JSON formatted file or string into a list - Requires RJSONIO Read XML formatted file or string into a list - Requires XML Writes a dataframe or matrix (or tries to convert input to one) and writes to csv For a great introduction to using apply see this article.
  • 3. 3 www.quandl.com Quandl is a search engine for numerical data, alowing easy access to financial, social, and demographic data from hundreds of sources. Quandl The Quandl package enables Quandl API access from within R which makes acquiring and manipulating numerical data as quick and easy as possible. In your first Quandl function call you should specifiy your authtoken (found on Quandl’s website after signing up) to avoid certain API call limits. See www.quandl.com/help/packages/R for more. Models The package forecast is required for some of these functions ar() ma() arima() auto.arima() ets() HoltWinters() forecast(model, n) Utility index() coredata() lag(ts, n) diff(ts, n) acf() or Acf() pacf() or Pacf() ndiff() accuracy() Fits an autoregressive model Fits a simple moving average model Fits an arima model with specified parameters Automatically fits an arima model Fits an exponential smoothing model Computes Holt-Winters Filtering of a given time series Forecasts the next n points from the time series model Returns the index (dates) of the time series Returns a matrix of data from the time series sans index Returns the time series shifted n times Returns the time series differences n times Returns the autocorrelation function of the time series (Acf() from the forecast package) Returns the partial autocorrelation function of the time series (Pacf() from the forecast package) Returns the number of differences needed for a time series to have stationarity Computes the accuracy of a time series model Decomposition decompose() filter() stl() Decompoes the series into seasonal, trend and irregular components using moving averages Applies a linear filter to a series Decomposes the series into seasonal, trend and irregular components using loess methods shapiro.test ks.test punitroot Test for normality Test for specified distribution Computes the cumulative probability of MacKinnon’s unit root tes statistic Quandl.auth(“AUTHETICATION_TOKEN”) Quandl(“QUANDL/CODE”) Quandl.search(“query”) Call this first to increase your daily limit Download Quandl data for a certain Quandl code as a data frame Search Quandl. Prints first three outputs to screen, returns all in a list.
  • 4. 4 www.quandl.com Plotting plot(ts) title(main, sub, xlab, ylab) ggplot() aes() geom_line() geom_boxplot() xlab() ylab() ggtitle() theme() R base plot function Adds labels to the currently open plot Creates a ggplot object Creates a properly formatted list of variables for use in ggplot Plots data with a line connecting them Plots data in the form of box and whiskers plot Edit the x axis label Edit the y axis label Edit the plot title Modify a large number of options for the plot from grid elements to colors Aside from the built in plotting function in R, ggplot2 is a very powerful plotting package. See http://docs.ggplot2.org/current/ for complete documentation. Plotting example with ggplot2 library(Quandl) library(ggplot2) data_series <- Quandl(“GOOG/NASDAQ_AAPL”, start_date=”2005-01-01”)[,c(1,5)] my.plot <- ggplot(data=data_series, aes(x=Date, y=Close)) + geom_line(color=”#FAB521”) + # Adding a colored line theme(panel.background = element_rect(fill=’#393939’), panel.grid.major.x = element_blank(), panel.grid.major.y = element_line(colour=’white’, size=0.1), panel.grid.minor = element_line(colour=’white’, size=0.1)) + # modifying background color # and grid options xlab(“Date”) + ylab(“Closing Price”) + ggtitle(“AAPL”) # Adding titles my.plot # Generates the plot