
Recommended
Recommended
More Related Content
Recently uploaded
Recently uploaded (20)
Featured
Featured (20)
Reproductive healthpolicies2014 wallchart
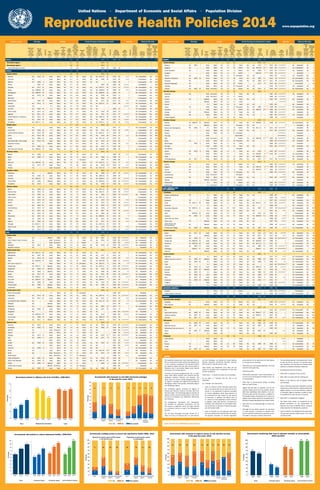
- 1. United Nations • Department of Economic and Social Affairs • Population Division Reproductive Health Policies 2014 Country or Area Marriage Fertility Family Planning and Reproductive Health Abortion Maternal Mortality Measures to end child and forced marriages Women aged 20-24 married by age 18 Footnotes Policy on fertility Concern about adolescent fertility Policies to reduce ado- lescent fertility Total fertility (births per woman) Ado- lescent birth rate (births per 1,000 women aged 15-19) Support for family planning Pro- grammes to ensure youth’s access to contra- ception Mea- sures to increase access to SRH services Unmet need for family planning Footnotes Births attended by skilled health staff Legal grounds for abortion Footnotes Mea- sures to improve access to safe abortion services View on maternal mortality Preven- tion of maternal mortal- ity as a national priority Maternal mortality ratio (per 100,000 live births) 2012 Year % 2013 2013 2013 2010–15 2010–15 2013 2012 2012 Year % Year % 2013 2012 2013 2012 2013 WORLD — ... ... — — — 2.5 45 — — — 2013 12 2010 67 — — — — 210 Developed regions — ... ... — — — 1.7 19 — — — 2013 10 ... ... — — — — ... Developing regions — ... ... — — — 2.6 49 — — — 2013 12 ... ... — — — — ... Least developed countries — ... ... — — — 4.2 96 — — — 2013 23 2010 46 — — — — ... AFRICA — ... ... — — — 4.7 98 — — — 2013 23 ... ... — — — — 500 Eastern Africa — ... ... — — — 4.9 99 — — — 2013 26 ... ... — — — — ... Burundi Yes 2010 20 Lower Minor Yes 6.1 30 Direct Yes Yes 2010-11 32 2010 60 1,2,3 No Unacceptable Yes 740 Comoros Yes ... ... Lower Major Yes 4.7 51 Direct Yes Yes 1996 36 2012 82 1,2,3 ... Unacceptable No 350 Djibouti Yes 2006 5 Lower Minor Yes 3.4 19 Direct No Yes ... ... 2006 93 1 ... Unacceptable No 230 Eritrea ... 2002 47 Lower Major Yes 4.7 65 Direct ... ... 2002 29 2002 28 1,2,3,4,5 ... Unacceptable ... 380 Ethiopia Yes 2011 41 Lower Major Yes 4.6 78 Direct Yes Yes 2010-11 26 2011 10 1,2,3,4,5 Yes Unacceptable No 420 Kenya Yes 2008-09 26 Lower Major Yes 4.4 94 Direct Yes Yes 2008-09 26 2009 44 1,2,3 1 No Unacceptable No 400 Madagascar Yes 2008-09 48 Lower Major Yes 4.5 123 Direct Yes Yes 2008-09 19 2009 44 1 2 Yes Unacceptable No 440 Malawi Yes 2010 50 Lower Major Yes 5.4 145 Direct Yes Yes 2010 26 2010 71 1 2 ... Unacceptable Yes 510 Mauritius Yes ... ... Maintain Major Yes 1.5 31 Direct Yes Yes 2002 4 3 2005 99 1 2 ... Unacceptable Yes 73 Mozambique ... 2009 56 Lower Major Yes 5.2 138 Direct Yes Yes 2011 29 2011 54 1,2,3 No Unacceptable No 480 Rwanda Yes 2010 8 Lower Major Yes 4.6 34 Direct Yes Yes 2010-11 21 2010 69 1,2,3 Yes Unacceptable No 320 Seychelles No ... ... N. I. Major Yes 2.2 56 Direct Yes Yes ... ... ... ... 1,2,3,4,5 Yes Acceptable No ... Somalia Yes 2006 45 N. I. Major Yes 6.6 110 Indirect No No ... ... 2006 33 1 2 No Unacceptable No 850 South Sudan Yes 2010 52 4 Lower Major Yes 5.0 75 Direct No No 2010 26 5 2010 19 ... No Unacceptable No 730 Uganda Yes 2011 40 Lower Major Yes 5.9 127 Direct Yes Yes 2011 34 2011 57 1,2,3,4,5 1 Yes Unacceptable Yes 360 United Republic of Tanzania Yes 2010 37 Lower Major Yes 5.2 123 Direct Yes Yes 2009-10 25 2010 49 1,2,3 1 No Unacceptable Yes 410 Zambia Yes 2007 42 Lower Major Yes 5.7 125 Direct Yes Yes 2007 27 2007 47 1,2,3,5,6 Yes Unacceptable Yes 280 Zimbabwe Yes 2010-11 31 Lower Major Yes 3.5 60 Direct Yes Yes 2010-11 15 2011 66 1,2,4,5 ... Unacceptable Yes 470 Middle Africa — ... ... — — — 5.7 137 — — — 2013 26 ... ... — — — — ... Angola Yes ... ... Lower Major Yes 5.9 170 Direct Yes Yes ... ... 2007 47 1 2 Yes Unacceptable No 460 Cameroon Yes 2006 36 N. I. Major Yes 4.8 116 Direct Yes Yes 2011 24 2011 64 1,2,3,4 ... Unacceptable No 590 Central African Republic Yes 2010 68 4 Lower Major Yes 4.4 98 Direct No No 2010-11 27 5 2010 54 1 2 No Unacceptable Yes 880 Chad Yes 2010 68 Lower Major Yes 6.3 152 Direct Yes Yes 2010 28 5 2010 23 1,2,5 No Unacceptable No 980 Congo Yes 2009 33 Lower Major Yes 5.0 127 Direct Yes Yes 2011-12 18 2012 94 1 2 ... Unacceptable No 410 Democratic Rep. of the Congo Yes 2010 39 Lower Major Yes 6.0 135 Direct Yes Yes 2010 24 5 2010 80 1 2 ... Unacceptable No 730 Equatorial Guinea Yes ... ... Maintain Major Yes 4.9 113 Direct Yes Yes 2011 34 2000 65 1,2,3 No Unacceptable Yes 290 Gabon No 2000 34 Raise Minor Yes 4.1 103 Direct Yes Yes 2012 27 2012 89 1 2 ... Unacceptable No 240 São Tomé and Príncipe Yes 2008-09 34 Lower Major Yes 4.1 65 Direct Yes Yes 2008-09 38 2009 82 1 2 No Unacceptable Yes 210 Northern Africa — ... ... — — — 3.0 42 — — — 2013 15 ... ... — — — — ... Algeria Yes 2006 2 Lower Major Yes 2.8 10 Direct No Yes ... ... 2006 95 1,2,3 ... Unacceptable No 89 Egypt Yes 2008 17 Lower Minor Yes 2.8 43 Direct Yes Yes 2008 12 2008 79 1 No Unacceptable No 45 Libya ... ... ... N. I. Minor Yes 2.4 3 No support ... ... 2007 27 2008 100 1 ... Unacceptable ... 15 Morocco No 2003-04 16 Lower Minor Yes 2.8 36 Direct No No 2010-11 11 2011 74 1,2,3 No Unacceptable Yes 120 Sudan No 2010 33 4 Lower Minor ... 4.5 84 Direct No Yes 2010 29 4,6 2010 23 1,4,5 Yes Unacceptable No 360 Tunisia No ... ... Lower No concern No 2.0 5 Direct Yes Yes 2011-12 7 5 2012 99 1,2,3,4,5,6,7 Yes Unacceptable No 46 Southern Africa — ... ... — — — 2.5 53 — — — 2013 13 ... ... — — — — ... Botswana Yes ... ... Maintain Minor Yes 2.6 44 Direct Yes Yes 1988 27 2007 95 1,2,3,4,5 Yes Unacceptable No 170 Lesotho Yes 2009 19 Lower Major Yes 3.1 89 Direct Yes Yes 2009-10 23 2009 62 1 No Unacceptable No 490 Namibia Yes 2006-07 9 Lower Major Yes 3.1 55 Direct Yes Yes 2006-07 21 2007 81 1,2,3,4,5 Yes Unacceptable No 130 South Africa Yes 2003 6 Maintain Major Yes 2.4 51 Direct Yes Yes 2003-04 14 2003 91 1,2,3,4,5,6,7 No Unacceptable Yes 140 Swaziland Yes 2010 7 Lower Major Yes 3.4 72 Direct Yes Yes 2010 13 5 2010 82 1,2,3,4,5 Yes Unacceptable Yes 310 Western Africa — ... ... — — — 5.6 119 — — — 2013 25 ... ... — — — — ... Benin Yes 2006 34 Lower Major Yes 4.9 90 Direct Yes Yes 2011-12 33 2012 84 1,2,3,4,5 ... Unacceptable No 340 Burkina Faso Yes 2010 52 Lower Major Yes 5.6 115 Direct Yes Yes 2010-11 25 2010 66 1,2,3,4,5 ... Unacceptable No 400 Cabo Verde No 2005 18 Lower Major Yes 2.3 71 Direct Yes Yes 2005 17 2005 78 1,2,3,4,5,6,7 Yes Acceptable No 53 Côte d'Ivoire Yes 2005 35 Lower Major Yes 4.9 130 Direct Yes Yes 2011-12 22 2012 59 1 ... Unacceptable Yes 720 Gambia Yes 2010 36 4 Lower Major Yes 5.8 116 Direct Yes Yes 2010 22 5 2010 57 1,2,3 1 Yes Unacceptable Yes 430 Ghana Yes 2011 21 4 Lower Major Yes 3.9 58 Direct Yes Yes 2013 37 2011 68 1,2,3,4,5 Yes Unacceptable No 380 Guinea Yes 2005 63 Lower Minor Yes 5.0 131 Direct Yes Yes 2005 22 2012 45 1,2,3,4,5 Yes Unacceptable Yes 650 Guinea-Bissau Yes 2010 22 4 Lower Major Yes 5.0 99 Direct Yes Yes 2010 6 5 2010 43 1 2 Yes Unacceptable Yes 560 Liberia Yes 2007 38 Lower Major Yes 4.8 117 Direct Yes Yes 2007 36 2007 46 1,2,3,4,5 No Unacceptable No 640 Mali Yes 2010 55 4 Lower Major Yes 6.9 176 Direct Yes Yes 2006 28 2010 56 1,4 2 ... Unacceptable Yes 550 Mauritania Yes 2007 35 Lower Minor Yes 4.7 73 Direct Yes Yes 2000-01 32 2011 65 1 2 ... Unacceptable No 320 Niger No 2006 75 Lower Major Yes 7.6 205 Direct Yes Yes 2012 16 2012 29 1,2,3,5 ... Unacceptable No 630 Nigeria Yes 2008 39 Lower Major Yes 6.0 120 Direct Yes Yes 2011 19 5 2011 49 1,2,3 7 No Unacceptable Yes 560 Senegal Yes 2010-11 33 Lower Major Yes 5.0 94 Direct Yes Yes 2012-13 29 2011 65 1 ... Unacceptable No 320 Sierra Leone Yes 2010 44 Lower Major Yes 4.7 101 Direct Yes Yes 2010 27 5 2010 63 1,2,3 1 No Unacceptable No 1100 Togo Yes 2010 25 Lower Major Yes 4.7 92 Direct Yes Yes 2010 37 5 2010 59 1,2,4,5 Yes Unacceptable Yes 450 ASIA — ... ... — — — 2.2 29 — — — 2013 10 ... ... — — — — ... Eastern Asia — ... ... — — — 1.7 8 — — — 2013 5 ... ... — — — — ... China Yes ... ... Maintain Major Yes 1.7 9 Direct No Yes 2001 2 2012 100 1,2,3,4,5,6,7 Yes Acceptable No 32 Dem. People's Rep. of Korea Yes ... ... Raise No concern No 2.0 1 Direct No Yes 2010 15 8 2009 100 1,2,3,4,5,6,7 Yes Unacceptable No 87 Japan Yes ... ... Raise No concern No 1.4 5 Indirect ... Yes ... ... 2004 100 1,2,4,6 9 Yes Acceptable No 6 Mongolia Yes 2010 5 4 Raise Major Yes 2.4 19 Direct Yes Yes 2010 22 5 2010 99 1,2,3,4,5,6,7 Yes Unacceptable No 68 Republic of Korea Yes ... ... Raise Minor Yes 1.3 2 Direct No ... ... ... 2003 100 1,2,3,4,5 ... Acceptable No 27 South-central Asia — ... ... — — — 2.5 38 — — — 2013 ... ... ... — — — — ... Afghanistan Yes 2010-11 40 Lower Major Yes 5.0 87 Direct No Yes ... ... 2011 39 1 No Unacceptable No 400 Bangladesh Yes 2007 66 Lower Major Yes 2.2 81 Direct Yes Yes 2011 14 2011 32 1 Yes Unacceptable Yes 170 Bhutan No 2010 26 Lower Major Yes 2.3 41 Direct Yes Yes 2010 12 5 2010 65 1,3,4 Yes Unacceptable No 120 India Yes 2005-06 47 Lower Major Yes 2.5 33 Direct Yes Yes 2007-08 21 2008 52 1,2,3,4,5,6 Yes Unacceptable No 190 Iran (Islamic Republic of) Yes ... ... Raise Major Yes 1.9 32 No support Yes Yes 2010-11 6 2011 96 1,5 2 Yes Unacceptable No 23 Kazakhstan Yes 2010-11 6 Maintain Major Yes 2.4 30 Indirect Yes Yes 2010-11 12 5 2010 100 1,2,3,4,5,6,7 Yes Unacceptable Yes 26 Kyrgyzstan Yes 2006 10 Maintain Major Yes 3.1 29 Direct Yes Yes 2012 18 2012 99 1,2,3,4,5,6,7 Yes Unacceptable Yes 75 Maldives No 2009 4 Maintain Major Yes 2.3 4 Direct No No 2009 29 2009 95 1,2 No Acceptable Yes 31 Nepal Yes 2011 41 Lower Major Yes 2.3 74 Direct Yes Yes 2011 28 2011 36 1,2,3,4,5,6,7 Yes Unacceptable Yes 190 Pakistan Yes 2006-07 24 Lower Major Yes 3.2 27 Direct No Yes 2012-13 20 2012 49 1,2,3 10 Yes Unacceptable No 170 Sri Lanka Yes 2006-07 12 Maintain Minor Yes 2.4 17 Direct Yes Yes 2006-07 7 11 2007 99 1 Yes Acceptable Yes 29 Tajikistan No 2005 13 Lower Minor Yes 3.9 43 Direct Yes Yes 2012 23 2012 87 1,2,3,4,5,6,7 No Unacceptable No 44 Turkmenistan Yes 2006 7 Maintain Minor Yes 2.3 18 Direct Yes Yes 2000 13 2006 100 1,2,3,4,5,6,7 Yes Unacceptable Yes 61 Uzbekistan ... 2006 7 Maintain Minor Yes 2.3 39 Direct ... ... 1996 14 2006 100 1,2,3,4,5,6,7 ... Unacceptable ... 36 South-eastern Asia — ... ... — — — 2.2 39 — — — 2013 12 ... ... — — — — 190 Brunei Darussalam ... ... ... N. I. Major Yes 2.0 23 No support ... ... ... ... 2009 100 1 ... Acceptable ... 27 Cambodia Yes 2010 18 Lower Minor Yes 2.9 44 Direct No Yes 2010-11 17 2012 74 1,2,3,4,5,6,7 Yes Unacceptable Yes 170 Indonesia Yes 2007 22 Lower Major Yes 2.3 48 Direct Yes Yes 2012 11 2012 83 1,4,5 Yes Unacceptable No 190 Lao People’s Dem. Republic Yes ... ... Lower Major Yes 3.0 65 Direct Yes Yes 2011-12 20 2012 42 1,2 No Unacceptable No 220 Malaysia Yes ... ... Maintain Major Yes 2.0 6 Direct Yes Yes ... ... 2011 99 1,2,3 ... Acceptable No 29 Myanmar No ... ... Maintain Major Yes 2.0 12 Direct Yes Yes 2001 19 3 2010 71 1 No Unacceptable Yes 200 Philippines Yes 2008 14 Lower Major Yes 3.1 47 Direct No Yes 2011 19 2011 72 1 2 ... Unacceptable No 120 Singapore Yes ... ... Raise Minor Yes 1.3 6 Direct Yes Yes ... ... 2004 100 1,2,3,4,5,6,7 Yes Acceptable ... 6 Thailand No 2005-06 20 Raise Major Yes 1.4 41 Direct No Yes 2012 7 2009 100 1,2,3,4,5 Yes Unacceptable No 26 Timor-Leste No 2009 19 Lower Major Yes 5.9 52 Direct Yes Yes 2009-10 32 2010 29 1 No Unacceptable Yes 270 Viet Nam Yes 2011 9 Maintain Major Yes 1.8 29 Direct Yes Yes 2010-11 4 5 2011 93 1,2,3,4,5,6,7 Yes Unacceptable Yes 49 Western Asia — ... ... — — — 2.7 37 — — — 2013 16 ... ... — — — — ... Armenia Yes 2010 7 Raise Minor Yes 1.7 27 Indirect Yes Yes 2010 14 2010 100 1,2,3,4,5,6,7 Yes Unacceptable Yes 29 Azerbaijan Yes 2006 12 Raise Major Yes 1.9 40 Direct Yes Yes 2006 15 2010 99 1,2,3,4,5,6,7 Yes Unacceptable Yes 26 Bahrain Yes ... ... Lower No concern No 2.1 14 Direct Yes Yes ... ... 2009 100 1,2,3,4,5,6,7 No Acceptable No 22 Cyprus No ... ... Raise Minor Yes 1.5 5 Direct Yes Yes ... ... 2003 99 1,2,3,4,5 Yes Acceptable No 10 Georgia No 2010 14 Raise Minor Yes 1.8 47 Direct Yes Yes 2010 12 3,8 2011 100 1,2,3,4,5,6,7 Yes Unacceptable Yes 41 Iraq Yes 2006 17 Lower Major No 4.1 69 Direct No Yes 2011 8 5 2011 91 1 Yes Unacceptable No 67 Israel ... ... ... Raise Minor Yes 2.9 8 Indirect ... ... ... ... 1987 99 1,2,3,4,5 ... Acceptable No 2 Jordan Yes 2009 10 Lower Minor No 3.3 26 Direct No Yes 2012 12 2012 100 1,2,3,5 No Unacceptable Yes 50 Kuwait ... ... ... Raise Minor Yes 2.6 14 Direct No Yes ... ... 2007 100 1,2,3,5 No Acceptable No 14 Lebanon No 2009 6 N. I. Minor Yes 1.5 12 Direct Yes Yes ... ... 2004 98 1 Yes Unacceptable No 16 Oman Yes ... ... Lower Minor Yes 2.9 11 Direct No Yes 2007-08 56 12 2009 99 1,5 Yes Acceptable No 11 Qatar Yes ... ... Raise No concern No 2.1 10 Direct Yes Yes 2012 6 5 2009 100 1,2,3,5 Yes Acceptable Yes 6 Saudi Arabia ... ... ... Raise No concern No 2.7 10 No support ... ... ... ... 2008 97 1,2,3 ... Unacceptable ... 16 State of Palestine Yes 2004 19 Lower Major Yes 4.1 46 Direct No Yes 2010 16 5 2010 99 1 Yes Unacceptable Yes ... Syrian Arab Republic Yes 2006 13 Lower Major No 3.0 42 Direct No Yes 2009-10 16 2009 96 1 2 No Acceptable No 49 Turkey No 2008 14 Maintain Major Yes 2.1 31 Direct ... ... 2008 6 2009 95 1,2,3,4,5,6,7 ... Unacceptable No 20 United Arab Emirates ... ... ... Maintain No concern No 1.8 28 No support ... ... ... ... 2008 100 1,2,3 ... Acceptable ... 8 Yemen Yes 2006 32 Lower Major Yes 4.1 47 Direct No Yes 2006 24 2006 36 1 No Unacceptable No 270 Country or Area Marriage Fertility Family Planning and Reproductive Health Abortion Maternal Mortality Measures to end child and forced marriages Women aged 20-24 married by age 18 Footnotes Policy on fertility Concern about adolescent fertility Policies to reduce ado- lescent fertility Total fertility (births per woman) Ado- lescent birth rate (births per 1,000 women aged 15-19) Support for family planning Pro- grammes to ensure youth’s access to contra- ception Mea- sures to increase access to SRH services Unmet need for family planning Footnotes Births attended by skilled health staff Legal grounds for abortion Footnotes Mea- sures to improve access to safe abortion services View on maternal mortality Preven- tion of maternal mortal- ity as a national priority Maternal mortality ratio (per 100,000 live births) 2012 Year % 2013 2013 2013 2010–15 2010–15 2013 2012 2012 Year % Year % 2013 2012 2013 2012 2013 EUROPE — ... ... — — — 1.6 15 — — — 2013 10 ... ... — — — — 17 Eastern Europe — ... ... — — — 1.5 23 — — — 2013 10 ... ... — — — — ... Belarus No 2005 7 Raise Major Yes 1.5 21 Direct Yes Yes 2012 7 4,5 2012 100 1,2,3,4,5,6,7 Yes Acceptable No 1 Bulgaria Yes ... ... Raise Major Yes 1.5 36 Indirect No Yes 1997-98 30 8,13 2010 100 1,2,3,4,5,6,7 No Unacceptable No 5 Czech Republic No ... ... Raise Major Yes 1.6 5 Indirect No No 2008 4 3,8 2010 100 1,2,3,4,5,6,7 No Acceptable No 5 Hungary ... ... ... Raise Minor Yes 1.4 12 Indirect ... ... 1992-93 7 3,8,13 2010 99 1,2,3,4,5,6,7 ... Acceptable ... 14 Poland No ... ... Raise Major Yes 1.4 12 No support No No ... ... 2005 100 1,2,3,4,5 No Acceptable Yes 3 Republic of Moldova Yes 2005 19 Raise Major Yes 1.5 29 Direct Yes Yes 2005 11 2010 99 1,2,3,4,5,6,7 Yes Unacceptable Yes 21 Romania Yes ... ... Raise Minor Yes 1.4 31 Direct Yes Yes 2004 12 3,8 2011 99 1,2,3,4,5,6,7 Yes Unacceptable No 33 Russian Federation No ... ... Raise Major No 1.5 26 Indirect ... ... 2011 8 8 2010 100 1,2,3,4,5,6,7 ... Unacceptable ... 24 Slovakia No ... ... Raise Minor Yes 1.4 16 No support No No ... ... 2010 99 1,2,3,4,5,6,7 No Acceptable No 7 Ukraine No 2007 10 Raise No concern No 1.5 26 Indirect Yes Yes 2012 5 2010 100 1,2,3,4,5,6,7 Yes Unacceptable Yes 23 Northern Europe — ... ... — — — 1.9 19 — — — 2013 7 ... ... — — — — ... Denmark Yes ... ... Raise No concern No 1.9 5 Direct Yes No ... ... 1987 100 1,2,3,4,5,6,7 No Acceptable No 5 Estonia ... ... ... Raise No concern No 1.6 17 Indirect ... ... ... ... 2006 100 1,2,3,4,5,6,7 ... Acceptable ... 11 Finland Yes ... ... Maintain Minor Yes 1.9 9 Direct Yes Yes ... ... 2003 100 1,2,3,4,5,6 Yes Acceptable No 4 Iceland ... ... ... Maintain Minor Yes 2.1 11 Direct ... ... ... ... ... ... 1,2,3,4,5,6 ... Acceptable ... 4 Ireland ... ... ... N. I. Major Yes 2.0 8 Direct No Yes ... ... 2003 100 1 Yes Acceptable No 9 Latvia No ... ... Raise Major Yes 1.6 14 No support Yes Yes 1995 17 3,8,13 2006 100 1,2,3,4,5,6,7 Yes Unacceptable Yes 13 Lithuania ... ... ... Raise Major Yes 1.5 11 Indirect No No 1994-95 18 3,8,13 2006 100 1,2,3,4,5,6,7 Yes Acceptable No 11 Norway Yes ... ... Maintain Minor Yes 1.9 8 Direct Yes No ... ... 1988 100 1,2,3,4,5,6,7 ... Acceptable No 4 Sweden Yes ... ... Raise Minor Yes 1.9 7 Direct No No ... ... 1987 100 1,2,3,4,5,6,7 No Acceptable No 4 United Kingdom ... ... ... N. I. Major Yes 1.9 26 Direct ... ... ... ... 1998 99 1,2,3,5,6 14 ... Acceptable ... 8 Southern Europe — ... ... — — — 1.5 9 — — — 2013 12 ... ... — — — — ... Albania No 2008-09 10 Maintain Minor Yes 1.8 15 Direct Yes Yes 2008-09 13 2009 99 1,2,3,4,5,6,7 Yes Unacceptable Yes 21 Andorra No ... ... Maintain Minor Yes ... ... No support Yes Yes ... ... ... ... 1 2 ... Acceptable No ... Bosnia and Herzegovina Yes 2006 6 N. I. Minor Yes 1.3 15 Indirect Yes Yes 2011-12 9 5 2012 100 1,2,3,4,5,6,7 ... Acceptable No 8 Croatia ... ... ... Raise Major Yes 1.5 13 Direct Yes Yes ... ... 2011 100 1,2,3,4,5,6,7 Yes Acceptable No 13 Greece ... ... ... Raise Major Yes 1.5 12 No support ... ... ... ... ... ... 1,2,3,4,5,6,7 ... Acceptable ... 5 Holy See ... ... ... Raise ... ... ... ... Not permitted ... ... ... ... ... ... Not permitted ... Acceptable ... ... Italy ... ... ... Raise No concern No 1.5 4 Indirect No No 1995-96 12 3,8,13 2003 99 1,2,3,4,5,6,7 No Acceptable No 4 Malta Yes ... ... Raise Minor Yes 1.4 18 No support No Yes ... ... 2006 100 Not permitted 15 No Acceptable No 9 Montenegro ... 2005 5 Raise Major Yes 1.7 15 Direct ... ... ... ... 2009 100 1,2,3,4,5,6,7 ... Acceptable ... 7 Portugal ... ... ... Raise Major Yes 1.3 13 Direct Yes Yes ... ... 2001 100 1,2,3,4,5,6,7 Yes Acceptable Yes 8 San Marino ... ... ... N. I. No concern No ... ... No support ... ... ... ... ... ... 1 2 ... Acceptable ... ... Serbia No 2010 5 Raise Major Yes 1.4 17 Direct Yes No 2010 7 5 2010 100 1,2,3,4,5,6,7 ... Acceptable No 16 Slovenia No ... ... Raise Minor Yes 1.5 1 Direct Yes No 1994-95 9 3,8,13 2010 100 1,2,3,4,5,6,7 No Unacceptable Yes 7 Spain ... ... ... Raise Minor Yes 1.5 11 Direct Yes Yes 1994-95 12 8 ... ... 1,2,3,4,5,6,7 Yes Acceptable No 4 TYFR Macedonia Yes 2011 7 4 Raise Major Yes 1.4 18 Direct Yes Yes 2011 17 5 2011 98 1,2,3,4,5,6,7 Yes Acceptable No 7 Western Europe — ... ... — — — 1.7 5 — — — 2013 9 ... ... — — — — ... Austria Yes ... ... Raise Minor No 1.5 4 Indirect No Yes ... ... 1993 100 1,2,3,4,5,6,7 No Acceptable No 4 Belgium Yes ... ... Raise Minor No 1.8 7 Direct Yes No 1991-92 3 8,13,16 1999 99 1,2,3,4,5,6,7 ... Acceptable No 6 France Yes ... ... Raise Minor Yes 2.0 6 Direct ... Yes 2004-05 2 13 1993 99 1,2,3,4,5,6,7 ... Unacceptable No 9 Germany Yes ... ... Raise Major Yes 1.4 4 No support No No ... ... 2006 100 1,2,3,4,5,6,7 Yes Acceptable No 7 Liechtenstein ... ... ... Raise No concern Yes ... ... No support ... ... ... ... ... ... 1,2,3 ... Acceptable ... ... Luxembourg Yes ... ... Raise Minor Yes 1.7 8 Indirect Yes Yes ... ... 2003 100 1,2,3,4,5,6 Yes Acceptable No 11 Monaco ... ... ... Maintain No concern No ... ... No support ... ... ... ... ... ... 1,4,5 2 ... Acceptable ... ... Netherlands No ... ... N. I. Minor Yes 1.8 6 Indirect Yes No ... ... 2003 100 1,2,3,4,5,6,7 No Acceptable No 6 Switzerland Yes ... ... N. I. No concern No 1.5 2 No support Yes Yes ... ... 2006 100 1,2,3,4,5,6,7 No Acceptable No 6 LATIN AMERICA AND THE CARIBBEAN — ... ... — — — 2.2 68 — — — 2013 11 2000 86 — — — — ... Caribbean — ... ... — — — 2.3 59 — — — 2013 17 ... ... — — — — ... Antigua and Barbuda No ... ... N. I. Major Yes 2.1 49 Direct No Yes ... ... 2008 100 1 2 Yes Acceptable No ... Bahamas ... ... ... N. I. Major Yes 1.9 28 Direct ... ... ... ... 2007 99 1,2,3,4,5 ... Acceptable ... 37 Barbados No ... ... Raise Major Yes 1.8 48 Direct Yes Yes ... ... 2007 100 1,2,3,4,5,6 Yes Acceptable Yes 52 Cuba Yes 2010-11 40 Raise Major Yes 1.5 43 Direct Yes Yes 2010-11 9 5 2011 100 1,2,3,4,5,6,7 Yes Acceptable Yes 80 Dominica ... ... ... N. I. Major Yes ... ... Direct Yes Yes ... ... 2008 100 1 Yes Acceptable No ... Dominican Republic Yes 2009-10 41 Lower Major Yes 2.5 100 Direct Yes Yes 2007 11 2007 98 Not permitted 15 No Unacceptable Yes 100 Grenada No ... ... N. I. Major Yes 2.2 35 Direct Yes Yes ... ... 2007 99 1,2,3 No Acceptable No 23 Haiti ... 2005-06 30 Lower Major Yes 3.2 42 Direct ... No 2012 35 2012 37 1 2 ... Unacceptable No 380 Jamaica No 2005 9 Lower Major Yes 2.3 70 Direct No No 2008-09 10 3 2008 98 1,2,3 1 No Unacceptable No 80 Saint Kitts and Nevis ... ... ... N. I. Major Yes ... ... Direct No Yes ... ... 2008 100 1,2,3,4 1 Yes Acceptable Yes ... Saint Lucia No ... ... Maintain Major Yes 1.9 56 Direct Yes Yes ... ... 2007 100 1,2,3,4 Yes Acceptable Yes 34 Saint Vincent and the Grenadines No ... ... Maintain Major Yes 2.0 55 Direct No Yes ... ... 2008 99 1,2,3,4,5,6 Yes Acceptable No 45 Trinidad and Tobago Yes 2006 8 Maintain Major Yes 1.8 35 Direct No Yes 1987 16 2006 98 1,2,3 1 No Unacceptable No 84 Central America — ... ... — — — 2.4 70 — — — 2013 12 ... ... — — — — ... Belize No 2011 26 Lower Major Yes 2.7 71 Direct Yes Yes 2011 16 5 2011 96 1,2,3,5,6 Yes Acceptable Yes 45 Costa Rica Yes ... ... Maintain Major Yes 1.8 61 Direct Yes Yes 2011 8 5 2011 99 1,2,3 Yes Acceptable Yes 38 El Salvador No 2008 25 N. I. Major Yes 2.2 76 Direct Yes Yes 2008 18 2008 96 Not permitted 15 No Unacceptable Yes 69 Guatemala Yes 2008/09 30 Lower Major Yes 3.8 97 Direct Yes Yes 2008-09 21 4 2009 52 1 ... Unacceptable Yes 140 Honduras No 2005-06 39 Lower Major Yes 3.0 84 Direct Yes Yes 2011-12 11 2012 83 1 17 No Unacceptable No 120 Mexico Yes 2009 23 Lower Major Yes 2.2 63 Direct Yes Yes 2009 10 2012 96 1,2,3,4,5,6,7 18 Yes Unacceptable Yes 49 Nicaragua ... 2006-07 41 Lower Major Yes 2.5 101 Direct ... ... 2006-07 11 2007 74 Not permitted 15 ... Unacceptable ... 100 Panama No ... ... Maintain Major Yes 2.5 79 Direct Yes Yes ... ... 2009 89 1,4,5 Yes Unacceptable No 85 South America — ... ... — — — 2.1 68 — — — 2013 9 ... ... — — — — ... Argentina No ... ... N. I. Major Yes 2.2 54 Direct Yes Yes ... ... 2011 97 1,2,4 Yes Unacceptable Yes 69 Bolivia (Plurinational State of) No 2008 22 Maintain Major Yes 3.3 72 Direct Yes Yes 2008 20 2008 71 1,2,3,4 Yes Unacceptable Yes 200 Brazil No 2006 36 N. I. Major Yes 1.8 71 Direct Yes Yes 2006 6 2006 97 1,4 Yes Unacceptable Yes 69 Chile No ... ... N. I. Major Yes 1.8 55 Direct Yes Yes ... ... 2010 100 Not permitted 15 No Acceptable Yes 22 Colombia No 2010 23 Lower Major Yes 2.3 69 Direct Yes Yes 2009-10 8 2012 99 1,2,3,4,5 Yes Unacceptable Yes 83 Ecuador Yes 2004 22 Maintain Major Yes 2.6 77 Direct Yes Yes 2004 7 3 2004 98 1,2,3 Yes Unacceptable Yes 87 Guyana Yes 2009 23 N. I. Major Yes 2.6 88 Direct Yes Yes 2009 29 2009 92 1,2,3,4,5,6,7 Yes Unacceptable Yes 250 Paraguay No 2004 18 Lower Major Yes 2.9 67 Direct Yes Yes 2008 5 3,8 2008 82 1 No Unacceptable Yes 110 Peru No 2011 19 Lower Major Yes 2.4 51 Direct Yes Yes 2012 8 2012 87 1,2,3 No Unacceptable No 89 Suriname Yes 2006 19 Maintain Major Yes 2.3 35 Indirect Yes Yes 2010 17 5 2010 91 1 Yes Unacceptable No 130 Uruguay Yes ... ... Raise Major Yes 2.1 58 Direct Yes Yes ... ... 2009 100 1,2,3,4,5,6,7 Yes Acceptable No 14 Venezuela (Bolivarian Rep. of) Yes ... ... N. I. Major Yes 2.4 83 Direct Yes Yes 1998 19 3 2003 95 1 No Unacceptable Yes 110 NORTHERN AMERICA — ... ... — — — 1.9 30 — — — 2013 7 1990 99 — — — — ... Canada ... ... ... N. I. Minor Yes 1.7 14 Indirect ... ... ... ... 2007 100 1,2,3,4,5,6,7 ... Unacceptable ... 11 United States of America ... ... ... N. I. Major Yes 2.0 31 Direct Yes Yes 2006-10 8 3,8 2003 99 1,2,3,4,5,6,7 Yes Unacceptable No 28 OCEANIA — ... ... — — — 2.4 30 — — — 2013 15 ... ... — — — — ... Australia/New Zealand — ... ... — — — 1.9 14 — — — 2013 10 ... ... — — — — ... Australia Yes ... ... Raise Minor Yes 1.9 12 Indirect Yes Yes ... ... 2003 100 1,2,3,4,5,6,7 Yes Acceptable Yes 6 New Zealand Yes ... ... Maintain Major Yes 2.1 25 Direct Yes Yes ... ... 2001 97 1,2,3,4,5 Yes Acceptable No 8 Melanesia — ... ... — — — 3.6 59 — — — 2013 24 ... ... — — — — ... Fiji Yes ... ... Lower Minor Yes 2.6 43 Direct Yes Yes ... ... 2010 100 1,2,3,4,5,6 1 Yes Unacceptable Yes 59 Papua New Guinea Yes 2006 21 Lower Major Yes 3.8 62 Direct Yes Yes 2006-07 27 2006 53 1 No Unacceptable Yes 220 Solomon Islands No 2007 22 Lower Major Yes 4.1 65 Direct Yes Yes 2006-07 11 2007 86 1 No Unacceptable Yes 130 Vanuatu No 2007 27 Lower Major Yes 3.4 45 Direct Yes Yes ... ... 2007 74 1,2,3 Yes Unacceptable No 86 Micronesia — ... ... — — — 2.7 29 — — — 2013 22 ... ... — — — — ... Kiribati No 2009 20 Lower Major Yes 3.0 17 Direct Yes Yes 2009 28 2009 80 1 No Unacceptable No 130 Marshall Islands No 2007 26 Lower Major Yes ... ... Direct Yes Yes 2007 8 2010 99 1 No Acceptable No ... Micronesia (Federated States of) No ... ... Lower Major Yes 3.3 19 Direct Yes Yes ... ... 2009 100 1 No Acceptable No 96 Nauru No 2007 27 Maintain Major Yes ... ... Direct Yes Yes 2007 24 ... ... 1,2,3 1 Yes Acceptable No ... Palau Yes ... ... N. I. Minor Yes ... ... Direct Yes Yes ... ... 2010 100 1 No Acceptable No ... Polynesia — ... ... — — — 3.0 30 — — — 2013 41 ... ... — — — — ... Cook Islands ... ... ... Raise Major Yes ... ... Direct ... ... ... ... ... ... 1,2,3,4 ... Acceptable ... ... Niue ... ... ... Raise Minor Yes ... ... Direct ... ... ... ... ... ... 1,2,3 ... Acceptable ... ... Samoa No ... ... Lower Major Yes 4.2 28 Direct Yes Yes 2009 48 2009 81 1,2,3 1 No Unacceptable No 58 Tonga No ... ... Maintain Minor Yes 3.8 18 Direct Yes Yes ... ... 2010 98 1 No Unacceptable Yes 120 Tuvalu Yes 2007 10 Lower Major Yes ... ... Direct Yes Yes 2007 24 2007 98 1 Yes Acceptable No ... 14 20 27 44 40 30 42 40 43 0 10 20 30 40 50 1996 2005 2013 1996 2005 2013 1996 2005 2013 Maintain/No intervention LowerRaise Government policies to influence the level of fertility, 1996-2013 Percentage Percentage 60 77 90 52 59 77 63 82 94 60 80 100 0 10 20 30 40 50 60 70 80 90 100 1996 2005 2013 1996 2005 2013 1996 2005 2013 1996 2005 2013 World Developed regions Developing regions Least developed countries Governments with policies to reduce adolescent fertility, 1996-2013 Percentage 26 37 23 24 35 19 39 12 50 13 29 24 31 41 31 23 27 30 50 44 39 46 35 33 58 34 58 50 38 0 10 20 30 40 50 60 70 80 90 100 Governments with measures to improve access to safe abortion services in the past five years, 2012 World Developed regions Developing regions Least developed countries Africa Asia Europe Latin America & Caribbean Northern America Oceania Yes No Not available 17 37 11 6 6 13 36 15 13 27 24 28 18 13 21 27 52 50 55 39 61 76 81 67 36 33 38 0 10 20 30 40 50 60 70 80 90 100 World Developed regions Developing regions Least developed countries Africa Asia Europe Latin America & Caribbean Oceania Yes No Not available Governments with measures to end child and forced marriages in the past five years, 2012 Percentage Percentage 0 10 20 30 40 50 60 70 80 90 100 Measures to increase access to SRH services in the past five years Programmes to ensure youth’s access to contraception Governments enabling access to sexual and reproductive health (SRH), 2012 World Developed regions Developing regions Least developed countries World Developed regions Developing regions Least developed countries Yes No Not available 13 24 9 2 14 29 9 4 10 27 5 8 20 22 19 16 77 49 86 90 66 49 72 80 Percentage World 69 62 31 22 81 75 98 98 0 10 20 30 40 50 60 70 80 90 100 2005 2013 2005 2013 2005 2013 2005 2013 Governments considering their level of maternal mortality as unacceptable, 2005 and 2013 Developed regions Developing regions Least developed countries This wallchart presents the most up-to-date informa- tion on reproductive health policies and programmes in 197 countries, including all 193 Member States, two Observer States (the Holy See and the State of Palestine) and 2 non-member States (Cook Islands and Niue) of the United Nations. Countries are grouped geographically into six major areas: Asia; Africa; Europe; Latin America and the Caribbean; Northern America; and Oceania. The major areas are further divided geographically into 21 regions. In addition, the regions are classified as belonging to either of two groups: developed regions and developing regions. The developed regions comprise all regions of Europe plus Northern America, Australia, New Zea- land and Japan. The developing regions comprise all regions of Africa, Asia (excluding Japan), Latin Amer- ica and the Caribbean plus Melanesia, Micronesia and Polynesia. The designations “developed” and “developing” are intended for statistical convenience and do not express a judgement about the stage reached by a particular country or area in the development process. The 49 least developed countries include 34 in Africa, 9 in Asia, 5 in Oceania and 1 in Latin America and the Caribbean, as defined by United Nations General Assembly resolutions 59/209, 59/210, 60/33, 62/97, 64/295 and 67/136. Total fertility and adolescent birth rates are not shown for countries with a population of less than 90,000 inhabitants. Three dots (…) indicate that data are not available. An em dash (—) indicates that the item is not applicable. N.I. indicates “No Intervention” 1 Laws on abortion either expressly allow abor- tion to be performed only to save the life of a woman or are governed by general principles of criminal legislation which allow abortion to be performed for that reason on the ground of necessity. In addition, the British case of R. v. Bourne or local application of that decision is applied. Under that decision, the ground of necessity was interpreted to encompass abor- tion performed on grounds of preserving physi- cal and mental health. 2 Laws on abortion do not expressly allow abor- tion to be performed to save the life of a woman, but general principles of criminal legislation allow abortion to be performed for that reason on the ground of necessity. 3 Data refer to a non-standard definition of unmet need for family planning. 4 Preliminary data. 5 Infecundity measured, in part, with question on current use of contraception instead of ever use of contraception. 6 Data refer to pre-secession Sudan, including data for South Sudan. 7 Nigeria has two laws on abortion: one for the northern states and one for the southern states. Both laws specifically allow abortion to be per- formed to save the life of a woman. In addition, in the southern states, the decision of R. v. Bourne is applied, which allows abortion to be performed on grounds of preserving physical and mental health. 8 Data refer to a non-standard age or marital sta- tus group. 9 Although the law allows abortion for economic or social reasons, it provides no specific refer- ence to abortion performed on grounds of men- tal health or because of foetal impairment. 10 The law allows abortion to be performed in order to save the life of a woman or to provide neces- sary treatment. The law does not indicate which abortions constitute necessary treatment. 11 Excluding the Northern Province. 12 Data refer to nationals of the country. 13 Data refer to unmet need for limiting only. 14 Refers to the abortion law of England, Wales and Scotland. 15 Laws on abortion have been amended to remove all grounds on which abortion might be performed legally. However, it is not clear whether a defence of necessity might be allowed to justify an abor- tion performed to save the life of a woman. 16 Data refer to a population subgroup. 17 The Penal Code makes no exceptions to the general prohibition on the performance of abortion; the Code of Medical Ethics, however, allows abortion for therapeutic purposes. 18 Laws on abortion are adopted at the state level. The grounds reported reflect those in the Fed- eral Penal Code. NOTES See reverse for definitions and sources www.unpopulation.org
- 2. Measures to end child and forced marriages:a Indicates whether the Government has implemented concrete meas- ures in the past five years to end child marriage and forced marriage. Women aged 20–24 married by age 18:b Percentage of women aged 20 to 24 years who married or entered a union before age 18. A union involves a man and a woman regularly cohabiting in a marriage-like relationship. Policy on fertility:c Refers to the objective of policies or measures adopted by the Government to influence the level of fertility in the country. Three types of objectives are distinguished: (1) to raise fertility; (2) to lower fertility; and (3) to maintain fertility at its current level. In addition, when appropriate, the fact that a Government has no intervention aimed at affecting the level of fertility is also indicated. Concern about adolescent fertility:c Indicates the extent to which the Government considers the level of adolescent fertility in the country to be a concern. Three categories are distinguished: (1) a major concern; (2) a minor concern; and (3) not a concern. Policies to reduce adolescent fertility:c Indicates whether the Government has implemented any programmes or meas- ures to reduce the level of fertility among adolescents. Total fertility:d Average number of children a hypothetical cohort of women would have at the end of their reproductive period if they were subject during their whole lives to the fertility rates of a given period and if they were not subject to mortality. Total fertility is expressed as children per woman. It refers to the period 2010-2015. Adolescent birth rate:d Annual number of births to women aged 15 to 19 years, divided by the number of women aged 15 to 19 years. Adolescent birth rate is expressed as births per 1,000 women. It refers to the period 2010-2015. Support for family planning:c Indicates the type of support given by the Government for the provision of family plan- ning. Four categories are distinguished: (1) direct support; (2) indirect support; (3) no support; and (4) not permitted. Direct support implies that family planning information, guidance and supplies are provided through government- run facilities or outlets. Indirect support implies that the Government does not provide family planning services through government outlets, but instead supports the private sector and non-governmental organizations (NGOs) in provid- ing those services. No support means that the Government allows the private sector and NGOs to provide family planning services without giving any material support. Not permitted means that the Government does not allow family planning programmes or services within its jurisdiction. Programmes to ensure youth’s access to contraception:a Indicates whether the Government has specific programmes to ensure the access of adolescents and youth to sexual and reproductive health information and services that warrant and respect privacy, confidentiality and informed consent in the area of contraceptives. Measures to increase access to SRH services:a Indicates whether the Government has implemented concrete meas- ures in the past five years to increase women’s access to comprehensive sexual and reproductive health (SRH) ser- vices, regardless of marital status and age. Unmet need for family planning:e Women with an unmet need for family planning are those, married or in-union women aged 15 to 49 years, who are fecund and sexually active but are not using any method of contraception although they report not wanting any more children or wanting to delay the next pregnancy. Aggregate group estimates are weighted averages of the model-based country estimates, using the number of married or in-union women aged 15 to 49 years in each country as weights. Births attended by skilled health staff:f Percentage of deliv- eries attended by trained health personnel. Traditional birth attendants (TBAs), even if they have received a short training course, are not included. Legal grounds for abortion:c Indicates legal provisions under which the Government permits induced abortion in the country. Induced abortions are those initiated by deliberate action taken with the intention of terminating pregnancy; all other abortions are considered spontane- ous. Seven grounds on which abortion is permitted are distinguished: (1) To save a woman’s life; (2) To preserve a woman’s physical health; (3) To preserve a woman’s mental health; (4) In case of rape or incest; (5) Because of foetal impairment; (6) For economic or social reasons; (7) On request. Measures to improve access to safe abortion services:a Indicates whether the Government has implemented con- crete measures in the past five years to improve access to safe abortion services to the extent of the law. View on maternal mortality:c Indicates whether the Govern- ment considers the level of maternal mortality in the country to be acceptable or unacceptable. Prevention of maternal mortality as a national priority:a Indicates whether the prevention of maternal mortality is considered a priority in the country’s national health policy framework or strategy. Maternal mortality ratio:g Number of maternal deaths over a year per 100,000 live births in that year. According to the World Health Organization, a maternal death is the death of a woman while pregnant or within 42 days of termination of preg- nancy, irrespective of the duration and site of the pregnancy, from any cause related to or aggravated by the pregnancy or its management but not from accidental or incidental causes. Sources: a United Nations Population Fund (2012). ICPD Beyond 2014 Global Survey Database. b United Nations Children’s Fund (2013). ChildInfo: Monitoring the Situation of Children and Women. Available from http://www. childinfo.org/marriage_countrydata.php. c United Nations, Department of Economic and Social Affairs, Population Division (2013). World Population Policies 2013 (Sales No. E.14.XIII.2). d United Nations, Department of Economic and Social Affairs, Population Division (2013). World Population Prospects: The 2012 Revision. Extended Dataset in Excel and ASCII formats (Sales No. E.13.XIII.10). e United Nations, Department of Economic and Social Affairs, Population Division (2014). World Contraceptive Use 2014 (POP/DB/CP/Rev2014). f The World Bank (2014). The World Development Indicators: DataBank. Available from http://data.worldbank.org/indicator/ SH.STA.BRTC.ZS. g World Health Organization (2014). Global Health Observatory Data Repository. Available from http://apps.who.int/gho/data/ node.main.MATMORT?lang=en. DEFINITIONS AND SOURCES ISBN 978-92-1-151520-6 Copyright © United Nations, 2014 All rights reserved ST/ESA/SER.A/356 Sales No. E.14.XIII.10 Enquiries should be directed to: Population Division Department of Economic and Social Affairs United Nations Secretariat New York, NY 10017, USA Phone: +1-212-963-3209 Fax: +1-212-963-2147 Email: poppolicy@un.org Website: www.unpopulation.org 14 54444 Government policies to influence the level of fertility 1996 2013 The boundaries on these maps do not imply official endorsement or acceptance by the United Nations. Policy objective Lower Raise Maintain No intervention No data Government level of concern about adolescent fertility 1996 2013 The boundaries on these maps do not imply official endorsement or acceptance by the United Nations. Level of concern Major concern Minor concern Not a concern No data United Nations Department of Economic and Social Affairs Population Division Reproductive HealthPOLICIES 2014