5. 5
GE Healthcare Fact Sheet
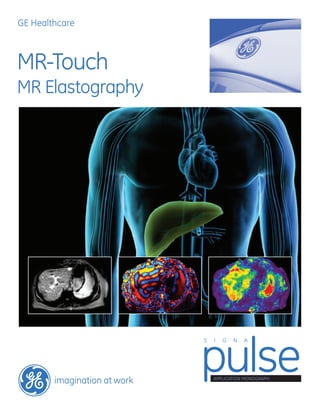
M R - T o u c h
MR-Touch
Fact Sheet
What challenges does MR-Touch address and what solutions does it create?
Chronic liver disease and cirrhosis are major public health problems worldwide.
In 2004, these conditions were associated with nearly 40,000 deaths and a cost
of at least $1.4 billion for medical services in the U.S. alone.1,2
Liver biopsy is the current standard of care for detecting hepatic fibrosis, but its
invasive nature limits its value to use as a screening tool for a large population.
There are also limitations with the technique that include poor acceptance by
patients, measurement errors, and cost.3,4
Current noninvasive alternatives to liver
biopsy are serum-based testing,5
which is not reliable for detecting early disease,
and transient ultrasound elastography,6
which has technical limitations in patients
with obesity and conditions such as ascites.
MR-Touch uses the MR Elastography (MRE) technique to provide diagnostic
information without the discomfort and risk of complications due to invasive
procedures, enabling more frequent evaluation when closer monitoring is needed.
What are the main benefits of the technology?
By creating a vivid visual representation of liver tissue stiffness, MRE helps radiologists
deliver a more confident diagnosis. Both comprehensive and noninvasive, the
technique can appeal to patients and referring physicians, and can help expand
the role of radiology into new areas.
How does MRE work?
MRE, a technique developed by Richard Ehman, MD, and colleagues at Mayo Clinic
(Rochester, MN), uses low-frequency mechanical waves to probe the elastic properties
of tissue. These mechanical waves are generated in the body through an external
acoustic driver, which are then imaged using a special phase-contrast MR sequence.
GE imagination at work
7. 7
GE Healthcare White Paper
h e a l t h y m a g i n a t i o n M R E
GE imagination at work
Background
Chronic liver disease and cirrhosis are major public health problems
worldwide. In 2004, these conditions were associated with nearly 40,000
deaths and a cost of at least $1.4 billion for medical services in the U.S.
alone.1,2
These figures are expected to increase due to aging, obesity, and
end-stage liver disease caused by chronic hepatitis C. The major biological
process responsible for clinical liver disease is progressive hepatic fibrosis.
Liver biopsy is the current gold standard for detecting hepatic fibrosis.
There are, however, limitations with the technique, which include poor
acceptance by patients, measurement errors, and cost.3,4
Current
non-invasive alternatives to liver biopsy are limited to serum-based
testing,5
which is not reliable for detecting early disease, and transient
ultrasound elastography,6
which has technical limitations in patients
with obesity and conditions such as ascites.7,8
Magnetic Resonance Elastography
The promise of better outcomes and lower costs
Vinod S. Palathinkara, PhD, Lloyd Estkowski, and
David W. Lee, PhD
GE Healthcare
8. 8
h e a l t h y m a g i n a t i o n M R E
Magnetic resonance
elastography (MRE)
Magnetic resonance elastography
(MRE), a technique developed by
Richard Ehman, MD, and colleagues
at Mayo Clinic (Rochester, MN), uses
low-frequency mechanical waves
to probe the elastic properties of
tissue. These mechanical waves are
generated in the body through an
external acoustic driver, which are
then imaged using a special phase-
contrast MR sequence. Using a
sophisticated mathematical algorithm,
the mechanical wave data collected
by the MR is then used to generate
“elastograms” – diagnostic images that
depict a relative stiffness of tissues.
MRE gives referring physicians
a powerful new option for liver
assessment. It is a new tool that
provides diagnostic information without
the discomfort and risk of complications
due to invasive procedures, enabling
more frequent evaluation when closer
monitoring is needed. By creating a
visual representation of liver tissue
stiffness, MRE helps radiologists deliver
a more confident diagnosis at a lower
cost than previous techniques.
Both comprehensive and non-invasive,
MRE can appeal to patients and referring
physicians and can help expand the
role of radiology into new areas. More
than anything else, MRE holds the
promise of better outcomes at lower
costs to the healthcare system.
Patient management with MRE
Multiple studies have shown that when
added to a conventional MRI exam
of the abdomen, MRE can provide
additional information that clinicians
need to improve the management of
their patients with chronic liver disease.
The long-term benefit is in using the
information downstream to better
utilize liver tests and procedures, and
enhance the quality of patient care.
MRE provides additional assessment
of liver disease beyond routine lab
and imaging tests, so that the patients
can be more appropriately referred
for further diagnosis options such as
biopsy. Because liver biopsy is invasive,
some patients with suspected liver
disease may decline the procedure. As
a result, some patients with significant
liver disease are not properly identified
as eligible candidates for appropriate
treatment. MRE can enable referring
physicians to assess more patients who
may need liver biopsy and to identify
patients who present tissue stiffness
that is symptomatic of fibrosis.
MRE could be a particularly useful tool
for physicians to manage patients
afflicted with hepatitis B and C, which
can often lead to liver injury. Since
MRE identifies tissue with elevated
liver stiffness, and advanced fibrosis
or cirrhosis leads to increased liver
stiffness, patients with either type of
liver disease can still be evaluated
and monitored. MRE could be a
better-tolerated, noninvasive method
to risk-stratify patients who may have
symptoms typical of fibrosis, such as
elevated liver stiffness. MRE can also be
used to evaluate the need for biopsies
or to conduct that first biopsy in the
future when evidence typical of hepatic
fibrosis first presents on MRE.
2
9. 9
h e a l t h y m a g i n a t i o n M R E
Figure 1 (all images below): Typical MR elastograms of normal volunteer and patients.
Images courtesy of Dr. Richard Ehman,
The Mayo Clinic
Elastogram on volunteer patient is shown (right) and corresponding anatomic
image (left). In the elastogram, relative stiffness is shown on a color scale, ranging
from softest (purple) to hardest (red). For reference, a dashed outline has been
superimposed on the elastogram to indicate the approximate location of the liver
Note that the stiffness of normal liver tissue is very low and similar to that of
adipose tissue. The spleen is usually considerably stiffer than other tissues, as shown
by the corresponding red areas.
A 61-year-old with elevated serum liver tests and nonalcoholic fatty liver disease.
In this case of advanced liver fibrosis, the elastogram shows that the liver is
much stiffer than subcutaneous tissues and overall stiffness of the liver. The
heterogeneity of the stiffness of the liver is also increased (compared to volunteer
in images shown above).
A 61-year-old with hepatitis C, cirrhosis, and hepatocellular carcinoma.The oval
outline in the anatomic image (left) shows the location of the hepatocellular
carcinoma. The elastogram (right) shows a corresponding area of high stiffness in
the right lobe of the liver (red arrow), as well as an area of very high stiffness in the
left lobe of the liver (green arrow) that is consistent with advanced fibrosis.
3
10. 10
Clinical value of MRE
Yin et al. evaluated the diagnostic
performance of an optimized MRE
protocol for assessing hepatic fibrosis
among patients with diverse causes
of chronic liver disease and in normal
individuals. The summary of mean
values and variance of liver stiffness
from the 35 normal volunteers and 48
patients with chronic liver disease is
shown in Figure 2.
The mean liver stiffness value for
normal individuals was 2.20 ± 0.31
kilopascal (kPa) (range, 1.77–2.85 kPa).
For the entire group of patients with
varying degrees of chronic liver disease,
the mean liver stiffness value was 5.80
± 2.57 kPa (range, 2.76–12.01 kPa).
When assessed by stage of fibrosis, the
mean liver stiffness value increased
systematically with an excellent
correlation between histologic fibrosis
and shear stiffness obtained with MR
elastography (R2
= 0.94, P 0.001) (see
Figure 2). Further comparisons between
the normal volunteers and the patient
groups showed significantly higher
mean liver stiffness values by fibrosis
groups of F0–1–2, F3, and F4 compared
with normal volunteers (P 0.0001) (see
Figure 3). Between the mild (F0–1–2)
and severe (F3–4) fibrosis groups,
the authors also found significant
differences in mean liver stiffness
measurements (P .05) (see Figure 3).
This study’s results supported the
hypothesis that MRE is effective for
distinguishing normal, soft-liver tissue
from stiff fibrotic-liver tissue with a
very high negative predictive value.
The severity of increased stiffness
was shown to allow moderate to
severe fibrosis to be distinguished
non-invasively from mild fibrosis.
It is important to assess the accuracy
of MRE in relation to the accuracy of
liver biopsy. A review of the available
data on the accuracy of needle liver
biopsy to define the stage of fibrosis
reveals that significant sampling and
interpretive error affects the diagnostic
accuracy of liver biopsy. Needle liver
biopsy evaluates only about 1/50,000
of the volume of the liver, so it may be
h e a l t h y m a g i n a t i o n M R E
Figure 2: Mean liver shear stiffness measurements for normal volunteers and patients.
10
9
8
7
6
5
4
3
2
1
0
(35) (14) (6) (5) (5) (18)
Meanliverstiffness(kPa)
Chronic liver diseaseNormal
Stage
F0
Stage
F1
Stage
F2
Stage
F3
Stage
F4
y = .1631 e 0.2374x
r = 0.94432
Mean liver stiffness increases with the
increased fibrosis stage in patients.
Shown is a summary of the mean
shear stiffness measurements of the
liver for the 35 normal volunteers and
the 48 patients divided into the five
different fibrosis stages, which are
indicated as F0, F1 . . . F4. Liver stiffness
is significantly higher in patients than
in the control group. The error bar for
each group also illustrates the standard
errors for each group. An exponential
function fit well to the liver stiffness
data with an r2 value of 0.94.
Chart from Yin et al., Gastroenterology and
Hepatology, 2007.
4
11. 11
affected by substantial sampling error.10
Autopsy and laparoscopy studies
that have evaluated the accuracy of
liver biopsy for staging fibrosis and
diagnosing cirrhosis have clearly shown
that cirrhosis is missed on a single blind
liver biopsy in 10% to 30% of cases.11,
12, 13, 14, 15
The majority of this error is due
to the under-staging of disease. Both
the size of the biopsy and number of
biopsies taken have a major effect on
accuracy. Abdi et al. report that the
correct diagnosis of cirrhosis with a
single biopsy increased from 80% to
100% when three specimens were
analyzed.16
Similarly, in a study that
evaluated the agreement between
three biopsies taken at a single setting,
Maharaj reported that cirrhosis was
identified in all three biopsies in only
50% of the cases.17
Rocky et al. suggest that sampling
variability appears to be one of the
major limitations of liver biopsy.3
In
a study of 124 patients with chronic
HCV infection who underwent
laparoscopy-guided left and right
lobe liver biopsies, 33% of cases
had discordant results by at least
one histological stage. A smaller but
substantial proportion of biopsies
were discordant by at least two
stages. Similarly, a single liver biopsy
specimen may fail to distinguish
steatohepatitis from simple steatosis
and may mis-stage the disease by
one, or less frequently, two stages if
the specimen is much smaller than 2
cm. The authors caution that although
even small biopsy specimens may be
sufficient for diagnostic purposes in
certain situations, the possibility that
sampling variability exists must be
recognized, so that the absence of key
findings does not rule out a suspected
diagnosis. By showing information
about liver stiffness over one or more
cross sections of the entire liver, MRE
provides a more comprehensive view
than before available.
h e a l t h y m a g i n a t i o n M R E
Normal
Liverstiffness(kPa)
Chronic liver disease
Kruskal Wallis
Dunnett’s Test
a=0.5
Normal
Stage 0
Stage 1
Stage 2
Stage 3
Stage 4
Liverpatient
14
12
10
8
6
4
2
0
0 1 2 3 4
P .0001*
P .0001*
P .0001*
Normal
FO-1-2
F3-4
Figure 3: Mean liver shear stiffness at different fibrosis stages.
Liver stiffness increases significantly
with increased fibrosis extent as
determined by liver biopsy examination.
In the left diagram, significant
differences (*) were observed in the
liver stiffness between the normal
control group and patient groups
F0–1–2, F3, and F4. The P values all
are less than .0001. The CI diamonds
are shown for each group. In the right
diagram, a significant difference also
was observed between the mild fibrosis
groups (F0 –1–2) and the severe fibrosis
groups (F3– 4). The P value is less than
.05. The center and the radius of the
three circles indicate the mean and SD
of the normal, F0–1–2, and F3–4 fibrosis
groups. The data were analyzed with
a Kruskal–Wallis test followed by the
Dunnett test.
Chart from Yin et al., Gastroenterology and
Hepatology, 2007.
5
12. 12
h e a l t h y m a g i n a t i o n M R E
Improved patient comfort
and safety with MRE
According to Rocky et al., pain is
the most common complication of
liver biopsy, occurring in up to 84%
of patients.3
The most important
complication of a liver biopsy is
bleeding. Severe bleeding requires
hospitalization and increases the
likelihood of transfusion or even
radiological intervention or surgery.
Such bleeding has been estimated
to occur in between 1 in 2500 to 1 in
10,000 biopsies. Less severe bleeding,
defined as that sufficient to cause pain
or reduced blood pressure, but not
requiring transfusion or intervention,
occurs in approximately 1 in 500
biopsies. Mortality after liver biopsy is
usually related to hemorrhage and is
very uncommon. The most commonly
quoted mortality rate is approximately
1 in 10,000 to 1 in 12,000.18, 19
MRE does not use contrast or ionizing
radiation and provides a completely
non-invasive test of liver tissue
elasticity, thus resulting in high patient
comfort. According to Ehman et al., the
vibration used in MRE has amplitude
that is very small (typically less than 0.1
mm) and does not cause discomfort to
the patient.20
Figure 4: Major complications of liver biopsy.
Complications Risk
Any pain 1:4
Significant pain 1:10–1:20
Bleeding 1:100
Bile leak 1:1,000
Death 1:10,000– 1:12,000
6
13. 13
h e a l t h y m a g i n a t i o n
Health care system costs
Carlson et al. use data originally
reported by Wong et al. and adjusts
for inflation using Consumer Price
Index to arrive at an estimated cost
of liver biopsy of $1,255,* but this
estimate is based on cost rather
than charge and does not include all
expenses associated with the test. It
also understates the true costs of
a liver biopsy because it excludes
procedure-related morbidities.7, 21
Myers
et al. use administrative databases
from a large Canadian Health Region
to identify percutaneous liver biopsies
performed between 1994 and 2002.22
The study found that between 1994
and 2002, 3627 patients had 4275
liver biopsies. Thirty-two patients
(0.75%) had significant biopsy
related complications.†
Pain requiring
admission (0.51%) and bleeding (0.35%)
were most common. Six patients
(0.14%) died; all had malignancies. The
median direct cost of a hospitalization
for complications was $4579 Canadian
(range $1164-$29,641).
As a new technology, MRE is currently
not reimbursed as a standalone test
with its own CPT code. Because the
acquisition time for MRE is very short,
the technique can be readily included
in the protocol for an already-indicated
abdominal MRI exam with little impact
on the typical examination time of
30 to 45 minutes. If the entire cost
of such an exam is attributed to the
MRE procedure, then a conservative
estimate of the cost of the MRE would
be equivalent to the 2010 national
Medicare average payment amount
for abdominal MRI, i.e., $628 (CPT code
74183). At this stage, there is no way
to predict the willingness of payers to
cover an MRI examination conducted
solely to perform MRE.
To better quantify the costs associated
with MRE and liver biopsy, a decision-
analytic model comparing diagnostic
costs was constructed.23
A targeted
literature review was conducted and,
in addition, a leading hepatologist
and pathologist were consulted to
identify the appropriate procedure
codes associated with liver biopsy.
The study assumed that MRE would
be reimbursed≠
using CPT-4 code
74181 (magnetic resonance [e.g.,
proton] imaging, abdomen; without
contrast material[s]). All appropriate
allowable charges were assigned to the
identified procedure codes using the
2010 Medicare Physician Fee Schedule.
Please note that all costs discussed
here are US-based costs and are not
globally applicable. Based on the model,
the cost of a guided liver biopsy was
$1,424 (ultrasound $164, surgical $881,
pathology $347, laboratory $32) and
the cost of an MRE (without contrast)
was $946 (hospital setting) or $666
(non-hospital setting).
Given the novelty of MRE technology,
peer-reviewed academic/medical
literature evaluating the potential
cost-effectiveness of this non-invasive
testing strategy in the diagnosis and
management of liver fibrosis is not yet
available. Nevertheless, scenario-based
analysis of published comparisons of
patients who had both biopsy and MRE
is illustrative and insightful.
*Figures associated with US rates of reimbursement. Not applicable globally.
†Significant complications were identified by reviewing medical records of patients hospitalized within seven days
of a biopsy and those with a diagnostic code indicative of procedural complications.
≠MRE is currently not reimbursed on its own CPT code.
7
14. 14
Scenario analysis
Huwart et al. performed a blind
comparison of MRE and liver biopsy for
non-invasive staging of liver fibrosis
and reported histopathologic staging of
liver fibrosis according to the METAVIR
scoring system as the reference.24
The study analyzed 96 patients for
whom both MRE and liver biopsy were
performed (see Figure 5). It should
be noted that the initial sample had
141 patients from whom liver biopsy
specimens were collected, but only 127
liver biopsy specimens were suitable
for fibrosis staging. This suggests that
approximately 10% of the samples from
a biopsy specimen may be unsuitable
for staging.
We consider three scenarios as a
hypothetical example to illustrate the
costs of performing MRE for evaluation
of liver disease. In scenario 1, we
assume that liver biopsy is 100%
accurate and that the discrepancy in
staging between MRE and liver biopsy is
entirely due to the errors in MRE. From
a cost perspective, this would mean
that at some time, these patients would
need some follow-up to get a definitive
diagnosis. Since we are using biopsy as
the reference standard, the cost for the
follow-up would be assumed to be the
cost of a biopsy.
Figure 5: Flow diagram of patients who underwent liver biopsy and MRE (Huwart et al.).
Elevated
liver enzymes
Biopsy (96)
MRE (96)
F0(22)
F1-2(41)
F3-4(33)
Conforming outcome
Outcome
Misclassification Follow-up(24)
h e a l t h y m a g i n a t i o n M R E
8
15. 15
Huwart et al. report that when
comparing results from MRE and biopsy,
24 of 96 (25%) were misclassified in
their stage of fibrosis. Based on the
reported sensitivity and specificity of
MRE techniques, this misclassification
is unusually high. Nevertheless, since
biopsy is the reference standard, we
assume that 25% of patients who
underwent MRE would eventually
require further evaluation, probably
with a biopsy. We do not consider
how one would identify the patients
who are misclassified and ignore
the impact on the outcome or the
additional treatment costs due to
misclassification. Our attempt here is
to illustrate a methodology that can
provide directional information on costs
to explore potential for cost reduction,
rather than to establish or estimate
actual cost differentials.
In scenario 1, we assume that biopsy
is 100% accurate and all samples are
good enough to make a diagnosis.
We consider this as a worst-case
scenario for MRE. The authors highlight
the fact that liver biopsy is not an
optimal reference examination and
that they do not know if the reported
discordant results between MRE
and histopathology were caused
by problems of inadequate biopsy
sampling.* The authors also report that
the two pathologists who reviewed
the biopsy specimen were initially
in agreement only on 81 of the 96
samples. Nevertheless, since biopsy
is the reference standard, we have
to assume that it provides clinically
accepted basis for comparison.
Elevated
liver enzymes
Biopsy (96)
MRE (96)
F0(22)
F1-2(41)
F3-4(33)
Conforming outcome
Outcome
Misclassification Follow-up(24)
Figure 6: Hypothetical examples of direct costs of MRE and liver biopsy for scenario 1.
h e a l t h y m a g i n a t i o n M R E
*In 26 of the 96 samples, the biopsy specimen was less than 25 mm.
Scenario 1
Biopsy is 100% accurate; all samples
are suitable.
Costs for procedures:
Biopsy = 96 x $1424 = $136,704
MRE = 96 x $946 + 24 x $1424
= $123,100
Cost differential = $13,604 , or
10% less than biopsy
9
16. 16
As reported by Huwart et al., 14 of 141
samples were unsuitable for diagnosis.
Even though there are many studies
that recommend a minimum sample
length of 25 mm, the study reports that
23% of the samples were less than
25 mm in length. Thus the scenario
that a few biopsy samples would be
unsuitable is realistic. In scenario
2, we assume that to get 96 good
samples, one would need to do 10%
more samples (105.6 biopsies). This
assumption does not imply that these
patients would undergo an immediate
repeat biopsy. The cost of this may
result in an increased cost of diagnosis
per person.
Elevated
liver enzymes
Biopsy (105.6)
MRE (96)
F0(22)
F1-2(41)
F3-4(33)
Conforming outcome
Outcome
Misclassification Follow-up(24)
Unsuitable
sample (9.6)
Figure 7: Hypothetical example of direct costs of MRE and liver biopsy for scenario 2.
h e a l t h y m a g i n a t i o n M R E
Scenario 2
Biopsy is 100% accurate, but 10% samples
are unsuitable.
Costs for procedures:
Biopsy = 96 x $1424 + 9.6 x 1424
= $136,704 + $13,670
= $150,374
MRE = $123,100 + 2.4 x $1424 = $126,518
Cost differential = $23,856, or
16% less than biopsy
10
17. 17
In scenario 3, we take into account
biopsy leading to a misclassification.
More than questioning the accuracy of
the biopsy, this is reflective of the fact
that biopsy is a sampling technique.
Studies report biopsy mis-staging to
be in the range of 10% to 33%. In this
case, we assume 20% mis-staging. If
20% of biopsy samples are mis-staged,
then the discordances between MRE
and biopsy may decrease. However,
for simplicity, we still assume that the
discordance between MRE and biopsy
would not change.
Conclusion
MRE is non-invasive and provides
tissue stiffness information for the
entire liver. It avoids the discomfort
and risk of complications associated
with other invasive procedure. In
addition, elastograms that overlay
tissue stiffness images over the
anatomy avoid sampling error and
provide richer information that could
assist in diagnosis. Studies show
that the technique has excellent
sensitivity in depicting the elevated
stiffness associated with hepatic
fibrosis. Stiffness of normal liver tissue
is very soft and comparable to that
of subcutaneous fat. Studies have
also shown that hepatic steatosis, a
common condition, does not have a
significant influence on liver stiffness
and therefore does not confound the
elastographic findings observed in
fibrosis. In summary, the evidence
supports the use of MRE as a triaging
option for liver biopsy. The accuracy
and the noninvasive nature of the
technology offer the promise that MRE
could improve outcomes, potentially at
lower costs.
Follow-up
Elevated
liver enzymes
Biopsy (105.6)
MRE (96)
F0(22)
F1-2(41)
F3-4(33)
Conforming outcome
Outcome
Misclassification Follow-up(24)
Unsuitable
sample (9.6)
(19.2)
Figure 8: Hypothetical examples of direct costs of MRE and liver biopsy for scenario 3.
h e a l t h y m a g i n a t i o n M R E
Scenario 3
Biopsy is only 80% accurate, but MRE still
has 25% misclassifications.
Costs for procedures:
Biopsy = $136,704 + 0.2 x 96 x $1424
= $136,704 + $27,341
= $164,045
MRE = $123,100
Cost differential = $40,945, or
25% less than biopsy
11
18. 18
References
1
Kim, W.R., et al. Burden of liver disease in the United States: summary of a workshop. Hepatology 36, 227–242 (2002).
2
Shaheen, N.J., et al. The burden of gastrointestinal and liver diseases. Am J Gastroenterol 101, 2128–2138 (2006).
3
Rockey, D.C., et al. Liver biopsy. American Association for the Study of Liver Disease (AASLD), position paper, 2009.
4
Bravo, A.A., et al. Liver biopsy. N Engl J Med 344(7), 495-500 (2001).
5
Smith, J.O., Sterling, R.K. Systematic review: non-invasive methods of fibrosis analysis in chronic hepatitis C. Aliment Pharmacol Ther 30(6), 557-76 (2009).
6
Stebbing, J., et al. A meta-analysis of transient elastography for the detection of hepatic fibrosis. J Clin Gastroenterol 44(3), 214-9 (2010).
7
Carlson, J.J., et al. An evaluation of the potential cost-effectiveness of non-invasive testing strategies in the diagnosis of significant liver fibrosis.
J Gastroenterol Hepatol 24(5), 786-91 (2009).
8
Talwalkar, J.A. Elastography for detecting hepatic fibrosis: options and considerations. Gastroenterology 359(1), 299-302 (2008).
9
Yin, M,. et al. Assessment of hepatic fibrosis with magnetic resonance elastography. Clin Gastroentero 5(10), 1207-1213 (2007).
10
Afdhal, N.H., Nunes, D. Evaluation of liver fibrosis: a concise review. Am Gastroentero, 99(6), 1160-74 (2004).
11
Bruguera, M., et al. A comparison of the accuracy of peritoneoscopy and liver biopsy in the diagnosis of cirrhosis. Gut 15, 799-800 (1974).
12
Poniachik, J., et al. The role of laparoscopy in the diagnosis of cirrhosis. Gastrointest Endosc 43, 568-71 (1996).
13
Pagliaro, L., et al. Percutaneous blind biopsy versus laparoscopy with guided biopsy in diagnosis of cirrhosis. Dig Dis Sci, 28, 39-43 (1983).
14
Olsson, R., et al. Sampling variability of percutaneous liver biopsy in primary sclerosing cholangitis. J Clin Pathol 48, 933-5 (1995).
15
Angelucci, E., et al. Needle liver biopsy in thalassemia: analyses of the diagnostic accuracy and safety in 1184 consecutive biopsies. Br J Haematol 89, 757-61 (1995).
16
Abdi, W., et al. Sampling variability on percutaneous liver biopsy. Arch Intern Med 15, 329-35 (1979).
17
Maharaj, B., et al. Sampling variability and its influence on the diagnostic yield of percutaneous needle biopsy of the liver. Lancet 1, 523-5 (1986).
18
Perrault, J., et al. Liver biopsy: complications in 1000 inpatients and outpatients. Gastroenterology 74, 103-106 (1978).
19
McGill, D.B., et al. A 21-year experience with major hemorrhage after percutaneous liver biopsy. Gastroenterology 99, 1396-1400 (1990).
20
Ehman, E.C., et al. Vibration safety limits for magnetic resonance elastography. Phys Med Biol 53(4), 925-935 (2008).
21
Wong, J., et al. Pretreatment evaluation of chronic hepatitis C: risk, benefits, and costs. JAMA 280, 2088–93 (1998).
22
Myers, R.P., et al. Utilization rates, complications and costs of percutaneous liver biopsy: a population-based study including 4275 biopsies. Liver Int, 705-12 (2008).
23
DeKoven, M. Cost comparison: liver biopsy versus abdominal MRI. Memo to GE Healthcare from IMS Health Incorporated. May 25, 2010.
24
Huwart, L., et al. Magnetic resonance elastography for the non-invasive staging of liver fibrosis. Gastroenetrology, 135(1), 32-40, (2008).
20. 20
1
Background
Chronic liver disease and cirrhosis are major public health
problems worldwide. In 2004, these conditions were
associated with nearly 40,000 deaths and a cost of at least
$1.4 billion for medical services in the U.S. alone.1,2
These
figures are expected to increase due to aging, obesity, and
end-stage liver disease caused by chronic hepatitis C. The
major biological process responsible for clinical liver disease
is progressive hepatic fibrosis.
Liver biopsy is the current gold standard for detecting
hepatic fibrosis. There are, however, limitations with the
technique, which include poor acceptance by patients,
measurement errors, and cost.3,4
Current non-invasive
alternatives to liver biopsy are limited to serum-based
testing,5
which is not reliable for detecting early disease,
and transient ultrasound elastography,6
which has technical
limitations in patients with obesity and conditions such as
ascites.7,8
The promise of
better outcomes
and lower costs
Vinod S. Palathinkara, PhD, Lloyd Estkowski,
and David W. Lee, PhD
GE Healthcare
A GE Healthcare MR publication • Autumn 2010
wh i te p a p erM ag n et i c R es o n a n c e E l ast o gra p hy
21. 21
Magnetic resonance elastography (MRE)
Magnetic resonance elastography (MRE), a technique
developed by Richard Ehman, MD, and colleagues at Mayo
Clinic (Rochester, MN), uses low-frequency mechanical
waves to probe the elastic properties of tissue. These
mechanical waves are generated in the body through an
external acoustic driver, which are then imaged using a
special phase-contrast MR sequence. Using a sophisticated
mathematical algorithm, the mechanical wave data
collected by the MR is then used to generate “elastograms”
– diagnostic images that depict relative stiffness of tissues.
MRE gives referring physicians a powerful new option
for liver assessment. It is a new tool that provides
diagnostic information without the discomfort and risk
of complications due to invasive procedures, enabling
more frequent evaluation when closer monitoring is needed.
By creating a visual representation of liver tissue stiffness,
MRE helps radiologists deliver a more confident diagnosis
at a lower cost than previous techniques.
Both comprehensive and non-invasive, MRE can appeal to
patients and referring physicians and can help expand the
role of radiology into new areas. More than anything else,
MRE holds the promise of better outcomes at lower costs
to the healthcare system.
MRE Supplement • Autumn 20102
wh i te p a p er M ag n et i c R es o n a n c e E l ast o gra p hy
22. 22
Patient management with MRE
Multiple studies have shown that when added to a
conventional MRI exam of the abdomen, MRE can provide
additional information that clinicians need to improve the
management of their patients with chronic liver disease. The
long-term benefit is in using the information downstream to
better utilize liver tests and procedures, and enhance the
quality of patient care.
MRE provides additional assessment of liver disease beyond
routine lab and imaging tests, so that the patients can be
more appropriately referred for further diagnosis options
such as biopsy. Because liver biopsy is invasive, some
patients with suspected liver disease may decline the
procedure. As a result, some patients with significant liver
disease are not properly identified as eligible candidates for
appropriate treatment. MRE can enable referring physicians
to assess more patients who may need liver biopsy and
to identify patients who present tissue stiffness that is
symptomatic of fibrosis.
MRE could be a particularly useful tool for physicians to
manage patients afflicted with hepatitis B and C, which
can often lead to liver injury. Since MRE identifies tissue with
elevated liver stiffness, and advanced fibrosis or cirrhosis
leads to increased liver stiffness, patients with either type
of liver disease can still be evaluated and monitored. MRE
could be a better-tolerated, noninvasive method to risk-
stratify patients who may have symptoms typical of fibrosis,
such as elevated liver stiffness. MRE can also be used to
evaluate the need for biopsies or to conduct that first biopsy
in the future when evidence typical of hepatic fibrosis first
presents on MRE.
How elastography works
The image is captured in as little as 14 seconds,
or one breath hold, in three steps:
A special MRI technique
images minute
displacements of the
tissue that result from
wave propagation.
A simple, drum-like
driver generates acoustic
waves within the tissue
of interest.
An advanced mathematical
technique generates maps
of tissue stiffness, known as
“elastograms”.
A GE Healthcare MR publication • Autumn 2010 3
wh i te p a p erM ag n et i c R es o n a n c e E l ast o gra p hy
23. 23
ImagescourtesyofDr.Richard
Ehman,TheMayoClinic
Figure 1. (all images below): Typical MR elastograms of normal volunteer and patients.
Elastogram on volunteer patient is shown (right) and corresponding anatomic
image (left). In the elastogram, relative stiffness is shown on a color scale, ranging
from softest (purple) to hardest (red). For reference, a dashed outline has been
superimposed on the elastogram to indicate the approximate location of the liver
Note that the stiffness of normal liver tissue is very low and similar to that of
adipose tissue. The spleen is usually considerably stiffer than other tissues, as shown
by the corresponding red areas.
A 61-year-old with elevated serum liver tests and nonalcoholic fatty liver disease.
In this case of advanced liver fibrosis, the elastogram shows that the liver is
much stiffer than subcutaneous tissues and overall stiffness of the liver. The
heterogeneity of the stiffness of the liver is also increased (compared to volunteer
in images shown above).
A 61-year-old with hepatitis C, cirrhosis, and hepatocellular carcinoma.The oval
outline in the anatomic image (left) shows the location of the hepatocellular
carcinoma. The elastogram (right) shows a corresponding area of high stiffness in
the right lobe of the liver (red arrow), as well as an area of very high stiffness in the
left lobe of the liver (green arrow) that is consistent with advanced fibrosis.
MRE Supplement • Autumn 20104
wh i te p a p er M ag n et i c R es o n a n c e E l ast o gra p hy
24. 24
A GE Healthcare MR publication • Autumn 2010 5
wh i te p a p erM ag n et i c R es o n a n c e E l ast o gra p hy
Clinical value of MRE
Yin et al. evaluated the diagnostic performance of an
optimized MRE protocol for assessing hepatic fibrosis
among patients with diverse causes of chronic liver disease
and in normal individuals.9
The summary of mean values
and variance of liver stiffness from the 35 normal volunteers
and 48 patients with chronic liver disease is shown in
Figure 2.
The mean liver stiffness value for normal individuals was
2.20 ± 0.31 kilopascal (kPa) (range, 1.77–2.85 kPa). For the
entire group of patients with varying degrees of chronic liver
disease, the mean liver stiffness value was 5.80 ± 2.57 kPa
(range, 2.76–12.01 kPa). When assessed by stage of fibrosis,
the mean liver stiffness value increased systematically with
an excellent correlation between histologic fibrosis and
shear stiffness obtained with MR elastography (R2
= 0.94, P
0.001) (see Figure 2). Further comparisons between the
normal volunteers and the patient groups showed signifi-
cantly higher mean liver stiffness values by fibrosis groups
of F0–1–2, F3, and F4 compared with normal volunteers (P
0.0001) (see Figure 3). Between the mild (F0–1–2) and severe
(F3–4) fibrosis groups, the authors also found significant
differences in mean liver stiffness measurements (P .05)
(see Figure 3).
This study’s results supported the hypothesis that MRE is
effective for distinguishing normal, soft-liver tissue from
stiff fibrotic-liver tissue with a very high negative predictive
value. The severity of increased stiffness was shown to allow
moderate to severe fibrosis to be distinguished non-invasively
from mild fibrosis.
It is important to assess the accuracy of MRE in relation to
the accuracy of liver biopsy. A review of the available data
on the accuracy of needle liver biopsy to define the stage
of fibrosis reveals that significant sampling and interpretive
error affects the diagnostic accuracy of liver biopsy. Needle
liver biopsy evaluates only about 1/50,000 of the volume of
the liver, so it may be affected by substantial sampling error.10
Autopsy and laparoscopy studies that have evaluated the
accuracy of liver biopsy for staging fibrosis and diagnosing
cirrhosis have clearly shown that cirrhosis is missed on a
single blind liver biopsy in 10% to 30% of cases.11,12,13,14,15
The
majority of this error is due to the under-staging of disease.
Both the size of the biopsy and number of biopsies taken
have a major effect on accuracy. Abdi et al. report that the
correct diagnosis of cirrhosis with a single biopsy increased
from 80% to 100% when three specimens were analyzed.16
Similarly, in a study that evaluated the agreement between
three biopsies taken at a single setting, Maharaj reported
that cirrhosis was identified in all three biopsies in only 50%
of the cases.17
Mean liver stiffness increases with the increased
fibrosis stage in patients. Shown is a summary
of the mean shear stiffness measurements of
the liver for the 35 normal volunteers and the
48 patients divided into the five different fibrosis
stages, which are indicated as F0, F1 . . . F4. Liver
stiffness is significantly higher in patients than in
the control group. The error bar for each group
also illustrates the standard errors for each
group. An exponential function fit well to the liver
stiffness data with an r2 value of 0.94.
Figure 2. Mean liver shear stiffness measurements for normal volunteers and patients.
10
9
8
7
6
5
4
3
2
1
0
(35) (14) (6) (5) (5) (18)
Meanliverstiffness(kPa)
Chronic liver diseaseNormal
Stage
F0
Stage
F1
Stage
F2
Stage
F3
Stage
F4
y = .1631 e 0.2374x
r = 0.94432
ChartfromYinetal.,GastroenterologyandHepatology,2007.
25. 25
Liver stiffness increases significantly with
increased fibrosis extent as determined by
liver biopsy examination. In the left diagram,
significant differences (*) were observed in
the liver stiffness between the normal control
group and patient groups F0–1–2, F3, and F4.
The P values all are less than .0001. The CI
diamonds are shown for each group. In the
right diagram, a significant difference also
was observed between the mild fibrosis
groups (F0 –1–2) and the severe fibrosis groups
(F3– 4). The P value is less than .05. The center
and the radius of the three circles indicate the
mean and SD of the normal, F0–1–2, and
F3–4 fibrosis groups. The data were analyzed
with a Kruskal–Wallis test followed by the
Dunnett test.
Normal
Liverstiffness(kPa)
Chronic liver disease
Kruskal Wallis
Dunnett’s Test
a=0.5
Normal
Stage 0
Stage 1
Stage 2
Stage 3
Stage 4
Liverpatient
14
12
10
8
6
4
2
0
0 1 2 3 4
P .0001*
P .0001*
P .0001*
Normal
FO-1-2
F3-4
Figure 3. Mean liver shear stiffness at different fibrosis stages.
ChartfromYinetal.,GastroenterologyandHepatology,2007.
Complications Risk
Any pain 1:4
Significant pain 1:10–1:20
Bleeding 1:100
Bile leak 1:1,000
Death 1:10,000– 1:12,000
Figure 4. Major complications of liver biopsy.
Rocky et al. suggest that sampling variability appears to be
one of the major limitations of liver biopsy.3
In a study of
124 patients with chronic HCV infection who underwent
laparoscopy-guided left and right lobe liver biopsies, 33%
of cases had discordant results by at least one histological
stage. A smaller but substantial proportion of biopsies were
discordant by at least two stages. Similarly, a single liver
biopsy specimen may fail to distinguish steatohepatitis from
simple steatosis and may mis-stage the disease by one, or
less frequently, two stages if the specimen is much smaller
than 2 cm. The authors caution that although even small
biopsy specimens may be sufficient for diagnostic purposes
in certain situations, the possibility that sampling variability
exists must be recognized, so that the absence of key
findings does not rule out a suspected diagnosis. By
showing information about liver stiffness over one or
more cross sections of the entire liver, MRE provides a
more comprehensive view than before available.
Improved patient comfort and safety with MRE
According to Rocky et al., pain is the most common complication
of liver biopsy, occurring in up to 84% of patients.3
The most
important complication of a liver biopsy is bleeding. Severe
bleeding requires hospitalization and increases the likelihood
of transfusion or even radiological intervention or surgery.
Such bleeding has been estimated to occur in between 1 in
2500 to 1 in 10,000 biopsies. Less severe bleeding, defined
as that sufficient to cause pain or reduced blood pressure,
but not requiring transfusion or intervention, occurs in
approximately 1 in 500 biopsies. Mortality after liver biopsy
is usually related to hemorrhage and is very uncommon.
The most commonly quoted mortality rate is approximately
1 in 10,000 to 1 in 12,000.18,19
MRE does not use contrast or ionizing radiation and provides
a completely non-invasive test of liver tissue elasticity, thus
resulting in high patient comfort. According to Ehman et al.,
the vibration used in MRE has amplitude that is very small
(typically less than 0.1 mm) and does not cause discomfort
to the patient.20
MRE Supplement • Autumn 20106
wh i te p a p er M ag n et i c R es o n a n c e E l ast o gra p hy
26. 26
wh i te p a p erM ag n et i c R es o n a n c e E l ast o gra p hy
Health care system costs
Carlson et al. use data originally reported by Wong et al.
and adjusts for inflation using Consumer Price Index to
arrive at an estimated cost of liver biopsy of $1,255,* but
this estimate is based on cost rather than charge and
does not include all expenses associated with the test. It
also understates the true costs of a liver biopsy because it
excludes procedure-related morbidities.7, 21
Myers et al. use
administrative databases from a large Canadian Health
Region to identify percutaneous liver biopsies performed
between 1994 and 2002.22
The study found that between
1994 and 2002, 3627 patients had 4275 liver biopsies.
Thirty-two patients (0.75%) had significant biopsy related
complications.†
Pain requiring admission (0.51%) and
bleeding (0.35%) were most common. Six patients (0.14%)
died; all had malignancies. The median direct cost of a
hospitalization for complications was $4579 Canadian
(range $1164 – $29,641).
As a new technology, MRE is currently not reimbursed
as a standalone test with its own CPT code. Because the
acquisition time for MRE is very short, the technique can
be readily included in the protocol for an already-indicated
abdominal MRI exam with little impact on the typical
examination time of 30 to 45 minutes. If the entire cost
of such an exam is attributed to the MRE procedure, then
a conservative estimate of the cost of the MRE would be
equivalent to the 2010 national Medicare average payment
amount for abdominal MRI, i.e., $628 (CPT code 74183).
At this stage, there is no way to predict the willingness of
payers to cover an MRI examination conducted solely to
perform MRE.
To better quantify the costs associated with MRE and liver
biopsy, a decision-analytic model comparing diagnostic
costs was constructed.23
A targeted literature review was
conducted and, in addition, a leading hepatologist and
pathologist were consulted to identify the appropriate
procedure codes associated with liver biopsy. The study
assumed that MRE would be reimbursed≠
using CPT-4
code 74181 (magnetic resonance [e.g., proton] imaging,
abdomen; without contrast material[s]). All appropriate
allowable charges were assigned to the identified procedure
codes using the 2010 Medicare Physician Fee Schedule.
Please note that all costs discussed here are US-based costs
and are not globally applicable. Based on the model, the
cost of a guided liver biopsy was $1,424 (ultrasound $164,
surgical $881, pathology $347, laboratory $32) and the cost
of an MRE (without contrast) was $946 (hospital setting) or
$666 (non-hospital setting).
Given the novelty of MRE technology, peer-reviewed
academic/medical literature evaluating the potential
cost-effectiveness of this non-invasive testing strategy
in the diagnosis and management of liver fibrosis is not
yet available. Nevertheless, scenario-based analysis of
published comparisons of patients who had both biopsy
and MRE is illustrative and insightful.
*Figures associated with US rates of reimbursement. Not applicable globally.
†Significant complications were identified by reviewing medical records
of patients hospitalized within seven days of a biopsy and those with
a diagnostic code indicative of procedural complications.
≠MRE is currently not reimbursed on its own CPT code.
A GE Healthcare MR publication • Autumn 2010 7
27. 27
Scenario analysis
Huwart et al. performed a blind comparison of MRE and
liver biopsy for non-invasive staging of liver fibrosis and
reported histopathologic staging of liver fibrosis according
to the METAVIR scoring system as the reference.24
The
study analyzed 96 patients for whom both MRE and liver
biopsy were performed (see Figure 5). It should be noted
that the initial sample had 141 patients from whom liver
biopsy specimens were collected, but only 127 liver biopsy
specimens were suitable for fibrosis staging. This suggests
that approximately 10% of the samples from a biopsy
specimen may be unsuitable for staging.
We consider three scenarios as a hypothetical example to
illustrate the costs of performing MRE for evaluation of liver
disease. In scenario 1, we assume that liver biopsy is 100%
accurate and that the discrepancy in staging between MRE
and liver biopsy is entirely due to the errors in MRE. From a
cost perspective, this would mean that at some time, these
patients would need some follow-up to get a definitive
diagnosis. Since we are using biopsy as the reference
standard, the cost for the follow-up would be assumed
to be the cost of a biopsy.
Huwart et al. report that when comparing results from
MRE and biopsy, 24 of 96 (25%) were misclassified in their
stage of fibrosis. Based on the reported sensitivity and
specificity of MRE techniques, this misclassification is
unusually high. Nevertheless, since biopsy is the reference
standard, we assume that 25% of patients who underwent
MRE would eventually require further evaluation, probably
with a biopsy. We do not consider how one would identify
the patients who are misclassified and ignore the impact
on the outcome or the additional treatment costs due to
delay in misclassification. Our attempt here is to illustrate
a methodology that can provide directional information on
costs to explore potential for cost reduction, rather than to
establish or estimate actual cost differentials.
Figure 5. Flow diagram of patients who underwent liver biopsy and MRE (Huwart et al.).
Elevated
liver enzymes
Biopsy (96)
MRE (96)
F0(22)
F1-2(41)
F3-4(33)
Conforming outcome
Outcome
Misclassification Follow-up(24)
MRE Supplement • Autumn 20108
wh i te p a p er M ag n et i c R es o n a n c e E l ast o gra p hy
28. 28
A GE Healthcare MR publication • Autumn 2010 9
wh i te p a p erM ag n et i c R es o n a n c e E l ast o gra p hy
In scenario 1, we assume that biopsy is 100% accurate
and all samples are good enough to make a diagnosis.
We consider this as a worst-case scenario for MRE.
The authors highlight the fact that liver biopsy is not
an optimal reference examination and that they do not
know if the reported discordant results between MRE and
histopathology were caused by problems of inadequate
biopsy sampling.* The authors also report that the two
pathologists who reviewed the biopsy specimen were
initially in agreement only on 81 of the 96 samples.
Nevertheless, since biopsy is the reference standard, we
have to assume that it provides clinically accepted basis
for comparison.
As reported by Huwart et al., 14 of 141 samples were
unsuitable for diagnosis. Even though there are many
studies that recommend a minimum sample length of
25 mm, the study reports that 23% of the samples were
less than 25 mm in length. Thus the scenario that a few
biopsy samples would be unsuitable is realistic. In scenario
2, we assume that to get 96 good samples, one would need
to do 10% more samples (105.6 biopsies). This assumption
does not imply that these patients would undergo an
immediate repeat biopsy. The cost of this may result in
an increased cost of diagnosis per person.
Elevated
liver enzymes
Biopsy (96)
MRE (96)
F0(22)
F1-2(41)
F3-4(33)
Conforming outcome
Outcome
Misclassification Follow-up(24)
Figure 6. Hypothetical examples of direct costs of MRE and liver biopsy
for scenario 1.
*In 26 of the 96 samples, the biopsy specimen was less than 25 mm.
Scenario 1
Biopsy is 100% accurate; all samples are suitable.
Costs for procedures:
Biopsy = 96 x $1424 = $136,704
MRE = 96 x $946 + 24 x $1424
= $123,100
Cost differential = $13,604, or 10% less than biopsy
Figure 7. Hypothetical example of direct costs of MRE and liver biopsy
for scenario 2.
Elevated
liver enzymes
Biopsy (105.6)
MRE (96)
F0(22)
F1-2(41)
F3-4(33)
Conforming outcome
Outcome
Misclassification Follow-up(24)
Unsuitable
sample (9.6)
Scenario 2
Biopsy is 100% accurate, but 10% samples are unsuitable.
Costs for procedures:
Biopsy = 96 x $1424 + 9.6 x 1424
= $136,704 + $13,670
= $150,374
MRE = $123,100 + 2.4 x $1424
= $126,518
Cost differential = $23,856, or 16% less than biopsy
29. 29
In scenario 3, we take into account biopsy leading to a
misclassification. More than questioning the accuracy
of the biopsy, this is reflective of the fact that biopsy is a
sampling technique. Studies report biopsy mis-staging to be
in the range of 10% to 33%. In this case, we assume 20%
mis-staging. If 20% of biopsy samples are mis-staged, then
the discordances between MRE and biopsy may decrease.
However, for simplicity, we still assume that the discordance
between MRE and biopsy would not change.
Conclusion
MRE is non-invasive and provides tissue stiffness
information for the entire liver. It avoids the discomfort
and risk of complications associated with other invasive
procedure. In addition, elastograms that overlay tissue
stiffness images over the anatomy avoid sampling error
and provide richer information that could assist in diagnosis.
Studies show that the technique has excellent sensitivity
in depicting the elevated stiffness associated with hepatic
fibrosis. Stiffness of normal liver tissue is very soft and
comparable to that of subcutaneous fat. Studies have also
shown that hepatic steatosis, a common condition, does not
have a significant influence on liver stiffness and therefore
does not confound the elastographic findings observed in
fibrosis. In summary, the evidence supports the use of MRE
as a triaging option for liver biopsy. The accuracy and the
noninvasive nature of the technology offer the promise that
MRE could improve outcomes, potentially at lower costs.
Figure 8. Hypothetical examples of direct costs of MRE and liver biopsy
for scenario 3.
Follow-up
Elevated
liver enzymes
Biopsy (105.6)
MRE (96)
F0(22)
F1-2(41)
F3-4(33)
Conforming outcome
Outcome
Misclassification Follow-up(24)
Unsuitable
sample (9.6)
(19.2)
Scenario 3
Biopsy is only 80% accurate, but MRE still has 25%
misclassifications.
Costs for procedures:
Biopsy = $136,704 + 0.2 x 96 x $1424
= $136,704 + $27,341
= $164,045
MRE = $123,100
Cost differential = $40,945, or 25% less than biopsy
References
1 Kim, W.R., et al. Burden of liver disease in the United States: summary of a workshop. Hepatology
36, 227–242 (2002).
2 Shaheen, N.J., et al. The burden of gastrointestinal and liver diseases. Am J Gastroenterol 101,
2128–2138 (2006).
3 Rockey, D.C., et al. Liver biopsy. American Association for the Study of Liver Disease (AASLD),
position paper, 2009.
4 Bravo, A.A., et al. Liver biopsy. N Engl J Med 344(7), 495-500 (2001).
5 Smith, J.O., Sterling, R.K. Systematic review: non-invasive methods of fibrosis analysis in chronic
hepatitis C. Aliment Pharmacol Ther 30(6), 557-76 (2009).
6 Stebbing, J., et al. A meta-analysis of transient elastography for the detection of hepatic fibrosis.
J Clin Gastroenterol 44(3), 214-9 (2010).
7 Carlson, J.J., et al. An evaluation of the potential cost-effectiveness of non-invasive testing strategies
in the diagnosis of significant liver fibrosis. J Gastroenterol Hepatol 24(5), 786-91 (2009).
8 Talwalkar, J.A. Elastography for detecting hepatic fibrosis: options and considerations.
Gastroenterology 359(1), 299-302 (2008).
9 Yin, M,. et al. Assessment of hepatic fibrosis with magnetic resonance elastography. Clin Gastroentero
5(10), 1207-1213 (2007).
10 Afdhal, N.H., Nunes, D. Evaluation of liver fibrosis: a concise review. Am Gastroentero, 99(6), 1160-74 (2004).
11 Bruguera, M., et al. A comparison of the accuracy of peritoneoscopy and liver biopsy in the
diagnosis of cirrhosis. Gut 15, 799-800 (1974).
12 Poniachik, J., et al. The role of laparoscopy in the diagnosis of cirrhosis. Gastrointest Endosc 43,
568-71 (1996).
13 Pagliaro, L., et al. Percutaneous blind biopsy versus laparoscopy with guided biopsy in diagnosis
of cirrhosis. Dig Dis Sci, 28, 39-43 (1983).
14 Olsson, R., et al. Sampling variability of percutaneous liver biopsy in primary sclerosing cholangi-
tis. J Clin Pathol 48, 933-5 (1995).
15 Angelucci, E., et al. Needle liver biopsy in thalassemia: analyses of the diagnostic accuracy and
safety in 1184 consecutive biopsies. Br J Haematol 89, 757-61 (1995).
16 Abdi, W., et al. Sampling variability on percutaneous liver biopsy. Arch Intern Med 15, 329-35 (1979).
17 Maharaj, B., et al. Sampling variability and its influence on the diagnostic yield of percutaneous
needle biopsy of the liver. Lancet 1, 523-5 (1986).
18 Perrault, J., et al. Liver biopsy: complications in 1000 inpatients and outpatients. Gastroenterology
74, 103-106 (1978).
19 McGill, D.B., et al. A 21-year experience with major hemorrhage after percutaneous liver biopsy.
Gastroenterology 99, 1396-1400 (1990).
20 Ehman, E.C., et al. Vibration safety limits for magnetic resonance elastography. Phys Med Biol
53(4), 925-935 (2008).
21 Wong, J., et al. Pretreatment evaluation of chronic hepatitis C: risk, benefits, and costs. JAMA 280,
2088–93 (1998).
22 Myers, R.P., et al. Utilization rates, complications and costs of percutaneous liver biopsy: a
population-based study including 4275 biopsies. Liver Int, 705-12 (2008).
23 DeKoven, M. Cost comparison: liver biopsy versus abdominal MRI. Memo to GE Healthcare from
IMS Health Incorporated. May 25, 2010.
24 Huwart, L., et al. Magnetic resonance elastography for the non-invasive staging of liver fibrosis.
Gastroenetrology, 135(1), 32-40, (2008).
MRE Supplement • Autumn 201010
wh i te p a p er M ag n et i c R es o n a n c e E l ast o gra p hy
30. Sound diagnosis
has a new look.
GE Healthcare
MR Elastography —
a picture of confidence
Today, a new technique known as MR elastography can capture
a compelling visual image of the liver, using sound waves to detect
the stiffness of tissue that can indicate liver disease.
How elastography works
The image is captured in as little
as 14 seconds, or one breath hold,
in three steps:
A special MRI technique images
minute displacements of the tissue
that result from wave propagation.
A simple, drum-like driver generates
acoustic waves within the tissue
of interest.
An advanced mathematical technique
generates maps of tissue stiffness,
known as “elastograms.”
30
33. 33
48 SignaPULSE • Spring 2008
On few occasions, medical advancements bring together
the new with the old. This is the case with MR-Touch. More than
just an a new pulse sequence, MR-Touch, is an MR elastogra-
phy (MRE) technique that brings together advanced MR imag-
ing with the age-old clinical skill of touch palpation.
MR-Touch provides an imaging counterpart to the physical
examination technique called palpation. For centuries,
clinicians have used simple touch to assess the mechanical
properties of tissue, and this has served as an incredibly
powerful diagnostic tool to detect diseases. MR-Touch allows
physicians to assess these same tissue properties at a much
higher sensitivity than can be achieved by palpation and in
regions of the body that are inaccessible to palpation.
MR elastography – what is it?
Invented at Mayo Clinic (Rochester, MN), MRE is a technology
that employs low frequency mechanical sound waves in
combination with MRI to probe the mechanical properties
of tissue. The technique is implemented as a software and
hardware upgrade to a conventional MR scanner and can
be easily included in standard MRI protocols.
During MRE acquisition, mechanical waves in the range
of 40 Hz to 200 Hz are generated in the tissues of interest
using a compact, nonmetallic MR compatible acoustic driver
device that is placed in contact with the body. The vibration
causes no discomfort and has an amplitude that is typically
less than 0.1 mm, falling well within established safety
limits for vibration exposure.1
A special phase-contrast MRI
sequence is used to image the pattern of propagating
mechanical waves within the body. This sequence is capable
of depicting waves with amplitudes as small as the wavelength
of light.2
Advanced software algorithms are then used to
automatically process the wave information to create
“elastograms,” which represent tissue stiffness on
a color scale.
The special cyclic motion sensitizing gradients that are
used for wave imaging can be potentially incorporated into
virtually any MR pulse sequence, including spin echo, gradient
echo, and echo-planar methods. The MRE sequence is
also compatible with parallel-imaging and motion artifact
reduction techniques such as gradient moment nulling
and spatial pre-saturation.
Advances in medicine come about
in a variety of ways: new technologies
that allow clinicians to visualize body
structures and functions they’ve never
seen before, novel therapies that
bring new hope to patients, and basic
advances in the understanding of the
molecular basis of disease that offer
physicians new capabilities in prediction
and prevention of illness.
A New Touch
for MR Imaging
i ssue s p o t l i ght mr e l ast o gra p hy
34. 34
49A GE Healthcare MR publication • Autumn 2008
Figure 1: MR elastography is used here
to characterize the relative stiffness in soft
tissue. Top row: Conventional MR images of
two different individuals. Center row:
Mechanical waves are generated in the
upper abdomen with an acoustic driver
device and imaged with the MRE technique.
Bottom row: The wave information is
processed to generate “elastograms,”
showing the stiffness of tissue. The patient
on the right has elevated tissue stiffness,
consistent with moderately advanced liver
disease. The patient on the left has a normal
liver stiffness appearance.
Soft Hard
ImagescourtesyofMayoClinic,Rochester,MN.
T2
Wave Image
Elastogram
Figure 2: Left: Conventional MR image shows a mass in the liver. Center: Mechanical waves are
imaged in the liver, using an MRE sequence. Right: The wave information is processed to generate
an elastogram, which indicates that the mass (arrow) is very hard, consistent with a malignant tumor.
Soft
Hard
ImagescourtesyofMayoClinic,Rochester,MN
T2 Wave Image Elastogram
Discussion
With the advent of MRI, radiologists learned to understand the basic T1, T2, and
proton density contrast provided by this modality and how it could be used to
depict anatomy and characterize tissues. Yet that was just the beginning. Over
the years, researchers have introduced techniques for imaging many new properties
including, chemical shift, flow, diffusion, perfusion, and BOLD contrast, yielding
powerful new diagnostic applications.
MRE provides a different type of contrast – tissue stiffness. Initial exploration of
this new capability has focused on diseases that are already known to cause local
changes in tissue stiffness. MRE is a non-invasive, pain free procedure. The addition
of MRE to a standard MRI protocol enhances the comprehensive nature of the
diagnostic exam. Countless other applications remain to be explored.3
At Mayo Clinic, Richard Ehman, MD, and colleagues have been evaluating MRE
to non-invasively measure tissue stiffness (Figure 1). Dr. Ehman and his group
are also exploring many other applications of MRE (Figure 2).
In recent years, researchers have become more aware of the profound way in which
the mechanical environment of tissue affects the behavior of cells. Abnormal tissue
stiffness is now thought to contribute to the development of many diseases. MRE
provides access to a new, largely unexplored, set of imaging biomarkers that
await investigation. n
References:
1. Ehman EC, Rossman PJ, Kruse SA, et al. Vibration safety
limits for magnetic resonance elastography. Phys Med Biol
2008;53(4):925-935.
2. Muthupillai, R., D.J. Lomas, P.J. Rossman, et al. Magnetic
resonance elastography by direct visualization of propagating
acoustic strain waves. Science, 1995. 269(5232): p. 1854-1857.
3. Talwalker JA, Yin M. MR Elastography inspires new wave of
hepatic imaging. Diagnostic Imaging 2008; 30(8):20-27.
4. Venkatesh SK, Yin M, Glockner JF, et al. MR elastography of liver
tumors: preliminary results. American Journal of Roentgenology.
2008;190:1534–40.
Lloyd Estkowski, MR manager for
Body Applications at GE Healthcare,
contributed to this article.
mr e l ast o gra p hy i ssue s p o t l i ght
35. 35
GE Healthcare
Drop a pebble in a pool of water Drop a pebble in a pool of gel
Wave Length
Short Long
StiffnessSoft Hard
New Touch in MR Imaging – extension of diagnosing by Touch
Vibration Acquisition Reconstruction
Shear waves
generated by external
acoustic driver.
Shear waves
transmitted to tissue
by passive driver.
Inversion algorithm
used to convert
wave images into
stiffness map
Active driver
Sound Waves Wave Image
Passive driver
Shear waves Elastogram
HardSoft
MRE Scan
External acoustic
driver triggered by
PSD.
MEG gradient
synchronized with
external acoustic
vibrations
Shear waves captured using phase
contrast gradients GRE with modified
cyclic motion-encoding gradients
Motion Synthesis
MR-Touch - Implementation
MR Elastography - Concept
36. 36
63A GE Healthcare MR publication • Spring 2010
The Sound Diagnosis
No matter how you look at it, MR Elastography can provide
new information and options – and it’s here today
By Vinod S. Palathinkara, PhD, Lloyd Estkowski, and David W. Lee, PhD
While MR Elastography (MRE) is an innovative technology,
an investment in MRE can bring immediate clinical value
to patients. MRE gives referring physicians a powerful new
option for liver assessment. It is a new tool that provides
diagnostic informatioin without the discomfort and risk of
complications due to invasive procedures, enabling more
frequent evaluation when closer monitoring is needed. By
creating a vivid visual representation of liver tissue stiffness,
MRE helps radiologists deliver a more confident diagnosis.
MRE enables diagnostic procedures at a lower cost than
previous techniques. Both comprehensive and non-invasive,
the technique can appeal to patients and referring physicians,
and can help expand the role of radiology into new areas.
More than anything else, MRE holds the promise of better
outcomes at lower costs to the overall healthcare system.
Chronic liver disease and cirrhosis are major public
health problems worldwide. In 2004, these conditions were
associated with nearly 40,000 deaths and a cost of at least
$1.4 billion for medical services in the U.S. alone.1,2
These
figures are expected to increase due to aging, obesity,
and end-stage liver disease caused by chronic hepatitis C
infection. The major biological process responsible for
clinical liver disease is progressive hepatic fibrosis.
37. 37
64 SignaPULSE • Spring 2010
is effective for distinguishing normal, soft-liver tissue from
stiff fibrotic liver tissue with a very high negative predictive
value. The severity of increased stiffness was shown to
allow moderate to severe fibrosis to be distinguished
non-invasively from mild fibrosis.
It is important to assess the accuracy of MRE in relation to
the accuracy of liver biopsy. A review of the available data
on the accuracy of needle liver biopsy to define the stage
of fibrosis reveals that significant sampling and interpretive
error affects the assessment of liver biopsy. Needle liver
biopsy assesses only about 1/50,000 of the volume of the
liver and so it may be affected by substantial sampling
error.9
Autopsy and laparoscopy studies that have evaluated
the accuracy of liver biopsy for staging fibrosis and diagnos-
ing cirrhosis have clearly shown that cirrhosis is missed on a
single blind liver biopsy in 10% to 30% of cases.10,11,12,13,14
The
Figure 1. Mean shear stiffness measurements of the liver for normal
volunteers and patients at different fibrosis stage
ReprintedfromClinicalGastroenterologyandHepatology,Vol5,YinMenget
al.“AssessmentofHepaticFibrosiswithMagneticResonanceElastography.”
1207-1213,copyright(2007),withpermissionfromElsevier.
MeanLiverStiffness(kPa)
Normal Chronic Liver Disease
Stage
F0
(35)
10
9
8
7
6
5
4
3
2
1
0
(14) (6) (5) (5) (18)
Stage
F1
Stage
F2
Stage
F3
Stage
F4
Liver biopsy is the current gold standard for detecting hepatic
fibrosis. There are, however, limitations with the technique
that include poor acceptance by patients, measurement
errors, and cost.3,4
Current non-invasive alternatives to
liver biopsy are serum-based testing,5
which is not reliable
for detecting early disease, and transient ultrasound
elastography,6
which has technical limitations in patients
with obesity and conditions such as ascites. 21
MRE, a technique developed by Richard Ehman, MD, and
colleagues at Mayo Clinic (Rochester, MN), uses low-frequen-
cy mechanical waves to probe the elastic properties of
tissue. These mechanical waves are generated in the body
through an external acoustic driver, which are then imaged
using a special phase-contrast MR sequence. Using a
sophisticated mathematical algorithm, the mechanical wave
data collected by the MR is then used to generate an
“elastogram,” – a diagnostic image that depicts tissue
stiffness.
In its spirit of bringing the latest technology to clinicians, in
July 2009, GE Healthcare commercially launched MR-Touch,
an MR-Elastography (MRE) application, available on the
Optima MR450w and Signa HDxt systems. GE Healthcare
is currently working to expand its availability to other
1.5T systems.
Clinical value of MRE
Yin et al. evaluated the diagnostic performance of an
optimized MR elastography protocol for assessing hepatic
fibrosis among patients with diverse causes of chronic liver
disease and in normal individuals.8
The summary of mean
values and variance of liver stiffness from the 35 normal
volunteers and 48 patients with chronic liver disease are
shown in Figure 1.
When assessed by stage of fibrosis, the mean liver stiffness
value increased systematically with excellent correlation
between histologic fibrosis and shear stiffness obtained with
MR elastography (R2
= 0.94, P 0.001) (Figure 1). The study
results supported the hypothesis that MR elastography
MRE has the potential to significantly reduce cost
as a triage for liver biopsy.
te c h n i c a l i n n o vat i o n mag n et i c res o n a n c e e l ast o gra p hy
38. 38
65A GE Healthcare MR publication • Spring 2010
Complications Risk
Death 1:10,000 – 1:12,000
Bleeding 1:100
Bile leak 1:1,000
Any pain 1:4
Significant pain 1:10 – 1:20
Figure 2. Major complications of liver biopsy3,18,19
majority of this error is due to the under-staging of disease.
Both the size of the biopsy and number of biopsies taken
have a major effect on accuracy. Abdi et al. report that the
correct diagnosis of cirrhosis with a single biopsy increased
from 80% to 100% when three specimens were analyzed.15
Similarly, in a study that evaluated the agreement between
three biopsies taken at a single setting, Maharaj reported
that cirrhosis was identified in all three biopsies in only 50%
of the cases.16
Rockey et al. suggest that sampling variability appears to
be one of the major limitations of liver biopsy.17
In a study
of 124 patients with chronic HCV infection who underwent
laparoscopy-guided left and right lobe liver biopsies, 33%
of cases had discordant results by at least one histological
stage. A smaller but substantial proportion of biopsies were
discordant by at least two stages. Similarly, a single liver
biopsy specimen may fail to distinguish steatohepatitis from
simple steatosis and may mis-stage the disease by one (or
less frequently), two stages if the specimen is much smaller
than 2 cm. The authors caution that although even small
biopsy specimens may be sufficient for diagnostic purposes
in certain situations, the possibility that sampling variability
exists must be recognized, so that the absence of key findings
does not rule out a suspected diagnosis. By showing infor-
mation about liver stiffness over one or more cross sections
of the entire liver, MR elastography provides
a more comprehensive view than before available.
Patient comfort of MRE
According to Rockey et al., pain is the most common
complication of liver biopsy, occurring in up to 84% of
patients.3
The most important complication of liver biopsy
is bleeding. Severe bleeding requires hospitalization, has an
increased likelihood of transfusion or radiological intervention,
or surgery. Less severe bleeding is defined as that sufficient
to cause pain or reduced blood pressure, but not requiring
transfusion or intervention. Mortality after liver biopsy is
usually related to hemorrhage and is very uncommon.
MRE does not use contrast or ionizing radiation and provides
a completely non-invasive test of liver tissue elasticity, thus
resulting in high patient comfort. According to Ehman at al.,
the vibration has amplitude in abdominal tissue that
is very small (typically less than 0.1 mm), and does
not cause discomfort.18
Health care system costs
Given the novelty of the MRE technology, peer-reviewed
academic or medical literature evaluating the potential
cost-effectiveness of this non-invasive testing strategy in
the diagnosis and management of liver fibrosis is currently
limited. There is, however, evidence to suggest that MRE has
the potential to lower the overall costs in the management
of liver diseases.
Carlson et al. used data originally reported by Wong et al.
and adjusts for inflation using Consumer Price Index to
arrive at an estimated cost of liver biopsy of $1,255*, but
this estimate understates the true costs of a liver biopsy
because it excludes procedure-related morbidities.7,19
Myers
et al. used administrative databases from a large Canadian
Health Region to identify percutaneous liver biopsies performed
between 1994 and 2002.20
The study found that between
1994 and 2002, 3,627 patients had 4,275 liver biopsies.
Thirty-two patients (0.75%) had significant biopsy related
complications. The median direct cost of a hospitalization
for complications was $4,579 Canadian (range $1,164-$29,641).
As a new technology, MRE is currently not reimbursed
with its own CPT code*. Because the acquisition time is
very short, the addition of MRE for liver evaluation into a
conventional MRI examination protocol adds very little to
the typical examination time of 30 to 45 minutes. If MRE is
not reimbursed any more than a typical abdominal MRI
In liver biopsies, the absence of key findings does
not rule out a suspected diagnosis.
*Figures associated with US rates of reimbursement. Not globally applicable.
mag n et i c res o n a n c e e l ast o gra p hy te c h n i c a l i n n o vat i o n