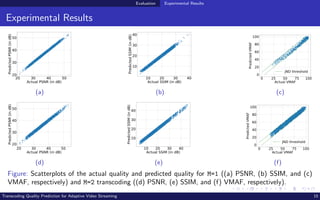
The document discusses transcoding quality prediction for adaptive video streaming, outlining the motivation for using transcoding in latency-sensitive applications and introducing a multi-stage transcoding model. It details the architecture of a transcoding quality prediction model (TQPM), including input video segment characterization, transcoding model characterization, and quality prediction. Experimental results illustrate the performance and accuracy of the TQPM in predicting various video quality metrics like PSNR, SSIM, and VMAF in different transcoding scenarios.


![M-stage transcoding model
M-stage transcoding model
e d e d e d
Input
Video
Segment
Reconstructed
Video
Segment
M-Stage Transcoding System Model
...
b
~
1 b
~
2 b
~
M
1 1 2 2 M M
Stage 1 Stage 2 Stage M
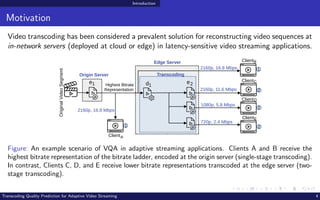
Figure: M-stage transcoding model considered in this paper. Here, ei and di represent the encoding and
decoding in ith
stage of transcoding, while b̃i denotes the target bitrate of ei where i ∈ [1, M].
The generalized M-stage transcoding model for HAS consists of a series of M encoders and
M decoders in a chain.
M=1 transcoding corresponds to the single-stage transcoding while M=2 transcoding corre-
sponds to the two-stage transcoding.
Transcoding Quality Prediction for Adaptive Video Streaming 6](https://image.slidesharecdn.com/videostreaming1rezafarahaniuniversityofklagenfurt-230504184243-f9f3401b/85/TQPM-pdf-6-320.jpg)
![TQPM Architecture
TQPM Architecture
...
...
...
E
h
L L L
h h
E E
1
1
1
T
T
X
X1 T
Video
Quality
Prediction
Model bM
~
V
^
b2
~ b1
~
...
Input
Video
Segment
E T
b1
~
b2
~
.
.
.
bM
~
[T x (M+3)]
I
II
I Input Video Segment Characteristics
II M-Stage Transcoding Model Characteristics
~
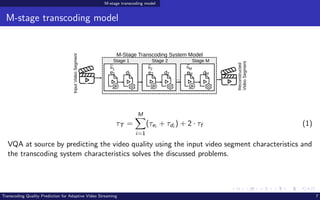
Figure: TQPM architecture
The TQPM architecture comprises three steps:
input video segment characterization
transcoding model Characterization
video quality prediction
Transcoding Quality Prediction for Adaptive Video Streaming 8](https://image.slidesharecdn.com/videostreaming1rezafarahaniuniversityofklagenfurt-230504184243-f9f3401b/85/TQPM-pdf-8-320.jpg)


![TQPM Architecture Phase 1: Input video segment characterization
Input video segment characterization
The video segment is divided into T chunks with a fixed number of frames (i.e., fc) in each
chunk. The averages of the E, h, and L features of each chunk are computed to obtain the
reduced reference representation of the input video segment, expressed as:
X = {x1, x2, .., xT } (7)
where, xi is the feature set of every ith chunk, represented as :
xi = [Ei , hi , Li ] ∀i ∈ [1, T] (8)
Transcoding Quality Prediction for Adaptive Video Streaming 11](https://image.slidesharecdn.com/videostreaming1rezafarahaniuniversityofklagenfurt-230504184243-f9f3401b/85/TQPM-pdf-11-320.jpg)
![TQPM Architecture Phase 2: Transcoding model Characterization
Phase 2: Transcoding model Characterization
e d e d e d
Input
Video
Segment
Reconstructed
Video
Segment
M-Stage Transcoding System Model
...
b
~
1 b
~
2 b
~
M
1 1 2 2 M M
Stage 1 Stage 2 Stage M
The settings of the encoders in the M-stage transcoding process, except the target bitrate-
resolution pair, are assumed identical.5
The resolutions corresponding to the target bitrates in the bitrate ladder are also assumed
to be fixed.
The transcoding model can be characterized as follows:
B̃ = [b̃1, b̃2, .., b̃M] (9)
where b̃i represents the target bitrate of the ei encoder.
5
Vignesh V Menon et al. “EMES: Efficient Multi-Encoding Schemes for HEVC-Based Adaptive Bitrate Streaming”. In: ACM Trans. Multimedia Comput.
Commun. Appl. 19.3s (2023). issn: 1551-6857. doi: 10.1145/3575659. url: https://doi.org/10.1145/3575659.
Transcoding Quality Prediction for Adaptive Video Streaming 12](https://image.slidesharecdn.com/videostreaming1rezafarahaniuniversityofklagenfurt-230504184243-f9f3401b/85/TQPM-pdf-12-320.jpg)
![TQPM Architecture Phase 3: Video quality prediction
Phase 3: Video quality prediction
B̃ is appended to xi , which is determined during the input video segment characterization phase,
to obtain:
˜
xi = [xi |B̃]T
∀˜
xi ∈ X̃, i ∈ [1, T] (10)
The predicted quality v̂b̃M |..|b̃1
can be presented as:
v̂b̃M |..|b̃1
= f (X̃) (11)
The feature sequences in the series X̃ are input to the LSTM model, which predicts visual quality
v̂ for the corresponding input video segment and chain of encoders in the transcoding process.
Transcoding Quality Prediction for Adaptive Video Streaming 13](https://image.slidesharecdn.com/videostreaming1rezafarahaniuniversityofklagenfurt-230504184243-f9f3401b/85/TQPM-pdf-13-320.jpg)