SlideShare a Scribd company logo
1 of 56
Download to read offline
Sector Note Oil and Gas │ Vietnam │ March 27, 2019
IMPORTANT DISCLOSURES, INCLUDING ANY REQUIRED RESEARCH CERTIFICATIONS, ARE PROVIDED AT THE END OF THIS REPORT. IF THIS REPORT IS DISTRIBUTED IN
THE UNITED STATES IT IS DISTRIBUTED BY CIMB SECURITIES (USA), INC. AND IS CONSIDERED THIRD-PARTY AFFILIATED RESEARCH.
Powered by the
EFA Platform
Oil & Gas Exp & Prodn
Time for some bottom-fishing
■ Midterm reinvestment economics requires crude oil price to stay at US$60-
70/bbl, based on our estimates.
■ We expect Vietnam to scale up oil and gas exploration, as national energy
security is under threat.
■ We initiate coverage on the oil and gas sector with a Neutral rating. Upstream
oilfield services stocks, namely PVS and PVD, are our top picks.
Crude oil market has rebalanced
The crude oil market has rebalanced since 2016, in our view, thanks to stalled global
supply growth and stronger demand from Asia Pacific. While we think global oil demand
may peak by 2030F, we believe the world still needs to increase exploration to replace
the current depleting supply. For 2019-22F, we expect the crude oil price to stay in the
range of US$60-70/bbl.
We expect Vietnam to scale up oil and gas exploration, as national
energy security is under threat
Assuming no further discoveries, we expect Vietnam’s oil and gas production to decrease
by c.12% annually between 2018-25F. We believe this will leave a big future supply gap
to be filled as PetroVietnam (PVN, Unlisted) expects domestic demand for oil and gas to
increase by 5-10% annually between 2018-25F. We expect Vietnam to increase exploring
capital expenditure by 50% annually in 2019-20F in order to replenish current reserves
and boost production output.
Upstream oilfield services plays, PVS and PVD, are our top picks
We hold a positive view on PetroVietnam Technical Services Corp (PVS), a diversified
oilfield services company, as we think it is a key beneficiary of Vietnam’s push for
renewed dry gas reserves. With total order backlog of c.US$2,000m, we expect PVS to
post a net profit CAGR of 25.4% in FY18-21F. We also hold a positive view on
PetroVietnam Drilling & Well Services Corp (PVD), the sole commercial drilling contractor
in Vietnam. We view PVD’s rig fleet as young enough to benefit from the anticipated
regional offshore drilling market upturn. We expect PVD’s profitability to turn around in
FY19-21F and forecast a net profit CAGR of 47.6%.
We hold a conservative view on GAS, the wholesale gas distributor
We foresee a challenging time ahead for PetroVietnam Gas (GAS), the monopoly
wholesale distributor of dry gas in Vietnam. While the flat global oil price outlook in FY19-
21F is likely to weigh on GAS’s sales growth, Vietnam’s depleting gas supply could drive
up GAS’s input costs. We forecast GAS’s net profit to decrease by 7.8% p.a. in FY19-
21F.
Sector risks and potential catalysts
The main downside risk is the geopolitical dispute between Vietnam and China, which
may put major oil and gas projects on hold, especially the Blue Whale and Red Emperor
projects, in our view. Potential upside catalysts include more supply disruptions (i.e.
Saudi Arabia sanctions) and higher global oil demand from Asia and Europe.
Figure 1: Vietnam’s natural gas outputs (bcm) assuming no new discoveries
SOURCES: VND RESEARCH, BANCO BILBAO VIZCAYA ARGENTARIA (BBVA), BLOOMBERG
Vietnam
Neutral
Highlighted Companies
PetroVietnam Technical Services Corp
ADD, TP VND25,000, VND20,600 close
PVS, as an offshore engineering,
procurement and construction (EPC)
contractor, is the biggest beneficiary of
PetroVietnam’s increasing upstream
capital expenditure. We expect PVS to
participate in almost all the current key oil
and gas projects, including Sao Vang Dai
Nguyet, Block B, Su Tu Trang Phase 2
and others.
PetroVietnam Gas Jsc
HOLD, TP VND91,600, VND97,200
close
The quick depletion of cheap gas
supplies would pressure GAS’s input
costs to rise, in our view. Meanwhile, we
see little room for GAS to increase its
output prices due to the flat outlook for
crude oil prices in the short-to-medium
term.
PetroVietnam Drilling & Well Services
Corp
ADD, TP VND20,000, VND17,550 close
As Vietnam needs to scale up its oil and
gas exploration activities quickly, we
foresee PVD securing more domestic
projects in the medium term. We also
expect charter rates for offshore drillers
to improve, with Brent oil prices expected
to exceed US$60/bbl in the coming
years.
Summary Valuation Metrics
Please note that our sector recommendation in the third bullet
point on page 1 has been corrected to Neutral. It appeared as
Overweight in the previously published version of this report.
Analyst(s)
Linh VU Viet
T (84) 38 955 2199
E linh.vuviet@vndirect.com.vn
Mai PHAM
T (84) 94 328 0850
E mai.phamle@vndirect.com.vn
P/E (x) Dec-18E Dec-19F Dec-20F
PetroVietnam Technical Services 10.67 8.17 6.33
PetroVietnam Gas Jsc 15.46 19.09 20.97
PetroVietnam Drilling & Well Services 35.50 22.20 56.50
P/B (x)
PetroVietnam Technical Services 0.69 0.63 0.63
PetroVietnam Gas Jsc 4.47 4.39 4.26
PetroVietnam Drilling & Well Services 0.49 0.49 0.50
Dividend Yield
PetroVietnam Technical Services 3.11% 4.06% 5.24%
PetroVietnam Gas Jsc 3.32% 1.11% 0.78%
PetroVietnam Drilling & Well Services 0.00% 0.00% 0.00%
Oil and Gas │ Vietnam
Oil & Gas Exp & Prodn │ March 27, 2019
2
Time for some bottom-fishing
INVESTMENT SUMMARY
Crude oil market has been rebalanced
We believe global oil prices have come full circle since the historic collapse in
4Q14, driven by the supply glut from shale oil. We think the rebalancing of the oil
market has been driven by stalled global supply growth and stronger demand
from Asia Pacific. Accordingly, average Brent crude oil price touched
US$54.1/bbl in 2017 (+24.0% yoy) and US$71.2/bbl in 2018 (+31.5% yoy).
Crude oil prices crashed in late-2014
as OPEC, in a bid to kill off
competition from US shale oil, decided
to flood the market with excess supply
of oil which drove the price down
dramatically. However, this strategy
failed and OPEC had to agree on a
supply cut to rebalance the market by
the end of 2016. Crude oil prices have
gradually recovered since then.
Figure 2: Historical Brent crude oil price (US$/bbl)
SOURCES: ENERGY INFORMATION ADMINISTRATION, VND RESEARCH, BLOOMBERG
While the correction in 4Q18 raised concerns about the crude oil price possibly
falling back into bearish territory, we believe that sentiment is running ahead of
fundamentals due to a combination of broad equity market sell-off and growing
fears of a global economic slowdown, as well as due to Saudi Arabia’s reduced
geopolitical leverage to affect cuts, following the death of Saudi journalist Jamal
Khashoggi in Oct 2018.
We believe the big correction oil prices
in 4Q18 was transitory and driven
more by sentiment than by
fundamental. Since Jan 2019, global
oil prices have stabilised and
recovered, helped by the impact of
certain key OPEC countries cutting
supplies by 2.2mbd to rebalance the
market.
Figure 3: Movements of Brent crude oil price (US$/bbl) in 2018
SOURCES: ENERGY INFORMATION ADMINISTRATION, VND RESEARCH, BLOOMBERG
Oil and Gas │ Vietnam
Oil & Gas Exp & Prodn │ March 27, 2019
3
Fundamentally, we still expect the global crude oil market to remain well
balanced in 2019F, once the production cuts from Organization of the Petroleum
Exporting Countries (OPEC) take effect and prevent inventories from building
further. Barring a severe economic slump, we believe global oil demand will
grow at roughly the pace seen in recent years, powered by emerging economies
which, aside from China, continue to be in good health.
We also see the shale boom, which caused an oil-price crash in 2014, as not
being sufficient to pose a significant threat to global crude oil prices in the
medium term. Rystad Energy estimates that shale oil can only account for a
maximum of 8-10% of global crude oil supply till 2040F.
Fundamentally, we still expect the
global crude oil market to remain well
balanced in 2019F, once the
production cuts from OPEC take effect
and prevent inventories from building
further.
Figure 4: Crude oil demand-supply balance (mbd)
SOURCES: ENERGY INFORMATION ADMINISTRATION, VND RESEARCH
We also see the shale boom, which
caused an oil-price crash in 2014, as
not being sufficient to pose a
significant threat to global crude oil
price in the medium term.
Figure 5: Global oil demand (mbd) based on Rystad Energy estimates
SOURCES: RYSTAD ENERGY, VND RESEARCH
In the long term, while Rystad Energy expects future oil demand growth to peak
by 2030F, by which time other energy sources may become more cost-
competitive (i.e. renewables and electric vehicles) and socially acceptable
(nuclear), we still see a certain long-term need for crude oil due to its competitive
pricing and widespread popularity.
We note that crude oil is used not just for transportation. In fact, the fastest-
growing driver for oil consumption is chemicals. A rising middle class globally
means the demand for petrochemicals will also increase as they are the base
constituents of many basic products from paint to personal care items, growth in
demand for which tends to track overall consumption growth; also, there are no
obvious substitutes for these petrochemicals in their application areas.
Oil and Gas │ Vietnam
Oil & Gas Exp & Prodn │ March 27, 2019
4
As such, we see long-term growth in demand for petrochemicals by
manufacturers, which should support oil demand, in our view.
Figure 6: Global oil supply if oil discoveries remain at 2017-18 levels (mbd)
SOURCES: RYSTAD ENERGY ESTIMATES, VND RESEARCH
In terms of supply, there is also a pressing need to scale up global exploration
activities to boost reserves. Due to significant cutbacks in exploration spending
since 2014, global oil discoveries fell to just c.7billion metric tonnes of oil
equivalent (btoe) in 2017, the lowest level since the 1940s and down sharply
from an average of c.15 btoe per year discovered in the 2004-14 period
(according to Energy Information Administration). Given the rapid depletion of
existing oil fields, if exploration activities remain as sluggish as in 2017, the
world is likely to face a supply shortage of c.35mbd by 2040F (according to
Rystad Energy’s estimates).
Due to significant cutbacks in
exploration spending since 2014,
global oil discoveries fell to just c.7
btoe. in 2017.
Figure 7: Global conventional oil discoveries (btoe)
SOURCES: ENERGY INFORMATION ADMINISTRATION, VND RESEARCH
Given the rapid depletion of existing
oil fields, if exploration activities
remain as sluggish as they were in
2017, the world is likely to face a
supply shortage of c.35mbd by 2040F,
according to Rystad Energy.
Figure 8: Global oil supply (mbd) if oil discoveries remain as low as 2017-18 levels
SOURCES: RYSTAD ENERGY ESTIMATES, VND RESEARCH
From 2019-21F, we expect that extraction economics will demand that crude oil
price trades within the US$60-70/bbl range, with an approximately 50% increase
in extraction costs from 2015 levels as the current shallow-water oil fields get
Oil and Gas │ Vietnam
Oil & Gas Exp & Prodn │ March 27, 2019
5
depleted and extraction moves to deeper-water oil fields with higher complexity
and development cost.
From 2019-21F, we expect that
extraction economics will demand that
crude oil price trades within a US$60-
70/bbl range, which is…
Figure 9: Breakeven cost of global new crude oil supply (US$/bbl) in 2019-21F
SOURCES: RYSTAD ENERGY ESTIMATES, VND RESEARCH
… approximately 50% higher than the
extraction cost in 2015 as the current
shallow-water oil fields get depleted
and extraction moves to deeper-water
oil fields with higher complexity and
development cost.
Figure 10: Breakeven cost of global crude oil supply (US$/bbl) in 2015
SOURCES: RYSTAD ENERGY ESTIMATES, VND RESEARCH
Typically, there is a broad range in general expectations of crude oil price for the
2019-22F period from international organisations. In our view, Brent crude oil
price will stay above US60$/bbl over the next four years, which aligns with the
US$60-70/bbl breakeven cost of new crude oil supply in 2019- 21F.
In our view, Brent crude oil price will
stay above US$60/bbl over the next
four years.
Figure 11: Brent crude oil price forecasts (US$/bbl) as at Dec 2018
SOURCES: RYSTAD ENERGY, BLOOMBERG, BANCO BILBAO VIZCAYA ARGENTARIA (BBVA), VND RESEARCH
Oil and Gas │ Vietnam
Oil & Gas Exp & Prodn │ March 27, 2019
6
Vietnam’s energy security is under threat in medium term
Vietnam’s oil and gas production has been declining at an annual rate of c.8% in
2015-18. This steep drop in production has roughly tracked the decline in capital
expenditure for exploration activities of PetroVietnam’s (PVN, Unlisted) – the
state-owned corporation responsible for national oil and gas activities in Vietnam
- since 2015, due to depressed crude oil prices. This lack of exploration has led
to insufficient new discoveries, with annual reserve growth falling to 4 million
tonnes of oil equivalent (mtoe) in 2017, the lowest level in history (according to
PetroVietnam).
Vietnam’s oil and gas production has
been declining at an annual rate of
c.8% in 2015-18.
Figure 12: Vietnam’s oil and gas production output (mtoe)
SOURCES: PETROVIETNAM, VND RESEARCH
The lack of exploration in the country
has led to insufficient new discoveries,
with annual reserves growth falling to
4mtoe in 2017, the lowest level in
history.
Figure 13: PetroVietnam’s capital expenditure (VND tr)
SOURCES: PETROVIETNAM, VND RESEARCH
Meanwhile, the majority of existing oilfields in Vietnam are already in their final
stages of production, with production outputs declining by 15-30% per year since
2016. If there are no oil new discoveries, we believe the domestic supply of
crude oil will not be sufficient to satisfy the feedstock demand from Binh Son
Refinery (BSR VN: UpCOM, Not Rated) from 2020F onwards. Note that BSR
currently relies entirely on domestic crude oil as feedstock.
If there are no new oil discoveries, we
believe the domestic supply of crude
oil will not be sufficient to satisfy the
feedstock demand from Binh Son
Refinery (BSR) from 2020F onwards.
Figure 14: Vietnam’s crude oil outputs assuming no new oil discoveries (m tonnes)
SOURCES: VIETNAM PETROLEUM INSTITUTE’S ESTIMATES, VND RESEARCH
Oil and Gas │ Vietnam
Oil & Gas Exp & Prodn │ March 27, 2019
7
The depletion of natural gas output is even more worrying to us as domestic
natural gas demand is expected by PetroVietnam to grow 50% by 2025F when
three new gas-fired power plants begin operation.
The depletion of natural gas output is
even more worrying to us.
Figure 15: Vietnam’s natural gas outputs (bcm) assuming no new discoveries
SOURCES: VIETNAM PETROLEUM INSTITUTE’S ESTIMATES, VND RESEARCH
We see a significant exploration scale-up already under way
The robust recovery of crude oil price since late 2016 has put Vietnam in a good
position to step up exploration activities after years of subdued investments. The
average oil extraction cost in Vietnam was ~US$45/bbl in 2018 (according to
Rystad Energy), below consensus forecasts for Brent crude oil prices of US$65-
70/bbl in 2019F. Given the looming energy security issues alluded to earlier, we
believe this might help to boost Vietnam’s exploration activities in the medium
term.
The average oil extraction cost in
Vietnam is ~US$45/bbl, below
consensus forecasts for Brent crude
oil prices of US$65-70/bbl in 2019F.
Figure 16: Breakeven field development cost (US$/bbl) by country in 2018
SOURCES: RYSTAD ENERGY’S ESTIMATES, VND RESEARCH
According to PVN’s business plan until 2020F, the target for annual growth of oil
and gas reserves is 20-40mtoe. This target, which is 2-4 times higher than the
estimated reserves growth of 10mtoe in 2018 (according to PetroVietnam), is
highly demanding given the escalated exploration cost of new discoveries, in our
view. As shelf oil fields run dry, the frontier of exploration will be pushed to more
remote areas which require higher levels of equipment, technology, and
expensive specialists.
Under intense pressure to increase discoveries and given the higher cost of
developing new oil fields, we expect Vietnam to increase capital expenditure for
oil exploration by c.40% annually in 2019-22F in order to replenish current
reserves and boost production output.
Oil and Gas │ Vietnam
Oil & Gas Exp & Prodn │ March 27, 2019
8
Under intense pressure to increase
discoveries and given the higher cost
of developing new oil fields, we expect
Vietnam to increase capital
expenditure for oil exploration by
c.40% annually in 2019- 22F.
Figure 17: PetroVietnam’s capex forecasts (VND tr) based on our estimates
SOURCES: VND RESEARCH
In the medium term, PetroVietnam is planning large oil exploration and drilling
projects like Ca Rong Do (Red Emperor), Ca Voi Xanh (Blue Whale) and Block
B-O Mon. According to PetroVietnam, those projects are reported to have the
largest oil and gas production potential in Vietnam.
Meanwhile, Sao Vang-Dai Nguyet and other gas fields are being developed in
parallel with the second phase of Su Tu Trang (White Lion) project to ensure
sufficient gas supply for the southeast region once two new gas-fired power
plants, namely Nhon Trach 3 and Nhon Trach 4, come into operation in 2021F.
Ca Rong Do, Sao Vang Dai Nguyet,
Block B – O Mon, and Ca Voi Xanh
are the largest oil and gas projects in
Vietnam to date.
Figure 18: PetroVietnam’s key oil and gas projects in medium term
SOURCES: VND RESEARCH
We also see the proposed revision of the petroleum law to further boost foreign
direct investment (FDI) in Vietnam’s exploration activities in the coming years. At
a recent energy seminar, Vice Chairman of Economic Committee – Mr Nguyen
Duc Kien unveiled that the Law on Petroleum will be amended, possibly
between 2019F and 2020F, to legally facilitate the development of Vietnam’s oil
and gas industry as well as a sustainable maritime economy until 2030F.
According to Vietnam Petroleum
Institute’s proposal, the revision of
petroleum law should be focused on
making the production-sharing
contract (PSC) more attractive to
foreign investors.
Figure 19: Possible revision of petroleum law 2008 – Production-sharing contract
SOURCES: VIETNAM PETROLEUM INSTITUTE, VND RESEARCH
According to Vietnam Petroleum Institute’s proposal, the revision of the
petroleum law should be focused on making the production sharing contract
Regulation Min. Max. Min. Max.
Income tax 10%-29% 7%-23% 32% 28%
Export duty 10% 10% 4% 0%
Allowable costs 50% 70% 70% 70%
Profit sharing to contractor 50% 83% 25%-83% 45%-90%
Resource tax - Crude oil 8%-25% 6%-20% 7%-23% 4%-20%
Resource tax - Natural gas 0%-10% 0%-6% 1%-6% 0%-6%
Current - Petroleum law 2008 Proposed revison
Oil and Gas │ Vietnam
Oil & Gas Exp & Prodn │ March 27, 2019
9
(PSC) more attractive to foreign investors. “In fact, foreign investors have spent
US$45bn on exploration but they have brought just US$21bn back to their
countries,” said Mr Tran Sy Thanh, PetroVietnam Chairman in Sep 2018.
VALUATION AND RECOMMENDATION
Initiate sector coverage at Neutral, with upstream oilfield
services stocks as our top picks
Typically, fluctuations in crude oil prices have the most impact on up-to-
midstream oil and gas companies. Even so, the link between oil prices and
earnings is generally nuanced for oil field service companies owing to their
dependence on exploration & production (E&P) activity which tends to track oil
prices but with a big time lag. Generally, it takes 1-2 years before oilfield service
companies start benefiting from upward movements in crude oil prices due to
the long lead times associated with a resumption of exploration activity.
Figure 20: EPS of key upstream oil and gas stocks (VND) Figure 21: EPS of key downstream oil and gas stocks (VND)
SOURCES: VND RESEARCH, COMPANY REPORTS SOURCES: VND RESEARCH, COMPANY REPORTS
We hold a positive view on PetroVietnam Technical Services Corp (PVS VN,
Add, TP: VND25,000) as we believe it will be the first beneficiary of the
expected recovery in Vietnam’s oil exploration activities. PVS is the sole
domestic contractor that provides engineering, procurement and construction
(EPC) services to offshore oil and gas projects in Vietnam. Currently, PVS is the
main EPC contractor for the Sao Vang Dai Nguyet project (total contract value of
c.US$850m). Other big projects in its pipeline are Su Tu Trang Phase 2, Nam
Du – U Minh, Blue Whale, and Block B – O Mon. The total order backlog for
these projects, while not yet disclosed in detail, could amount to US$2,000m,
based on our estimates. We initiate on PVS with an Add and TP of VND25,000,
based on a combination of DCF (weight 50%) and target FY19-21F P/E of 7.8x
(weight 50%).
We also hold a positive view on PetroVietnam Drilling & Well Services Corp
(PVD VN, Add, TP: VND20,000). As the need for more oil and gas discoveries
becomes increasingly pressing, Rystad Energy expects global capex for oilfield
services to bounce back and post a CAGR of 10.2% in FY18-22F. Drilling
contractors, in particular, are regarded as one of the earliest and primary
beneficiaries of such an upturn in global spending for offshore oilfield services.
We expect the jack-up utilisation rate to return to above 90% by 2023F (vs.
c.65% in 2018). We initiate coverage on PVD with an Add rating and TP of
VND20,000, based on a 50:50 weighting of DCF and 0.6x FY19-21F P/BV.
Oil and Gas │ Vietnam
Oil & Gas Exp & Prodn │ March 27, 2019
10
In contrast, we foresee a challenging time ahead for PetroVietnam Gas Jsc
(GAS VN, Hold, TP: VND91,600). We expect a declining profitability for the
company’s dry gas segment, which contributed some 50-55% of its total annual
gross profit in the FY15-18 period. While the selling price of this segment has
little upside due to the flat oil price outlook, the input price for this segment is
also facing upward pressure due to the quick depletion of the cheap domestic
gas supply. Thus, in FY18-21F, we forecast GAS’s EPS to decrease by 7.8%
p.a. We initiate coverage on GAS with a Hold rating and target price of
VND91,600, based on an equal weighting of DCF and target FY19-21F P/E
multiple of 18.0x.
At the same time, the scaling up of upstream exploration activities has had little
impact on the profitability of downstream refiners and distributors such as Binh
Son Refinery and Petrolimex (PLX VN, Not Rated).
Figure 22: Valuation snapshot for Vietnam oil and gas stocks under our coverage
SOURCES: VND RESEARCH, BLOOOMBERG (AS AT 26 MAR 2019)
Overall, we are more positive on mid-cap stocks PVS and PVD than the large-
cap GAS. Apart from their stronger fundamental outlook, we expect PVS and
PVD to benefit from the shift in investors’ focus in the Vietnam stock market
away from large-cap names to high-quality mid-cap names. In our view, there is
still a sizeable valuation gap between the large-cap stocks and hundreds of mid-
cap stocks (which are trading at half the large-cap valuations, based on our
estimates). In 1 Jan-31 Mar 2019, Vietnam’s mid-cap share prices have risen by
nearly 13%, higher than the 8.5% increase in large-cap share prices.
Figure 23: Global oil and gas peer comparison
Note: Not Rated forecasts based on Bloomberg consensus estimates; trailing 12 months (TTM)
SOURCES: VND RESEARCH, BLOOOMBERG (AS AT 26 MAR 2019)
3-year
EPS
5-yr TTM CY19F CY20F
CAGR
(%) 5-yr TTM CY19F CY20F 5-yr TTM CY19F 5-yr TTM CY19F
PV GAS GAS VN HOLD 97,200 91,600 8,010 13.8 16.4 19.3 20.9 -10.6% 3.5 4.2 4.0 3.8 28.2% 23.6% 20.6% 18.8% 15.7% 15.4%
PV Technical Services PVS VN ADD 20,600 25,000 420 8.7 9.8 8.7 6.6 -25.7% 0.7 0.9 0.8 0.8 14.6% 6.7% 7.0% 5.2% 3.1% 4.5%
PV Drilling PVD VN ADD 17,550 20,000 290 16.2 38.0 20.3 20.1 -66.4% 1.1 0.6 0.5 0.5 14.8% 1.4% 2.6% 6.3% 1.1% 1.3%
Company
Bloomberg
Ticker Recom.
Share
Price
(local
curr)
Target
Price
(local
curr)
Market
Cap
(US$ m)
P/E (x) P/BV (x) ROE (%) ROA (%)
3-year
EPS
5-yr TTM CY19F CY20F
CAGR
(%) 5-yr TTM CY19F CY20F 5-yr TTM CY19F 5-yr TTM CY19F
Gas distribution companies
PV GAS GAS VN HOLD 97,200 91,600 8,010 13.8 16.4 19.3 20.9 -10.6% 3.5 4.2 4.0 3.8 28.2% 23.6% 20.6% 18.8% 15.7% 15.4%
PTT PLC PTT TB HOLD 48.50 53.00 45,088 17.1 10.4 10.9 10.3 -29.0% 1.6 1.6 1.4 1.3 11.3% 7.7% 9.0% 6.6% 4.7% 6.4%
Indraprastha Gas IGL IN NOT RATED 301.3 N/A 2,650 17.7 25.4 N/A N/A 28.0% 0.6 0.6 0.6 N/A 3.4% 2.2% N/A 3.5% 4.7% N/A
China Gas Holdings 384 HK ADD 28.15 40.00 2,271 18.6 22.1 17.50 14.10 28.7% 3.6 5.3 3.8 2.7 19.5% 24.9% 25.4% 6.8% 10.4% 11.1%
Toho Gas Ltd 9533 JP NOT RATED 5,070 N/A 43,500 24.0 30.0 N/A N/A -1.1% 1.5 1.3 N/a N/A 7.7% 4.6% N/A 4.1% 2.8% N/A
Titas Gas Trans & Distri TITASGAS BD NOT RATED 36.70 N/A 432 8.6 7.6 N/A N/A -21% 1.3 0.6 N/a N/A 15.9% 6.6% N/A 8.9% 3.6% N/A
Petronas Gas Bhd PTG MK HOLD 17.70 18.50 9,217 23.5 18.4 18.0 19.6 -0.9% 3.9 2.8 2.7 2.6 17.3% 15.2% 15.0% 13.2% 10.8% 12.0%
Oil services companies
PV Technical Services PVS VN ADD 20,600 25,000 420 8.7 9.8 8.7 6.6 -25.7% 0.7 0.9 0.8 0.8 14.6% 6.7% 7.0% 5.2% 3.1% 4.5%
Mermaid Maritime MMT SP NOT RATED 0.08 N/A 119 23.0 N/A N/A N/A -36.0% 0.6 0.3 N/A N/A -6.7% -4.2% N/A -4.6% -3.1% N/A
Yinson Holdings YNS MK ADD 4.52 4.84 1,085 16.0 13.7 24.4 36.7 3.5% 3.3 1.9 1.5 1.5 17.5% 9.6% 6.6% 6.8% 4.0% 6.0%
Sembcorp Marine SMM SP ADD 1.68 2.46 2,604 21.6 N/A 103.2 68.7 -70.8% 2.2 1.3 1.5 1.5 6.9% -8.6% 1.5% 2.7% -2.3% 1.2%
Hyundai Engineering 000720 KS ADD 51,600 68,000 4,979 12.1 18.2 13.9 13.2 -21.7% 1.0 0.9 1.0 0.9 7.6% 4.6% 7.6% 2.4% 1.6% 4.1%
Keppel Corp KEP SP ADD 6.21 8.28 8,159 10.2 12.1 11.5 10.1 -39.1% 1.5 0.9 0.9 0.8 12.2% 10.1% 8.3% 4.2% 4.7% 4.3%
Malaysia Marine Eng MMHE MK NOT RATED 0.79 N/A 212 21.9 36.0 N/A N/A -35.9% 1.3 0.4 N/A N/A 2.4% 1.0% N/A 1.2% 0.8% N/A
Offshore drilling companies
PV Drilling PVD VN ADD 17,550 20,000 290 16.2 38.0 20.3 20.1 -66.4% 1.1 0.6 0.5 0.5 14.8% 1.4% 2.6% 6.3% 1.1% 1.3%
Velesto Energy Bhd VEB MK ADD 0.28 0.28 465 26.5 411.0 52.7 51.3 N/A 1.7 0.7 0.7 0.7 -16.2% 0.2% 1.3% -6.1% 1.2% 1.8%
Sapura Energy Bhd SAPE MK ADD 0.34 0.57 511 34.6 N/A N/A N/A N/A 1.1 0.2 0.4 0.4 -0.2% -2.8% -4.8% 0.2% 1.6% 0.9%
Ensco OXHI LN NOT RATED 4.42 N/A 1,846 10.7 N/A N/A N/A N/A 0.5 0.2 N/A N/A -11.6% -7.6% N/A -6.6% -4.5% N/A
Transocean RIGN SW NOT RATED 9.42 N/A 102,200 6.2 N/A N/A N/A N/A 0.4 0.4 N/A N/A -7.7% -15.5% N/A -4.2% -8.3% N/A
Rowan Companies RDC LN NOT RATED 12.11 N/A 1,473 13.5 N/A N/A N/A N/A 0.5 0.3 N/A N/A 0.2% -6.7% N/A 0.0% -4.2% N/A
Average - Gas distribution peers 15,881 17.6 18.6 -19.9% 2.3 2.3 14.8% 12.1% 8.8% 7.5%
Average - Oil services peers 2,511 16.2 18.0 -32.2% 1.5 0.9 7.8% 2.7% 2.6% 1.3%
Average - Offshore drilling peers 17,797 18.0 224.5 -66.4% 0.9 0.4 -3.5% -5.2% -1.7% -2.2%
Company
Bloomberg
Ticker Recom.
Share
Price
(local
curr)
Target
Price
(local
curr)
Market
Cap
(US$ m)
P/E (x) P/BV (x) ROE (%) ROA (%)
Oil and Gas │ Vietnam
Oil & Gas Exp & Prodn │ March 27, 2019
11
RISKS AND POTENTIAL CATALYSTS
Downside risks
The key threat to Vietnam’s oil and gas exploration ramp-up, in our view, is the
ongoing territorial dispute with China in the East Sea. Some of Vietnam’s major
oil and gas projects such as Ca Rong Do and Blue Whale, fall within China’s
“nine-dash line,” which serves as the basis for China’s controversial claims to
most of the resource-rich waterway in the East Sea. Such claims by China have
been rejected by Vietnam as the nine-dash line extends over large portions of
Vietnam’s exclusive economic zone.
While China has never used the nine-dash line as an inviolable border to its
sovereignty, a certain amount of pressure is still imposed on Vietnam’s oil and
gas exploration activities in these areas. In March 2018, the Ca Rong Do project
was suspended indefinitely, supposedly due to pressure from China.
Despite geopolitical tensions in the
East Sea being a concern, we believe
major oil and gas projects in Vietnam
will proceed in time to meet rising dry
gas demand through domestic
sources.
Figure 24: Location of key oil and gas projects in Vietnam
SOURCES: INTERNATIONAL MARITIME ORGANIZATION (IMO)
Despite geopolitical tensions with China being a considerable concern, we
believe major oil and gas projects in Vietnam will proceed in time to meet rising
dry gas demand through domestic sources. While Block B – O Mon project is not
within the disputed area, Sao Vang Dai Nguyet project is located well within the
long-time developed Nam Con Son basin, and Blue Whale project has the
participation of Exxon Mobil (XOM US, Not Rated) – the giant US-based energy
developer that thwarted China’s protests in striking an exploration deal with
Vietnam in 2008. With China clearly on the “back foot” in ongoing trade
negotiations with the US, in our view, we believe it will be more careful in
challenging US companies’ interests in the South China Sea.
Potential upside catalysts
 Global geopolitical disputes cause more supply disruptions such as US
sanctions on Saudi Arabia/Russia/Iran.
 Shale oil production growth is not as high as expected.
 Higher oil demand growth from Asia Pacific and Europe.
Company Note Oil & Gas Exp & Prodn │ Vietnam │ March 27, 2019 Shariah Compliant
IMPORTANT DISCLOSURES, INCLUDING ANY REQUIRED RESEARCH CERTIFICATIONS, ARE PROVIDED AT THE END OF THIS REPORT. IF THIS REPORT IS DISTRIBUTED IN THE
UNITED STATES IT IS DISTRIBUTED BY CIMB SECURITIES (USA), INC. AND IS CONSIDERED THIRD-PARTY AFFILIATED RESEARCH.
Powered by the
EFA Platform
Insert Insert
PetroVietnam Drilling & Well
Services JSC
Patience is a virtue
■ PVD’s rig fleet is young enough to benefit from the oil services market upturn.
■ We expect PVD’s profitability to turn around in FY19-21F.
■ We initiate coverage with an Add rating and target price of VND20,000.
We see PVD’s rig fleet as young enough…
Compared to its global peers, PVD is still a fairly-competitive offshore driller, in our view,
thanks to its relatively-young rig fleet. The average age of PVD’s rig fleet is only eight
years, which is much lower than the global average of 20 years. According to Bassoe
Analytics, c.40% of the global jack-up fleet (as at 2018) is at least 30 years old.
…to benefit from anticipated global oilfield services market upturn
As the need for more oil and gas discoveries becomes increasingly pressing, Rystad
Energy expects global capex for oilfield services to bounce back and post a CAGR of
10.2% in 2018-22F. Drilling contractors, in particular, are regarded as one of the earliest
and primary beneficiaries of such an upturn in global spending for offshore oilfield
services. We forecast jack-up utilisation rate to rise above 90% by 2023F (c.65% in
2018).
We differ in expecting PVD’s profitability to turn around in FY19-21F
We expect PVD to make a major turnaround to net profit growth in FY19-21F. We
forecast PVD to post revenue CAGR of 11.6% and EPS CAGR of 47.6% in FY18-21F.
Our key assumptions are: 1) the jack-up charter rate increases from US$55k/day in FY18
to c.US$70k/day in FY21F. Our charter rate assumption aligns with the new charter rate
of US$68k/day given to PVD I jack-up from 20 January 2019 (source: Bassoe Analytics),
(2) the utilisation rate for PVD’s jack-up fleet is stable over FY19-21F at 90% (the FY18
level), (3) the TAD rig starts working again in 2H20F at a charter rate of US$75k/day.
Initiate coverage with Add and target price of VND20,000
We initiate coverage on PVD with a Add rating and target price of VND20,000, based on
a combination of DCF (weight 50%) and FY19-21F target P/BV multiple of 0.6x (weight
50%). Our DCF valuation is based on terminal growth of 1.2% and weighted average cost
of capital (WACC) of 19.7%. We estimate PVD’s WACC at 17.7% assuming: 1) a risk-
free rate of 5.0%, 2) beta of 1.8 and 3) equity risk premium of 11%.
Risks and potential re-rating catalysts
Potential catalysts are: 1) Ca Rong Do project revives and PVD’s TAD rig receives
higher-than-expected charter rate, and 2) higher-than-expected charter rates for PVD’s
jack-up fleet. Downside risks include: 1) lower-than-expected global crude oil price, 2)
PVD’s TAD rig fails to resume operations post FY19F.
SOURCES: VND RESEARCH, COMPANY REPORTS
Vietnam
ADD (previously NOT RATED)
Consensus ratings*: Buy 3 Hold 3 Sell 0
Current price: VND17,550
Target price: VND20,000
Previous target: N/A
Up/downside: 14.0%
CGS-CIMB / Consensus: 2.8%
Reuters: PVD.HM
Bloomberg: PVD VN
Market cap: US$289.6m
VND6,719,021m
Average daily turnover: US$1.47m
VND34,080m
Current shares o/s: 383.3m
Free float: 34.0%
*Source: Bloomberg
Key changes in this note
Not applicable.
Source: Bloomberg
Price performance 1M 3M 12M
Absolute (%) 2 17 -9.5
Relative (%) 3.5 8.7 7.2
Major shareholders % held
PetroVietnam Group 50.4
Others 49.6
Insert
Analyst(s)
Linh VU Viet
T (84) 38 955 2199
E linh.vuviet@vndirect.com.vn
Mai PHAM
T (84) 94 328 0850
E mai.phamle@vndirect.com.vn
Financial Summary Dec-17A Dec-18A Dec-19F Dec-20F Dec-21F
Revenue (VNDb) 3,891 5,503 5,880 6,843 7,652
Operating EBITDA (VNDb) 393 696 613 718 1,074
Net Profit (VNDb) 45.3 187.9 352.7 355.6 604.6
Core EPS (VND) 118 490 920 928 1,577
Core EPS Growth (65%) 315% 88% 1% 70%
FD Core P/E (x) 148.5 35.8 19.1 18.9 11.1
DPS (VND) 3.64 0.00 0.00 0.00 0.00
Dividend Yield 0.021% 0.000% 0.000% 0.000% 0.000%
EV/EBITDA (x) 18.22 9.87 10.94 9.20 5.40
P/FCFE (x) NA 5.0 NA 282.7 6.3
Net Gearing 5.35% 4.07% 2.55% 1.49% (4.69%)
P/BV (x) 0.51 0.50 0.50 0.50 0.48
ROE 0.34% 1.40% 2.60% 2.63% 4.38%
% Change In Core EPS Estimates
CIMB/consensus EPS (x) 65,740 84,342 105,163
79.0
99.8
120.7
11,000
16,000
21,000
Price Close Relative to VNINDEX (RHS)
5
10
Mar-18 Jun-18 Sep-18 Dec-18
Volm
Oil & Gas Exp & Prodn │ Vietnam
PetroVietnam Drilling & Well Services JSC │ March 27, 2019
13
Patience is a virtue
INVESTMENT THESIS
PVD is still struggling financially amid a slow recovery in
global offshore drilling market
PetroVietnam Drilling and Well Services’ (PVD) main business is to provide
offshore exploration drilling for oilfield operators in Vietnam and Southeast Asia.
The company’s financial performance has deteriorated significantly since the
crude oil price’s collapse in late 2014. To be specific, the average daily charter
rates for PVD’s jack-up fleet have decreased by c.50% since 2015. Meanwhile,
PVD’s TAD rig has even stopped working since the end of 2016 due to the lack
of job opportunities.
Figure 1: PVD’s revenue breakdown by
segment (VND bn)
Figure 2: PVD’s adjusted gross profit
breakdown by segment (VND bn)
SOURCES: VND RESEARCH, COMPANY REPORTS SOURCES: VND RESEARCH, COMPANY REPORTS
Figure 3: PVD’s charter rate and utilisation
rate of jack-up fleet
Figure 4: PVD’s charter rate and utilisation
rate of TAD rig
SOURCES: VND RESEARCH, COMPANY REPORTS SOURCES: VND RESEARCH, COMPANY REPORTS
Recent weakness in PVD’s financial performance mirrors the worldwide struggle
in the offshore drilling market since late 2014. In particular, the charter rate and
utilisation rate for the global jack-up fleet (independent leg cantilever, IC, 250
feet and above) has dropped by c.30% and c.25%, respectively, in 2018 from
their peaks in mid-2015 (source: IHS Markit). From late 2016 to 2018, the
demand for exploration drilling remained low despite recent recovery in the
The average daily charter rates of
PVD’s jack-up fleet have decreased
by c.50% since 2015. Meanwhile,
PVD’s TAD rig has even stopped
working since late 2016 due to the
lack of job opportunities.
Oil & Gas Exp & Prodn │ Vietnam
PetroVietnam Drilling & Well Services JSC │ March 27, 2019
14
crude oil price. Historically, the demand for drilling rigs has followed the crude oil
price curve with a lag of c.1 year.
According to Rystad Energy, compared to other oilfield services such as
engineering procurement construction and installation (EPCI) and subsea, the
contract price of offshore drillers has suffered the most over 2014-17. This
situation is largely due to the inflexible nature of offshore drilling business, which
demands very high maintenance expenses for idle rigs (unutilised rigs). Typically,
offshore drillers would rather accept a low contract price instead of leaving their
rigs in idle mode. In addition, the longer the rig is idle, the higher the reactivation
expense required once it returns to work.
Recent weakness in PVD’s financial
performance has mirrored the
worldwide struggle in the offshore
drilling market since late 2014.
Figure 5: Global charter rate and utilisation of jack-up (IC 250ft and above)
SOURCES: VND RESEARCH, COMPANY REPORTS, BLOOMBERG, IHS MARKIT
According to Rystad Energy,
compared to other oilfield services
such as EPCI and subsea, the
contract price of offshore drillers has
suffered the most over 2014-17.
Figure 6: Offshore price index (2014 = 100 points)
SOURCES: RYSTAD ENERGY, VND RESEARCH
Typically, offshore drillers would rather
accept a low contract price instead of
leaving their rigs in idle mode as
maintenance costs are high for idle
rigs. In addition, the longer the rig is
idle, the higher the reactivation
expense required once it returns to
work.
Figure 7: Expected reactivation costs (US$ m) vs. number of months idling
SOURCES: VND RESEARCH, ABG SUNDAL COLLIER
However, we view PVD’s rig fleet as young enough…
Compared to its global peers, PVD is still a fairly-competitive offshore driller, in
our view, thanks to its relatively-young rig fleet. The average age of PVD’s rig
fleet is only eight years, which is much lower than the global average of 20 years
(according to Bassoe Analytics). Particularly, Bassoe Analytics also noted that
c.40% of global jack-up fleet (as at 2018) is at least 30 years old. There are even
46 rigs (excluding those considered non-competitive) built long ago in the 1970s
and which face huge efficiency problems.
Oil & Gas Exp & Prodn │ Vietnam
PetroVietnam Drilling & Well Services JSC │ March 27, 2019
15
In the medium term, we think that rigs aged over 30 years are likely to be
scrapped and rigs aged over 20 years are likely to be excluded from tenders as
oil companies continue to focus on better technology, higher efficiency and
reducing safety risk.
Figure 8: Average age of PVD’s jack-up fleet (years), as at end 2018
SOURCES: VND RESEARCH, COMPANY REPORTS
Figure 9: Average age of jack-up fleet (years) by major global offshore drilling
company, as at end 2018
SOURCES: VND RESEARCH, RIGZONE
Figure 10: The number of jack-up rigs aged above 28 years by location, as at end 2018
SOURCES: VND RESEARCH, RIGZONE
…to benefit from the anticipated global oilfield services
market upturn
According to Rystad Energy, the global offshore oilfield services market is likely
to have reached its trough in 2018 in terms of profitability. As the need for more
oil and gas discoveries becomes increasingly pressing, Rystad Energy expects
the global capex for oilfield services to bounce back and post a CAGR of 10.2%
in 2018-22F. This growth rate is considered highly positive for the oilfield service
industry since it is even higher than the CAGR witnessed in FY10-14, when
Brent crude oil price escalated from US$77/bbl to US$114/bbl.
As the need for more oil and gas
discoveries becomes increasingly
pressing, Rystad Energy expects that
the global capex for oilfield services
will bounce back and post a CAGR of
10.2% in 2018-22F.
Figure 11: Global capex for offshore oilfield services (US$ bn)
SOURCES: VND RESEARCH, RYSTAD ENERGY ESTIMATES
Oil & Gas Exp & Prodn │ Vietnam
PetroVietnam Drilling & Well Services JSC │ March 27, 2019
16
Drilling contractors, in particular, are regarded as one of the earliest and primary
beneficiaries of such an upturn in global spending for offshore oilfield services.
We expect the jack-up utilisation rate to return to above 90% by 2023F, after
c.70% of obsolete jack-ups are retired by the market. Once the market utilisation
rate surpasses 85%, drilling contractors are likely to start pushing for
considerably higher charter rates, in our view.
We expect the jack-up utilisation rate
to return to above 90% by 2023F, after
c.70% of obsolete jack-ups are retired
by the market.
Figure 12: Global supply and demand of jack-up fleet
SOURCES: VND RESEARCH, BASSOE ANALYTICS
We expect PVD’s profitability to turn around over FY18-21F
We expect PVD to make a major turnaround to net profit growth in FY18-21F,
with EPS CAGR of 47.6%. Our main assumptions are as listed below:
1) We forecast the jack-up charter rate to increase from US$55k/day to
c.US$70k/day in FY18-21F. Our charter rate assumption aligns with the
new charter rate of US$68k/day given to PVD I jack-up by client Thang
Long JOC from 20 January 2019 (source: Bassoe Analytics). Please
refer to Figure 11 for specific charter rate per year.
2) We expect the utilisation rate of the jack-up fleet to remain stable at 90%
over this period, the same as in FY18.
3) We expect the TAD rig to start working again from 2H20F at a charter
rate of US$75k/day. We believe a potential client is Lam Son JOC,
operating in the deep-water Thang Long Dong Do oilfield.
4) We expect PVD to recover c.VND90bn of bad debt from PetroVietnam
Exploration Production Corporation (PVEP, Not listed) in FY19F.
5) We expect well services and trading segments’ revenue and gross profit
in FY18-21F to remain at FY18 levels.
Figure 13: Charter rate and utilisation rate
of PVD’s jack-up fleet, based on our
estimates
Figure 14: Charter rate and utilisation rate
of PVD’s TAD rig, based on our estimates
SOURCES: VND RESEARCH’S ESTIMATES SOURCES: VND RESEARCH’S ESTIMATES
We forecast the jack-up charter rate
to increase from US$55k/day to
c.US$70k/day in FY18-21F.
Meanwhile, we expect the TAD rig
to start working again from 2H20F
at a charter rate of US$75k/day.
Oil & Gas Exp & Prodn │ Vietnam
PetroVietnam Drilling & Well Services JSC │ March 27, 2019
17
Figure 15: PVD’s revenue (VND tr), based
on our estimates
Figure 16: PVD’s adjusted gross profit
(VND tr) , based on our estimates
SOURCES: VND RESEARCH, COMPANY REPORTS SOURCES: VND RESEARCH, COMPANY REPORTS
Overall, we project PVD’s PATMI to
grow at a CAGR of 47.6% in FY18-
21F.
Figure 17: PVD’s net profit (VND bn), based on our estimates
SOURCES: VND RESEARCH, COMPANY REPORTS
SWOT ANALYSIS
Figure 18: SWOT analysis
SOURCES: VND RESEARCH ,
VALUATION AND RECOMMENDATION
Initiate coverage with Add and target price of VND20,000
We initiate coverage on PVD with a Add rating and target price of VND20,000,
based on a combination of DCF (weight 50%) and FY19-21F target P/BV
multiple of 0.6x (weight 50%).
Our DCF valuation of VND18,593 is based on terminal growth of 1.2% and
weighted average cost of capital (WACC) of 19.7%. We estimate PVD’s WACC
at 19.7% assuming: 1) a risk-free rate of 5.4%, 2) beta of 1.8 and 3) equity risk
premium of 11%.
Strengths Weaknesses
1. The sole commercial offshore drilling contractor in
Vietnam with strong support from the government
1. The TAD rig remains in idle and incurs high
maintenance expenses. This rig is only suitable for
deep-water environment, hence making it more
difficult for PVD to get it back to work.
2. Young rig fleet with average age of 8 years,
compared to global average of 20 years.
2. The company has not had much experience in
operating abroad.
3. High barriers to entry, as offshore drilling is a
capital intensive market and highly regulated by the
government
Opportunities Threats
1. We expect the demand for offshore drilling to
recover in the medium term as the need for more oil
and gas discoveries becomes increasingly
pressing.
1. Brent crude oil price falls below US$60/bbl due
to another technology revolution from shale oil. Low
oil price will exert downward pressure on the
contract prices of oilfield services in general.
2. We expect the Brent crude oil price to remain
above US$60/bbl in the medium term, supporting
the recovery in contract prices for oilfield services
companies.
2. The TAD rig fails to return to work after FY19F.
The longer the rig is cold-stacked, the higher the
reactivation cost for PVD
We forecast PVD to pose revenue
CAGR of 11.6% and gross profit
CAGR of 54.2% over FY18-21F,
driven by a strong rebound in the
drilling segment.
Oil & Gas Exp & Prodn │ Vietnam
PetroVietnam Drilling & Well Services JSC │ March 27, 2019
18
Meanwhile, our target FY19-21F P/BV multiple of 0.6x is deduced from the
average TTM P/BV multiple of global peers of 0.4x. We believe PVD deserves to
trade at a higher P/BV multiple than its global peers, thanks to its younger rig
fleet. In addition, we expect the looming rebound in the oilfield service markets
to improve the average P/BV multiples of drilling contractors in the medium term.
Figure 19: DCF model – Summary of free cash flow (FCF)
SOURCES: VND RESEARCH ESTIMATES, COMPANY REPORTS
Figure 20: Cost of equity Figure 21: WACC and terminal growth
SOURCES: VND RESEARCH, COMPANY REPORTS SOURCES: VND RESEARCH, COMPANY REPORTS
Our target price of VND20,000 is
based on a combination of DCF
(weight 50%) and FY19-21F target
P/BV multiple of 0.6x (weight 50%).
Figure 22: Blended target price
SOURCES: VND RESEARCH ESTIMATES, COMPANY REPORTS
Figure 23: Global offshore drilling sector comparison
Note: Not Rated forecasts based on Bloomberg consensus estimates; trailing 12 months (TTM
SOURCES: VND RESEARCH, COMPANY REPORTS, BLOOMBERG (AS AT 26 MAR 2019)
VNDbn
Dec-16A Dec-17A Dec-18E Dec-19F Dec-20F Dec-25F Dec-30F Dec-35F
CAGR
20-35F
Total revenue 5,360 3,891 5,503 5,880 6,843 10,787 14,064 15,513 5.6%
% yoy 0.0% -27.4% 41.4% 6.8% 16.4% 10.0% 3.7% 1.2%
COGS & OPEX (5,199) (4,286) (5,416) (5,599) (6,578) (9,492) (12,376) (13,651)
Unlevered profit / EBIT 161 (396) 87 281 264 1,294 1,688 1,862 13.9%
Operating margin 3.0% -10.2% 1.6% 4.8% 3.9% 12.0% 12.0% 12.0%
Effective tax rate 30.8% 76.4% 27.2% 25.0% 25.0% 25.0% 25.0% 25.0%
EBIT * (1-Tax) or NOPAT 111 (93) 63 211 198 971 1,266 1,396 13.9%
+ Depreciation and amortisation 728 788 608 332 453 793 1,034 1,141
% of revenue 13.6% 20.3% 11.1% 5.6% 6.6% 7.4% 7.4% 7.4%
- Capex (235) (44) (79) (258) (411) (539) (703) (776)
% of revenue -4.4% -1.1% -1.4% -4.4% -6.0% -5.0% -5.0% -5.0%
+ Change in working capital 277 35 5 102 65 272 355 621
% of revenue 5.2% 0.9% 0.1% 1.7% 0.9% 2.5% 2.5% 4.0%
Interest and other financial activities, net 107 547 137 128 148 268 350 386
% of revenue 2.0% 14.1% 2.5% 2.2% 2.2% 2.5% 2.5% 2.5%
Unlevered free cash flow (UFCF) 988,337 1,231,987 735,692 514,947 453,501 1,764,420 2,301,846 2,767,501
% yoy 0.0% 24.7% -40.3% -30.0% -11.9% 24.0% 4.2% 1.2%
Cost of equity
Risk Free Rate 5.4%
Beta 1.80
Risk Premium 11.0%
Cost of Equity 25.2%
VNDbn
Equity Value 9,582
Debt 3,330
Cost of Debt 5.0%
Tax Rate 25.0%
WACC 19.7%
Perpetual Growth Rate 1.2%
Method Implied share price (VND) Weight (%) Weighted share price (VND)
DCF 18,593 50% 9,297
FY19-21F target P/BV of 0.6x 21,478 50% 10,739
Blended price 100% 20,036
Target price 20,000
3-year
EPS
5-yr TTM CY19F CY20F
CAGR
(%) 5-yr TTM CY19F CY20F 5-yr TTM CY19F 5-yr TTM CY19F
Offshore drilling companies
PV Drilling PVD VN ADD 17,550 20,000 290 16.2 38.0 20.3 20.1 -66.4% 1.1 0.6 0.5 0.5 14.8% 1.4% 2.6% 6.3% 1.1% 1.3%
Velesto Energy Bhd VEB MK ADD 0.28 0.28 465 26.5 411.0 52.7 51.3 N/A 1.7 0.7 0.7 0.7 -16.2% 0.2% 1.3% -6.1% 1.2% 1.8%
Sapura Energy Bhd SAPE MK ADD 0.34 0.57 511 34.6 N/A N/A N/A N/A 1.1 0.2 0.4 0.4 -0.2% -2.8% -4.8% 0.2% 1.6% 0.9%
Ensco OXHI LN NOT RATED 4.42 N/A 1,846 10.7 N/A N/A N/A N/A 0.5 0.2 N/A N/A -11.6% -7.6% N/A -6.6% -4.5% N/A
Transocean RIGN SW NOT RATED 9.42 N/A 102,200 6.2 N/A N/A N/A N/A 0.4 0.4 N/A N/A -7.7% -15.5% N/A -4.2% -8.3% N/A
Rowan Companies RDC LN NOT RATED 12.11 N/A 1,473 13.5 N/A N/A N/A N/A 0.5 0.3 N/A N/A 0.2% -6.7% N/A 0.0% -4.2% N/A
Average - Offshore drilling peers 17,797 18.0 224.5 -66.4% 0.9 0.4 -3.5% -5.2% -1.7% -2.2%
P/E (x) P/BV (x) ROE (%) ROA (%)
Company
Bloomberg
Ticker Recom.
Share
Price
(local
curr)
Target
Price
(local
curr)
Market
Cap
(US$ m)
Oil & Gas Exp & Prodn │ Vietnam
PetroVietnam Drilling & Well Services JSC │ March 27, 2019
19
Figure 24: Brief description of global comparable companies
SOURCES: VND RESEARCH, COMPANY REPORTS
RISKS AND CATALYSTS
Downside risks
 Brent crude oil price falls below US$60/bbl due to another technology
revolution from shale oil. Low oil price will exert downward pressure on the
contract prices of oilfield services in general.
 The TAD rig fails to return to work after FY19F. This rig is currently being
cold-stacked and incurs high maintenance expense of c.US$11k/day. We
note that the longer the rig is cold-stacked, the higher the reactivation cost for
PVD.
 Strong correction in global equity market can put downward pressure on the
share price of PVD, which is quite volatile and has a high correlation with the
overall movement of Vietnam’s stock market.
Potential re-rating catalysts
 The charter rates of jack-up fleet are higher than expected thanks to stronger
improvements in rig demand and market utilisation.
 Ca Rong Do project returns from suspension. We believe this project could
provide large and highly-profitable drilling contracts for the currently cold-
stacked TAD rig.
Oil & Gas Exp & Prodn │ Vietnam
PetroVietnam Drilling & Well Services JSC │ March 27, 2019
20
APPENDICES
Figure 25: Company background of PV Drilling
SOURCES: VND RESEARCH, COMPANY REPORTS
Figure 26: Organisation structure of PVD
SOURCES: VND RESEARCH, COMPANY REPORTS
Oil & Gas Exp & Prodn │ Vietnam
PetroVietnam Drilling & Well Services JSC │ March 27, 2019
21
Figure 27: Profile of PV Drilling’s key management executives
SOURCES: VND RESEARCH, COMPANY REPORTS
Oil & Gas Exp & Prodn │ Vietnam
PetroVietnam Drilling & Well Services JSC │ March 27, 2019
22
BY THE NUMBERS
SOURCES: VND RESEARCH, COMPANY REPORTS
0.11%
0.61%
1.11%
1.61%
2.11%
2.61%
3.11%
0.300
0.400
0.500
0.600
0.700
0.800
0.900
Jan-15AJan-16AJan-17AJan-18AJan-19F Jan-20F
P/BV vs ROE
Rolling P/BV (x) (lhs) ROE (rhs)
-110%
-65%
-20%
25%
70%
115%
160%
205%
250%
295%
340%
0
20
40
60
80
100
120
140
160
180
200
Jan-15A Jan-16A Jan-17A Jan-18A Jan-19F Jan-20F
12-mth Fwd FD Core P/E vs FD Core EPS
Growth
12-mth Fwd Rolling FD Core P/E (x) (lhs)
FD Core EPS Growth (rhs)
Profit & Loss
(VNDb) Dec-17A Dec-18A Dec-19F Dec-20F Dec-21F
Total Net Revenues 3,891 5,503 5,880 6,843 7,652
Gross Profit 192 395 610 1,101 1,447
Operating EBITDA 393 696 613 718 1,074
Depreciation And Amortisation -788 -608 -332 -453 -563
Operating EBIT -396 87 281 264 511
Financial Income/(Expense) -81 -67 57 61 83
Pretax Income/(Loss) from Assoc. 5 64 65 76 95
Non-Operating Income/(Expense) 623 140 6 11 12
Profit Before Tax (pre-EI) 151 225 409 412 701
Exceptional Items
Pre-tax Profit 151 225 409 412 701
Taxation -115 -61 -102 -103 -175
Exceptional Income - post-tax
Profit After Tax 36 163 307 309 526
Minority Interests 10 24 46 46 79
Preferred Dividends
FX Gain/(Loss) - post tax
Other Adjustments - post-tax
Net Profit 45 188 353 356 605
Recurring Net Profit 45 188 353 356 605
Fully Diluted Recurring Net Profit 45 188 353 356 605
Cash Flow
(VNDb) Dec-17A Dec-18A Dec-19F Dec-20F Dec-21F
EBITDA 392.6 695.6 612.6 717.5 1,073.7
Cash Flow from Invt. & Assoc. (143.4) (148.9) (148.9) (148.9) (148.9)
Change In Working Capital 34.6 5.1 102.5 64.5 445.0
(Incr)/Decr in Total Provisions 41.0 (110.2) 0.0 0.0 0.0
Other Non-Cash (Income)/Expense (241.6) (471.1) (203.6) (305.2) (372.6)
Other Operating Cashflow 312.6 531.4 494.8 606.3 701.4
Net Interest (Paid)/Received (196.9) (177.1) (237.3) (226.0) (207.8)
Tax Paid (84.2) (142.9) (102.3) (103.1) (175.3)
Cashflow From Operations 114.6 181.9 517.9 605.2 1,315.6
Capex (44.3) (78.7) (258.1) (410.6) (382.6)
Disposals Of FAs/subsidiaries 0.3 0.6 0.0 0.0 0.0
Acq. Of Subsidiaries/investments
Other Investing Cashflow (311.7) 1,203.7 0.0 0.0 0.0
Cash Flow From Investing (355.7) 1,125.7 (258.1) (410.6) (382.6)
Debt Raised/(repaid) (752.0) 41.0 (268.6) (170.9) 138.8
Proceeds From Issue Of Shares
Shares Repurchased
Dividends Paid (1.4) 0.0 0.0 0.0 0.0
Preferred Dividends
Other Financing Cashflow 0.0 (969.5) 0.0 0.0 0.0
Cash Flow From Financing (753.4) (928.5) (268.6) (170.9) 138.8
Total Cash Generated (994.5) 379.1 (8.8) 23.8 1,071.8
Free Cashflow To Equity (993.1) 1,348.6 (8.8) 23.8 1,071.8
Free Cashflow To Firm (44.2) 1,484.7 497.1 420.7 1,140.7
Oil & Gas Exp & Prodn │ Vietnam
PetroVietnam Drilling & Well Services JSC │ March 27, 2019
23
BY THE NUMBERS… cont’d
SOURCES: VND RESEARCH, COMPANY REPORTS
Balance Sheet
(VNDb) Dec-17A Dec-18A Dec-19F Dec-20F Dec-21F
Total Cash And Equivalents 3,952 3,277 3,217 3,193 4,219
Total Debtors 1,552 1,613 1,724 2,006 2,243
Inventories 754 755 759 827 894
Total Other Current Assets 26 26 28 33 37
Total Current Assets 6,284 5,671 5,729 6,060 7,394
Fixed Assets 14,821 14,462 14,389 14,346 14,166
Total Investments 578 695 695 695 695
Intangible Assets 0 0 0 0 0
Total Other Non-Current Assets 134 173 173 173 173
Total Non-current Assets 15,533 15,331 15,257 15,215 15,035
Short-term Debt 1,343 362 337 321 708
Current Portion of Long-Term Debt
Total Creditors 896 992 1,140 1,326 1,483
Other Current Liabilities 1,667 1,423 1,520 1,769 1,978
Total Current Liabilities 3,905 2,777 2,997 3,416 4,169
Total Long-term Debt 3,330 3,477 3,234 3,079 2,831
Hybrid Debt - Debt Component
Total Other Non-Current Liabilities 1,110 907 907 907 907
Total Non-current Liabilities 4,439 4,384 4,141 3,986 3,738
Total Provisions 0 0 0 0 0
Total Liabilities 8,345 7,162 7,138 7,402 7,907
Shareholders' Equity 13,208 13,583 13,545 13,522 14,092
Minority Interests 265 258 304 350 429
Total Equity 13,473 13,841 13,848 13,872 14,521
Key Ratios
Dec-17A Dec-18A Dec-19F Dec-20F Dec-21F
Revenue Growth (27.4%) 41.4% 6.8% 16.4% 11.8%
Operating EBITDA Growth (55.8%) 77.2% (11.9%) 17.1% 49.6%
Operating EBITDA Margin 10.1% 12.6% 10.4% 10.5% 14.0%
Net Cash Per Share (VND) -1,880 -1,469 -923 -540 1,776
BVPS (VND) 34,463 35,440 35,341 35,281 36,769
Gross Interest Cover -2.05 0.51 1.79 1.77 3.73
Effective Tax Rate 76.4% 27.2% 25.0% 25.0% 25.0%
Net Dividend Payout Ratio 3.08% NA NA NA NA
Accounts Receivables Days 144.4 105.0 103.6 99.8 101.3
Inventory Days 76.43 53.91 52.43 50.58 50.63
Accounts Payables Days 69.74 58.57 71.71 76.42 80.34
ROIC (%) (2.03%) 0.47% 1.54% 1.47% 2.86%
ROCE (%) (1.07%) 1.55% 3.28% 3.18% 4.54%
Return On Average Assets 0.45% 1.01% 1.25% 1.23% 2.10%
Key Drivers
Dec-17A Dec-18A Dec-19F Dec-20F Dec-21F
Oil Price (US$/bbl) 54.0 72.0 65.0 68.0 70.0
Volume Growth (%) -4.6% -0.5% -0.8% 0.4% -0.2%
Ratio Of Up To Downstream (x) N/A N/A N/A N/A N/A
Operating Cash Cost (US$/bbl) N/A N/A N/A N/A N/A
Ratio Of High To Low Margin (x) N/A N/A N/A N/A N/A
Company Note Oil & Gas Exp & Prodn │ Vietnam │ March 27, 2019 Shariah Compliant
IMPORTANT DISCLOSURES, INCLUDING ANY REQUIRED RESEARCH CERTIFICATIONS, ARE PROVIDED AT THE END OF THIS REPORT. IF THIS REPORT IS DISTRIBUTED IN THE
UNITED STATES IT IS DISTRIBUTED BY CIMB SECURITIES (USA), INC. AND IS CONSIDERED THIRD-PARTY AFFILIATED RESEARCH.
Powered by the
EFA Platform
Insert Insert
PetroVietnam Gas JSC
Challenging times ahead
■ We expect a flat oil price outlook to weigh on PetroVietnam Gas’s (GAS)
sales growth. We forecast EPS to decrease by 7.8% p.a in FY18-21F.
■ Depleting gas supply to put pressure on input costs, while demand growth
and capacity expansion should partly offset rising costs.
■ Initiate coverage with a Hold rating and target price of VND91,600.
Flat oil price outlook could weigh on sales growth
In 2019-21F, we expect Bloomberg consensus forecasts for Brent crude oil to be US$62-
US$65/bbl, down 10.1% from the estimated level in FY18. In our view, despite the recent
robust recovery, Brent crude oil price is unlikely to return to the pre-2014 level of
c.US$100/bbl. Given the flat crude oil price outlook, coupled with unchanged sales
volume, we expect GAS’s revenue to increase by a CAGR of 5.1% over FY18-21F.
Depleting gas supply puts pressure on input costs
The dry gas segment has been instrumental to GAS’s profitability, contributing 50-55% of
its total annual gross profit in FY15-18. While we believe the selling price of this segment
has little upside due to the flat oil price outlook, the input price for this segment is also
facing upward pressure due to the quick depletion of the cheap domestic gas supply. We
forecast the dry gas segment’s COGS to increase by a CAGR of 9.9% in FY18-21F.
Demand and capacity expansion to partly offset rising costs
According to Wood Mackenzie, the demand for dry gas in Vietnam is poised to increase
twofold over 2020-35F due to the expected construction of several new gas-fired power
plants, such as Nhon Trach 3 – 4 and O Mon 3 – 4. We expect the combination of higher
dry gas demand and larger transportation capacity to increase GAS’s transportation
revenue by c.85% over 2020-25F, and partially offset the potential loss in gross profit for
the dry gas segment.
We forecast EPS to decrease by 7.8% p.a. in FY18-21F
In FY18E, GAS posted EPS growth of 26.4% yoy, mainly due to a strong recovery in
Brent crude oil price (+27.7% yoy). However, for FY18-21F, we forecast GAS’s EPS to
decrease by 7.8% p.a. due to the flat oil price outlook and rising input costs.
Initiate coverage with a Hold and target price of VND91,600
We initiate coverage on GAS with a Hold rating and target price of VND91,600, based on
an equal weighting of DCF and target FY19-21F P/E multiple of 18.0x. Key downside
risks include: 1) faster-than-expected depletion of cheap gas supply and 2) sharp fall in
crude oil price. Meanwhile, key upside catalysts are: 1) higher oil price due to geopolitical
disputes, and 2) gas fields under development, such as Blue Whale and Block B – O
Mon, starting operations sooner than expected.
SOURCES: VND RESEARCH, COMPANY REPORTS
Vietnam
HOLD (previously NOT RATED)
Consensus ratings*: Buy 4 Hold 2 Sell 0
Current price: VND97,200
Target price: VND91,600
Previous target: N/A
Up/downside: -5.81%
CGS-CIMB / Consensus: -7.8%
Reuters: GAS.HM
Bloomberg: GAS VN
Market cap: US$8,019m
VND186,035,936m
Average daily turnover: US$2.02m
VND46,621m
Current shares o/s: 1,914m
Free float: 4.2%
*Source: Bloomberg
Key changes in this note
N/A
Source: Bloomberg
Price performance 1M 3M 12M
Absolute (%) -1.3 12.4 -23.4
Relative (%) 0.2 4.1 -6.7
Major shareholders % held
PetroVietnam Group 95.8
Others 4.2
Insert
Analyst(s)
Linh VU Viet
T (84) 38 955 2199
E linh.vuviet@vndirect.com.vn
Mai PHAM
T (84) 94 328 0850
E mai.phamle@vndirect.com.vn
Financial Summary Dec-17A Dec-18A Dec-19F Dec-20F Dec-21F
Revenue (VNDb) 64,570 75,627 74,677 80,631 87,774
Operating EBITDA (VNDb) 14,219 17,212 15,797 15,877 17,978
Net Profit (VNDb) 9,577 12,102 10,313 9,555 9,500
Core EPS (VND) 5,004 6,323 5,388 4,992 4,963
Core EPS Growth 36.6% 26.4% (14.8%) (7.4%) (0.6%)
FD Core P/E (x) 19.43 15.37 18.04 19.47 19.58
DPS (VND) 3,796 4,110 4,126 4,179 4,155
Dividend Yield 3.90% 4.23% 4.24% 4.30% 4.27%
EV/EBITDA (x) 11.93 9.55 10.63 11.01 10.52
P/FCFE (x) 14.4 182.8 16.4 24.1 20.9
Net Gearing (41.7%) (49.3%) (43.2%) (29.3%) 4.9%
P/BV (x) 4.48 4.07 4.25 4.50 4.71
ROE 23.8% 27.8% 23.1% 22.4% 23.5%
% Change In Core EPS Estimates
CIMB/consensus EPS (x) 0.91 0.78 0.75
78.0
88.0
98.0
108.0
118.0
67,000
87,000
107,000
127,000
147,000
Price Close Relative to VNINDEX (RHS)
1
1
2
2
Mar-18 Jun-18 Sep-18 Dec-18
Volm
Oil & Gas Exp & Prodn │ Vietnam
PetroVietnam Gas JSC │ March 27, 2019
25
Challenging times ahead
INVESTMENT THESIS
Flat oil price outlook could weigh on sales growth
The principal activities of PetroVietnam Gas (GAS) are: 1) to collect and
distribute dry gas, and 2) to produce and distribute liquid petroleum gas (LPG).
The company also participates in producing and distributing other gas products
such as condensate and compressed natural gas (CNG).
Most of GAS’s dry gas sales volume (c.60% of volume to gas-fired power plants
and c.10% of volume to fertiliser producers) have their selling prices directly
linked to the movement of global crude oil prices. The general formula is: 46% x
Singapore fuel oil price + transportation tariff (source: PetroVietnam).
The rest of GAS’s sales volume is regulated by the government with fixed selling
prices, adjusted annually by c.2% for inflation.
Meanwhile, the selling prices of LPG are directly linked with global LPG prices.
GAS often uses Saudi Aramco’s (SARC, Unlisted) LPG prices as its benchmark.
Figure 1: GAS’s revenue structure by segment
SOURCES: VND RESEARCH, COMPANY REPORTS
Figure 2: GAS’s sales volume of dry gas to
end users (mcm)
Figure 3: GAS’s LPG sales volume by
source (k tonnes)
SOURCES: VND RESEARCH, COMPANY REPORTS SOURCES: VND RESEARCH, COMPANY REPORTS
We forecast GAS’s revenue to increase by a CAGR of 5.1% over FY18-21F due
to the flat crude oil price outlook and unchanged sales volume.
For 2019-21F, we observe that Bloomberg consensus forecasts for Brent crude
oil price of US$62-US$65/bbl are down 10.1% from the estimated level in 2018.
The majority of GAS’s dry gas
volume is distributed to gas-fired
power plants. Meanwhile, GAS only
produces c.40% of total LPG
volume in-house from its two gas
processing plants (GPP) Ca Mau
and Dinh Co in 2018. The majority
of its LPG volume is distributed for
residential and industrial usage.
Oil & Gas Exp & Prodn │ Vietnam
PetroVietnam Gas JSC │ March 27, 2019
26
In our view, despite the recent robust recovery, the crude oil price is unlikely to
return to the pre-2014 level of c.US$100/bbl. We believe the revolution of US
shale oil has permanently changed the global supply curve and we see long-
term sustainable crude oil price in the range of US$60-US$70/bbl.
- The selling price for electricity - Take
or Pay (TOP) volume was
c.US$4.1/mmbtu in 2018, with
annual increase of c.2% for inflation
effect.
- The selling price for: 1) electricity –
above TOP, and 2) Phu My fertiliser
(DPM) is based on the formula: 46%
x Singapore fuel oil price +
transportation tariff.
- The selling price for industrial usage
is negotiated annually and generally
aligns with the trend of Singapore
fuel oil price.
- GAS only collects transportation tariff
for the dry gas volume distributed to
Ca Mau fertilizer (DCM).
- The selling price of LPG is directly
linked to global LPG price.
Figure 4: GAS’s selling prices for dry gas and LPG (US$/mmbtu)
SOURCES: VND RESEARCH, COMPANY REPORTS, BLOOMBERG
Figure 5: GAS’s dry gas sales volume by
end user, based on our estimates (mcm)
Figure 6: GAS’s LPG sales volume by
source, based on our estimates (k tonnes)
SOURCES: VND RESEARCH ESTIMATES, COMPANY
REPORTS
SOURCES: VND RESEARCH ESTIMATES, COMPANY
REPORTS
…combined with a flat crude oil price
outlook, we expect GAS’s revenue to
increase by a CAGR of 5.1% during
FY18-21F.
Figure 7: GAS’s revenue based on our estimates (VND tr)
With largely unchanged sales
volume...
Oil & Gas Exp & Prodn │ Vietnam
PetroVietnam Gas JSC │ March 27, 2019
27
SOURCES: VND RESEARCH ESTIMATES, COMPANY REPORTS
Depleting gas supply puts pressure on input costs
The dry gas segment has been instrumental to GAS’s profitability, contributing
50-55% of its total annual gross profit in FY15-18. While we believe the selling
price of this segment has little upside due to the flat oil price outlook (as we
mentioned earlier), the input price of this segment is facing upward pressure due
to a quick depletion of cheap domestic gas supply. We forecast the dry gas
segment’s COGS to increase by a CAGR of 9.9% in FY18-21F.
Figure 8: GAS’s gross profit structure by segment
SOURCES: VND RESEARCH, COMPANY REPORTS
Figure 9: Supply of domestic dry gas (mcm)
SOURCES: VND RESEARCH, VIETNAM PETROLEUM INSTITUTE
Figure 10: Cost of sales and gross profit of dry gas segment (VND tr)
SOURCES: VND RESEARCH ESTIMATES, COMPANY REPORTS
Oil & Gas Exp & Prodn │ Vietnam
PetroVietnam Gas JSC │ March 27, 2019
28
Demand and capacity expansion to partly offset rising costs
According to Wood Mackenzie, the demand for dry gas in Vietnam is poised to
increase twofold over 2020-35F due to the expected construction of several new
gas-fired power plants, such as Nhon Trach 3 – 4 and O Mon 3 – 4. With
Vietnam’s electricity demand expected to increase three-fold to 500bn kWh in
2030F, according to Vietnam Electricity Group, the development of these new
gas-fired power plants is critical to ensure sufficient future supply.
Figure 11: Vietnam’s dry gas demand (2005-35F (bcm)
SOURCES: VND RESEARCH, WOOD MACKENZIE
Figure 12: Plans for gas-fired power plants
under the Power Development Plan VII
Figure 13: Installed capacity of gas-fired
power plants (k MW)
SOURCES: MINISTRY OF INDUSTRY AND TRADE SOURCES: VIETNAM PETROLEUM INSTITUE
We believe the increase in demand will benefit GAS’s transportation business as
it remains the sole wholesale gas distributor in Vietnam. By the end of 2018,
GAS had started construction on several new pipeline systems that will enable it
to transport gas from fields under development, such as Sao Vang Dai Nguyet
and Block B – O Mon. We expect GAS’s piped transportation capacity to more
than double by 2023F.
Meanwhile, from 2025F, as Vietnam will need to import LNG to meet the
expected increase in electricity demand, GAS also plans to construct three new
terminals to import LNG from overseas.
We expect the combination of higher demand for dry gas and larger
transportation capacity to increase GAS’s transportation gross profit by c.85%
over 2020-25F, which should partially offset the potential loss in gross profit in
the dry gas segment.
Power plants Capacity (MW)
Target
start-up year
Nhon Trach 3 750 2022
Nhon Trach 4 750 2022
Son My 2.1 750 2023
Son My 2,2 750 2024
Son My 2.3 750 2025
Son My 1.1 750 2026
Son My 1,2 750 2027
Son My 1,3 750 2028
O Mon 3 750 2020
O Mon 4 750 2021
O Mon 2 750 2026
Kien Giang 1 750 2021
Kien Giang 2 750 2022
Mien Trung 1 750 2023
Dung Quat 1 750 2023
Mien Trung 2 750 2024
Dung Quat 2 750 2024
Quang Tri 1 600 2025
Mien Trung 3 750 2026
Total in plan 14,100
.
Oil & Gas Exp & Prodn │ Vietnam
PetroVietnam Gas JSC │ March 27, 2019
29
GAS has started to build several new
pipeline systems and LNG terminals to
prepare themselves for much higher
dry gas demand in the future.
Figure 14: New pipeline and LNG terminals, according to GAS’s guidance
SOURCES: VND RESEARCH, COMPANY REPORTS
We see GAS’s piped transportation
capacity to increase more than twofold
over 2019-23F.
Figure 15: GAS’s pipeline transportation capacity (bcm/year)
SOURCES: VND RESEARCH, COMPANY REPORTS
We expect the combination of higher
dry gas demand and larger
transportation capacity to increase
GAS’s transportation gross profit by
c.85% over 2020-25F, and partially
offset the potential loss in gross profit
in the dry gas segment.
Figure 16: GAS’s transportation revenue and gross profit, based on our estimates (VND
tr)
SOURCES: VND RESEARCH ESTIMATES, COMPANY REPORTS
We forecast EPS to decrease by 7.8% p.a. in FY18-21F
In FY18E, GAS posted robust EPS growth of 26.4% yoy, mainly due to a strong
recovery in crude oil price (+27.7% yoy). However, over the FY18-21F period,
we forecast GAS’s EPS to decrease by 7.8% p.a. due to the flat oil price outlook
and rising input costs.
Project name Current status
Capex.
(US$m)
Capacity
(mcm/yr)
Year of
operation
Block B pipeline Preparing for construction 1,118 5,600 2023F
Nam Con Son phase 2 Under construction 946 7,000 2021F
Su Tu Trang pipeline Preparing for construction 160 2,000 2020F
Sao Vang Dai Nguyet pipeline Under feasibity study 150 3,000 2021F
Thi Vai LNG terminal Preparing for construction 620 1,370 2022F
Son My LNG terminal Under feasibity study 1,350 4,110 2023F
Oil & Gas Exp & Prodn │ Vietnam
PetroVietnam Gas JSC │ March 27, 2019
30
Figure 17: GAS’s revenue by segment,
based on our estimates (VND tr)
Figure 18: GAS’s gross profit by segment,
based on our estimates (VND tr)
SOURCES: VND RESEARCH ESTIMATES, COMPANY
REPORTS
SOURCES: VND RESEARCH ESTIMATES, COMPANY
REPORTS
In FY18-21F, we forecast GAS’s EPS
to decline by 7.8% p.a. due to the flat
oil price outlook and rising input costs.
Figure 19: GAS’s net profit, based on our estimates (VND tr)
SOURCES: VND RESEARCH ESTIMATES, COMPANY REPORTS
SWOT ANALYSIS
Figure 20: SWOT analysis
SOURCES: VND RESEARCH, BORR DRILLING
Strengths Weaknesses
1. State-owned corporation with absolute monopoly
in Vietnam’s gas infrastructure and wholesale
distribution of dry gas.
1. Pricing policy is highly influenced by the
government.
2. GAS also controls nearly 70% of the domestic
market for liquefied petroleum gas and boasts
extensive distribution network throughout the
country.
2. Low-cost dry gas supply is quickly depleting,
leading to upwards pressure in input cost.
3. GAS is one of the largest publicly traded
Vietnamese companies and also actively pursuing
collaboration with foreign partners.
Opportunities Threats
1. Demand for dry gas in Vietnam is expected to
increase significantly in 2018-2025F period.
1. Delays in the construction of the new pipeline
and LNG terminals could prevent GAS from
expanding its transportation capacity.
2. Potential participation in upstream dry gas
production can lead to more diversified profit
streams in the future.
2. Sharp fall in crude oil price would depress GAS’s
selling prices for dry gas to key end users.
While we expect the dry gas
segment to remain a significant
revenue contributor, we project its
gross profit contribution to decline.
Oil & Gas Exp & Prodn │ Vietnam
PetroVietnam Gas JSC │ March 27, 2019
31
VALUATION AND RECOMMENDATION
Initiate coverage with a Hold and TP of VND91,600
We initiate coverage on GAS with a Hold rating and target price of VND91,600,
based on a combination of DCF (weight 50%) and FY19-21F target P/E multiple
of 18.0x (weight 50%).
Our DCF valuation of VND91,272 is based on terminal growth of 1.2% and
weighted average cost of capital (WACC) of 19.9%. We estimate GAS’s WACC
at 17.7% assuming: 1) a risk-free rate of 5.0%, 2) beta of 1.2 and 3) equity risk
premium of 11%.
Our FY19-21F target P/E multiple of 18.0x is deduced from the regional sector
P/E median of 18.0x. Using a 3-year average forward FY19-21F EPS of
VND5,080, we derive our P/E-based valuation of VND92,063.
Figure 21: DCF model – Summary of free cash flow
SOURCES: VND RESEARCH ESTIMATES, COMPANY REPORTS
Figure 22: WACC and terminal growth Figure 23: Cost of equity
SOURCES: VND RESEARCH, COMPANY REPORTS SOURCES: VND RESEARCH, COMPANY REPORTS
Our target price for GAS is
VND91,600, based on a combination
of DCF (weight 50%) and target FY19-
21F P/E multiple of 18.0x (weight
50%).
Figure 24: Blended target price
SOURCES: VND RESEARCH ESTIMATES, COMPANY REPORTS
VNDbn Dec-16A Dec-17A Dec-18F Dec-19F Dec-20F Dec-25F Dec-30F Dec-35F CAGR 20-35
Total revenue 59,145 64,570 75,627 74,677 80,631 145,986 174,934 194,811 6.1%
% growth y-o-y 0.0% 9.2% 17.1% -1.3% 8.0% 5.0% 3.0% 1.7%
COGS & OPEX (50,667) (53,065) (61,091) (62,597) (69,129) (130,658) (156,566) (174,356)
Unlevered profit / EBIT 8,478 11,505 14,537 12,080 11,503 15,329 18,368 20,455 3.9%
Operating margin 14.3% 17.8% 19.2% 16.2% 14.3% 10.5% 10.5% 10.5%
Effective tax rate -21.8% -21.0% -19.5% -20.9% -20.9% -20.9% -20.9% -20.9%
EBIT * (1-Tax) or NOPAT 10,325 13,925 17,376 14,601 13,903 18,528 22,201 24,724 3.9%
+ D&A 3,309 2,713 2,676 3,716 4,374 8,702 10,561 11,755
% of revenue 5.6% 4.2% 3.5% 5.0% 5.4% 6.0% 6.0% 6.0%
- CapEx (3,230) (2,180) (714) (5,974) (8,063) (2,920) (3,499) (3,896)
% of revenue -5.5% -3.4% -0.9% -8.0% -10.0% -2.0% -2.0% -2.0%
+ ∆ WC (310) (302) (446) (267) (383) (825) (1,015) (1,130)
% of revenue -0.5% -0.5% -0.6% -0.4% -0.5% -0.6% -0.6% -0.6%
Interest and other financial activities, net 692 960 818 1,225 825 1,171 1,311 1,463
% of revenue 1.2% 1.5% 1.1% 1.6% 1.0% 0.8% 0.7% 0.8%
UFCF 10,785,962 15,117,104 19,709,274 13,301,725 10,655,555 24,656,091 29,559,354 32,916,180
% growth y-o-y 0.0% 40.2% 30.4% -32.5% -19.9% 4.8% 3.0% 1.7%
VNDbn
Equity Value 239,244
Debt 9,050
Cost of Debt 4.2%
Tax Rate 20.0%
WACC 17.7%
Perpetual Growth Rate 1.7%
Cost of equity
Risk Free Rate 5.0%
Beta 1.20
Risk Premium 11.0%
Cost of Equity 18.2%
Method Implied share price (VND) Weight (%) Weighted share price (VND)
DCF 91,272 50% 45,636
FY19-21F targetP/E of18x 92,063 50% 46,032
Blended value 91,668
Target price 91,600
Oil & Gas Exp & Prodn │ Vietnam
PetroVietnam Gas JSC │ March 27, 2019
32
GAS’s 5-year average forward P/E
and P/BV are 15.0x and 3.5x,
respectively.
Figure 25: GAS’s historical P/E and P/BV
SOURCES: VND RESEARCH, COMPANY REPORTS, BLOOMBERG
Figure 26: Global gas distribution peer comparison
Note: Not Rated forecasts based on Bloomberg consensus estimates; trailing 12 months (TTM)
SOURCES: VND RESEARCH, BLOOOMBERG (AS AT 26 MAR 2019)
Figure 27: Brief description of global comparable companies
SOURCES: VND RESEARCH, COMPANY REPORTS
RISKS AND CATALYSTS
Downside risks
● Delays to key projects such as Block B – O Mon and Blue Whale could push
GAS to import LNG sooner than expected and in larger amounts than it
3-year
EPS
5-yr TTM CY19F CY20F
CAGR
(%) 5-yr TTM CY19F CY20F 5-yr TTM CY19F 5-yr TTM CY19F
Gas distribution companies
PV GAS GAS VN HOLD 97,200 91,600 8,010 13.8 16.4 19.3 20.9 -10.6% 3.5 4.2 4.0 3.8 28.2% 23.6% 20.6% 18.8% 15.7% 15.4%
PTT PLC PTT TB HOLD 48.50 53.00 45,088 17.1 10.4 10.9 10.3 -29.0% 1.6 1.6 1.4 1.3 11.3% 7.7% 9.0% 6.6% 4.7% 6.4%
Indraprastha Gas IGL IN NOT RATED 301.3 N/A 2,650 17.7 25.4 N/A N/A 28.0% 0.6 0.6 0.6 N/A 3.4% 2.2% N/A 3.5% 4.7% N/A
China Gas Holdings 384 HK ADD 28.15 40.00 2,271 18.6 22.1 17.50 14.10 28.7% 3.6 5.3 3.8 2.7 19.5% 24.9% 25.4% 6.8% 10.4% 11.1%
Toho Gas Ltd 9533 JP NOT RATED 5,070 N/A 43,500 24.0 30.0 N/A N/A -1.1% 1.5 1.3 N/a N/A 7.7% 4.6% N/A 4.1% 2.8% N/A
Titas Gas Trans & Distri TITASGAS BD NOT RATED 36.70 N/A 432 8.6 7.6 N/A N/A -21% 1.3 0.6 N/a N/A 15.9% 6.6% N/A 8.9% 3.6% N/A
Petronas Gas Bhd PTG MK HOLD 17.70 18.50 9,217 23.5 18.4 18.0 19.6 -0.9% 3.9 2.8 2.7 2.6 17.3% 15.2% 15.0% 13.2% 10.8% 12.0%
Average - Gas distribution peers 15,881 17.6 18.6 -19.9% 2.3 2.3 14.8% 12.1% 8.8% 7.5%
Company
Bloomberg
Ticker Recom.
Share
Price
(local
curr)
Target
Price
(local
curr)
Market
Cap
(US$ m)
P/E (x) P/BV (x) ROE (%) ROA (%)
Oil & Gas Exp & Prodn │ Vietnam
PetroVietnam Gas JSC │ March 27, 2019
33
otherwise would have. We believe that the LNG import price would be higher
than domestic dry gas, further increasing GAS’s input costs.
● Cheap gas supply could be depleted faster than expected and further
increase GAS’s input costs.
● Delays in the construction of the new pipeline and LNG terminals could
prevent GAS from expanding its transportation capacity.
● Sharp fall in crude oil price would depress GAS’s selling prices for dry gas to
key end users.
Delays to key projects such as Block
B – O Mon and Blue Whale can push
GAS into having to import LNG sooner
than expected and at larger amounts
than it otherwise would have. Note
that LNG import price will be higher
than that of domestic dry gas, further
increasing GAS’s input costs, in our
view.
Figure 28: Vietnam’s wellhead gas pricing in 2018 (US$/mmbtu)
SOURCES: VND RESEARCH, RYSTAD ENERGY
LNG import prices can also be highly
volatile as they largely track crude oil
price movements. If global crude oil
price returns to pre-2014 levels,
GAS’s input gas cost will come under
severe upwards pressure.
Figure 29: LNG spot prices (US$/mmbtu)
SOURCES: VND RESEARCH, COMPANY REPORTS, BLOOMBERG?
Potential re-rating catalysts
● From 2021F, we believe GAS is likely to participate in upstream natural gas
production with 25% indirect ownership of the Su Tu Trang well - phase 2.
Given that this gas well is still under development and details on pricing have
not yet been disclosed by GAS, we have not factored it into our model and
consider it an upside catalyst only. In our estimation, if GAS manages to yield
a regional average net income of c.US$16/boe from the Su Tu Trang phase 2
project, GAS will have an additional net income of c.VND900bn p.a. until
2035F.
● GAS may be able to pass on the increase in input prices to its end users
(mainly gas-fired power plants and fertiliser producers). However, we believe
this can only happen if Vietnam significantly increases the current electricity
retail price. At the moment, the production cost of gas-fired power plants is
highly uncompetitive compared to other electricity sources and much higher
than the average electricity retail price in Vietnam.
● Geopolitical disputes could create more disruptions to crude oil supply, driving
up oil prices.
● New gas projects such as Blue Whale and Block B – O Mon starting
operations sooner than expected, would reduce the need for GAS to import
dry gas from overseas.
Oil & Gas Exp & Prodn │ Vietnam
PetroVietnam Gas JSC │ March 27, 2019
34
GAS is likely to participate in upstream
natural gas production with 25%
indirect ownership of Su Tu Trang well
- phase 2. As this gas well is still
under development and details on
pricing have not yet been disclosed by
PV Gas, we have not factored it into
our model and regard it as an upside
catalyst only.
Figure 30: Overview of Su Tu Trang Phase 2 project (as at 2018)
SOURCES: VND RESEARCH, COMPANY REPORTS
If GAS manages to yield a regional
average net income of c.US$16/boe
from the Su Tu Trang phase 2 project,
the company would have additional
net income of c.VND900bn/annum
until 2035F, based on our estimates.
Figure 31: Average upstream oil and gas production net income as at 2018 (US$/boe)
SOURCES: VND RESEARCH, JADESTONES
GAS may be able to pass on the
increase in input prices to its end
users (mainly gas-fired power plants).
However, the production cost of gas-
fired power plants is largely
uncompetitive compared to other
electricity sources and also much
higher than the average retail
electricity price in Vietnam.
Figure 32: Levelised cost of electricity by source in 2017 (US$/MWh)
SOURCES: VND RESEARCH, COMPANY REPORTS
We believe this can only happen if
Vietnam significantly increases the
current electricity retail price, which
remains the lowest among Southeast
Asian countries.
Figure 33: Average retail electricity prices by country (US$/MWh)
SOURCES: VND RESEARCH, WOOD MACKENZIE
Oil & Gas Exp & Prodn │ Vietnam
PetroVietnam Gas JSC │ March 27, 2019
35
APPENDIX
Figure 34: Company profile of PV GAS as at end-2018
SOURCES: VND RESEARCH, COMPANY REPORTS
Figure 35: Organisational structure of PV GAS as at end-2018
SOURCES: VND RESEARCH, COMPANY REPORTS
Figure 36: Presence of PV Gas in Vietnam’s natural gas value chain as at end-2018
SOURCES: VND RESEARCH, COMPANY REPORTS
Oil & Gas Exp & Prodn │ Vietnam
PetroVietnam Gas JSC │ March 27, 2019
36
Figure 37: Profile of PV GAS’s key management executives as at end-2018
SOURCES: VND RESEARCH, COMPANY REPORTS
Oil & Gas Exp & Prodn │ Vietnam
PetroVietnam Gas JSC │ March 27, 2019
37
BY THE NUMBERS
SOURCES: VND RESEARCH, COMPANY REPORTS
16.0%
17.8%
19.5%
21.3%
23.0%
24.8%
26.5%
28.3%
30.0%
2.30
2.80
3.30
3.80
4.30
4.80
5.30
5.80
6.30
Jan-15A Jan-16A Jan-17A Jan-18A Jan-19F Jan-20F
P/BV vs ROE
Rolling P/BV (x) (lhs) ROE (rhs)
-20.0%
-11.4%
-2.9%
5.7%
14.3%
22.9%
31.4%
40.0%
8.8
10.8
12.8
14.8
16.8
18.8
20.8
22.8
Jan-15AJan-16AJan-17AJan-18A Jan-19F Jan-20F
12-mth Fwd FD Core P/E vs FD Core EPS
Growth
12-mth Fwd Rolling FD Core P/E (x) (lhs)
FD Core EPS Growth (rhs)
Profit & Loss
(VNDb) Dec-17A Dec-18A Dec-19F Dec-20F Dec-21F
Total Net Revenues 64,570 75,627 74,677 80,631 87,774
Gross Profit 15,036 18,305 15,801 15,520 16,389
Operating EBITDA 14,219 17,212 15,797 15,877 17,978
Depreciation And Amortisation -2,713 -2,676 -3,716 -4,374 -5,962
Operating EBIT 11,505 14,537 12,080 11,503 12,016
Financial Income/(Expense) 844 861 1,077 665 67
Pretax Income/(Loss) from Assoc. -3 -4 -3 -4 -4
Non-Operating Income/(Expense) 119 -40 151 163 177
Profit Before Tax (pre-EI) 12,465 15,355 13,305 12,327 12,256
Exceptional Items
Pre-tax Profit 12,465 15,355 13,305 12,327 12,256
Taxation -2,622 -2,999 -2,777 -2,573 -2,558
Exceptional Income - post-tax
Profit After Tax 9,843 12,355 10,528 9,754 9,698
Minority Interests -266 -253 -216 -200 -199
Preferred Dividends
FX Gain/(Loss) - post tax
Other Adjustments - post-tax
Net Profit 9,577 12,102 10,313 9,555 9,500
Recurring Net Profit 9,577 12,102 10,313 9,555 9,500
Fully Diluted Recurring Net Profit 9,577 12,102 10,313 9,555 9,500
Cash Flow
(VNDb) Dec-17A Dec-18A Dec-19F Dec-20F Dec-21F
EBITDA 14,219 17,212 15,797 15,877 17,978
Cash Flow from Invt. & Assoc. -1,225 -1,620 -1,176 -1,187 -1,256
Change In Working Capital 3,158 -590 796 -34 606
(Incr)/Decr in Total Provisions 99 25 0 0 0
Other Non-Cash (Income)/Expense -1,631 -1,858 -2,491 -3,549 -5,722
Other Operating Cashflow 2,467 2,884 10,102 8,879 14,586
Net Interest (Paid)/Received -302 -446 -267 -383 -635
Tax Paid -2,400 -3,113 -2,777 -2,573 -2,558
Cashflow From Operations 14,386 12,495 19,984 17,030 22,998
Capex -2,180 -714 -5,974 -8,063 -17,555
Disposals Of FAs/subsidiaries 17 0 5 6 7
Acq. Of Subsidiaries/investments
Other Investing Cashflow -882 -6,463 -3,504 -3,580 -3,580
Cash Flow From Investing -3,044 -7,178 -9,473 -11,638 -21,128
Debt Raised/(repaid) 1,555 -4,300 801 2,331 7,048
Proceeds From Issue Of Shares
Shares Repurchased
Dividends Paid -7,265 -7,866 -7,896 -7,999 -7,953
Preferred Dividends
Other Financing Cashflow -20 50 50 50 50
Cash Flow From Financing -5,729 -12,115 -7,045 -5,617 -854
Total Cash Generated 5,613 -6,798 3,466 -225 1,016
Free Cashflow To Equity 12,897 1,018 11,312 7,724 8,918
Free Cashflow To Firm 11,643 5,763 10,778 5,775 2,505
Oil & Gas Exp & Prodn │ Vietnam
PetroVietnam Gas JSC │ March 27, 2019
38
BY THE NUMBERS… cont’d
SOURCES: VND RESEARCH, COMPANY REPORTS
Balance Sheet
(VNDb) Dec-17A Dec-18A Dec-19F Dec-20F Dec-21F
Total Cash And Equivalents 27,079 28,308 25,293 20,532 13,080
Total Debtors 9,175 10,232 9,582 10,346 11,262
Inventories 1,645 1,952 1,848 2,043 2,240
Total Other Current Assets 357 462 462 462 462
Total Current Assets 38,257 40,955 37,184 33,383 27,044
Fixed Assets 15,396 18,540 20,798 24,487 36,080
Total Investments 281 280 280 280 280
Intangible Assets 0 0 0 0 0
Total Other Non-Current Assets 7,955 2,804 2,804 2,804 2,804
Total Non-current Assets 23,632 21,624 23,882 27,571 39,164
Short-term Debt 1,738 1,490 1,734 2,445 3,906
Current Portion of Long-Term Debt
Total Creditors 2,529 2,899 2,696 2,911 3,169
Other Current Liabilities 6,645 6,810 6,810 6,810 6,810
Total Current Liabilities 10,912 11,199 11,240 12,166 13,885
Total Long-term Debt 7,312 3,396 3,952 5,573 11,160
Hybrid Debt - Debt Component
Total Other Non-Current Liabilities 394 519 519 519 519
Total Non-current Liabilities 7,706 3,915 4,472 6,092 11,679
Total Provisions 0 0 0 0 0
Total Liabilities 18,618 15,114 15,712 18,259 25,565
Shareholders' Equity 41,490 45,687 43,792 41,333 39,480
Minority Interests 1,782 1,778 1,562 1,362 1,164
Total Equity 43,272 47,465 45,355 42,696 40,643
Key Ratios
Dec-17A Dec-18A Dec-19F Dec-20F Dec-21F
Revenue Growth 9.2% 17.1% (1.3%) 8.0% 8.9%
Operating EBITDA Growth 20.6% 21.1% (8.2%) 0.5% 13.2%
Operating EBITDA Margin 22.0% 22.8% 21.2% 19.7% 20.5%
Net Cash Per Share (VND) 9,420 12,238 10,244 6,539 -1,038
BVPS (VND) 21,678 23,870 22,881 21,596 20,627
Gross Interest Cover 41.07 33.00 73.00 49.81 28.54
Effective Tax Rate 21.0% 19.5% 20.9% 20.9% 20.9%
Net Dividend Payout Ratio 75.9% 65.0% 76.6% 83.7% 83.7%
Accounts Receivables Days 59.50 46.83 48.42 45.23 44.93
Inventory Days 10.82 11.45 11.78 10.94 10.95
Accounts Payables Days 17.57 15.87 15.88 14.39 14.19
ROIC (%) 31.7% 45.9% 39.8% 35.4% 31.6%
ROCE (%) 25.4% 30.6% 26.0% 24.7% 23.9%
Return On Average Assets 15.5% 18.7% 15.6% 15.1% 15.2%
Key Drivers
Dec-17A Dec-18A Dec-19F Dec-20F Dec-21F
Oil Price (US$/bbl) 54.0 72.0 65.0 68.0 70.0
Volume Growth (%) -4.6% -0.5% -0.8% 0.4% -0.2%
Ratio Of Up To Downstream (x) N/A N/A N/A N/A N/A
Operating Cash Cost (US$/bbl) N/A N/A N/A N/A N/A
Ratio Of High To Low Margin (x) N/A N/A N/A N/A N/A
Company Note Oil & Gas Exp & Prodn │ Vietnam │ March 27, 2019 Shariah Compliant
IMPORTANT DISCLOSURES, INCLUDING ANY REQUIRED RESEARCH CERTIFICATIONS, ARE PROVIDED AT THE END OF THIS REPORT. IF THIS REPORT IS DISTRIBUTED IN THE
UNITED STATES IT IS DISTRIBUTED BY CIMB SECURITIES (USA), INC. AND IS CONSIDERED THIRD-PARTY AFFILIATED RESEARCH.
Powered by the
EFA Platform
Insert Insert
PetroVietnam Technical Services
Let the good times roll
■ We believe PetroVietnam Technical Services (PVS) could be a key
beneficiary of Vietnam’s push for renewed dry gas reserves.
■ We expect it to deliver strong earnings growth (net profit CAGR of 25.4%) in
FY18-21F.
■ Initiate coverage with Add and target price of VND25,000.
A diversified oilfield services company with strong financial health
PVS provides a variety of technical services to the oil and gas industry, ranging from
exploration support, field construction and oil production to supply bases. Despite facing
difficulties from weak market conditions since the collapse of crude oil prices in 2014,
PVS has successfully maintained strong financial health (FY18 net margin of 7.0% and
FY18 ROE of 9.3%), underpinned by high liquidity ratios (current ratio of 2.0x), low
leverage (debt/equity ratio of 0.1x) and a high cash balance (cash per share of VND16.80
at the end-FY18E).
Key beneficiary of Vietnam’s push for renewed dry gas reserves
PVS is the sole domestic contractor that provides engineering, procurement and
construction (EPC) services to offshore oil and gas projects in Vietnam. Currently, PVS is
the main EPC contractor for the Sao Vang Dai Nguyet project (total contract value of
c.US$850m). Other big projects in its pipeline are Su Tu Trang Phase 2, Nam Du – U
Minh, Blue Whale, and Block B – O Mon. The total order backlog for these projects, while
not yet disclosed in detail, could amount to US$2,000m, based on our estimates.
Strong earnings growth expected in FY18-21F
With several big projects on the horizon, we forecast PVS to post a sales CAGR of 19.6%
and net profit CAGR of 25.4% in FY18-21F. Based on the scope of work for these
projects, PVS’s mechanical & engineering (M&C) and floating production storage &
offloading (FPSO/FSO) segments are likely to benefit the most once these projects get
off the ground.
Initiate coverage with Add and target price of VND25,000
Initiate on PVS with an Add and TP of VND25,000, based on a combination of DCF
(weight 50%) and target FY19-21F P/E of 7.8x (weight 50%), based on historical 5-year
mean P/E.
Potential re-rating catalysts and risks
If the geopolitical issues facing Ca Rong Do are resolved and the project starts up again,
we estimate it could add: 1) c.VND500bn (engineering works) to PVS’s net profit in FY18-
21F, and 2) c.VND300bn p.a. (FPSO vessel for field operators) to net profit post FY21F.
Downside risks are geopolitical issues hampering progress of key oil and gas projects.
SOURCES: VND RESEARCH, COMPANY REPORTS
Vietnam
ADD (previously NOT RATED)
Consensus ratings*: Buy 6 Hold 1 Sell 0
Current price: VND20,600
Target price: VND25,000
Previous target: N/A
Up/downside: 21.4%
CGS-CIMB / Consensus: 6.0%
Reuters: PVS.HM
Bloomberg: PVS VN
Market cap: US$424.4m
VND9,846,106m
Average daily turnover: US$2.54m
VND58,459m
Current shares o/s: 478.0m
Free float: 34.0%
*Source: Bloomberg
Key changes in this note
N/A
Source: Bloomberg
Price performance 1M 3M 12M
Absolute (%) -1 16.4 2
Relative (%) 0.5 8.1 18.7
Major shareholders % held
PetroVietnam Group 51.4
VinaCapital 5.5
Dragon Capital 4.0
Insert
Analyst(s)
Linh VU Viet
T (84) 38 955 2199
E linh.vuviet@vndirect.com.vn
Mai PHAM
T (84) 94 328 0850
E mai.phamle@vndirect.com.vn
Financial Summary Dec-17A Dec-18A Dec-19F Dec-20F Dec-21F
Revenue (VNDb) 16,729 14,667 13,627 21,180 26,362
Operating EBITDA (VNDb) 710 871 1,311 1,662 1,961
Net Profit (VNDb) 801 1,023 1,194 1,572 2,015
Core EPS (VND) 1,793 2,213 2,499 3,288 4,216
Core EPS Growth (18.9%) 23.4% 12.9% 31.6% 28.2%
FD Core P/E (x) 11.49 9.31 8.24 6.26 4.89
DPS (VND) 594 1,064 1,243 1,118 1,265
Dividend Yield 2.88% 5.17% 6.03% 5.43% 6.14%
EV/EBITDA (x) -0.74 -1.40 -2.09 -2.15 -2.51
P/FCFE (x) NA 8.40 4.12 7.33 5.10
Net Gearing (50.7%) (58.6%) (66.5%) (70.6%) (74.4%)
P/BV (x) 0.86 0.87 0.78 0.75 0.70
ROE 7.6% 9.3% 10.0% 12.2% 14.8%
% Change In Core EPS Estimates
CIMB/consensus EPS (x) 1.38 1.52 1.49
84.0
102.8
121.5
13,000
18,000
23,000
Price Close Relative to VNINDEX (RHS)
5
10
15
20
Mar-18 Jun-18 Sep-18 Dec-18
Volm
Oil & Gas Exp & Prodn │ Vietnam
PetroVietnam Technical Services │ March 27, 2019
40
Let the good times roll
INVESTMENT THESIS
A diversified oilfield services company with strong financial
health and significant net cash position
PVS provides a variety of technical services to the oil and gas industry, ranging
from exploration support, field construction and oil production to supply bases.
The two business segments that contribute the most to PVS’s revenue and
gross profit are mechanical and engineering (M&C, 47.4% and 42.1% of
FY18E’s revenue and gross profit, respectively) and floating production storage
and offloading (FPSO/FSO, 11.0% and 47.3% of FY18E revenue and gross
profit, respectively).
PVS’s business segments are
described below:
1. Mechanical & engineering (M&C):
Provides offshore construction
services to oil and gas projects in
Vietnam
2. Floating, production, storage and
offloading (FPSO/FSO): Provides full-
service leasing of FPSO/FSO vessels
to oil and gas operators.
3. Port base: Provides management,
administration, and port operation
services to oil and gas operators.
4. Seismic survey (ROV): Provides 2D
and 3D seismic survey and data-
processing services to oil and gas
explorers.
Other segments: Includes the
provision of offshore support vessels,
operation and maintenance services,
hospitality, and security services.
Figure 1: PVS’s presence in Vietnam’s oil and gas value chain
SOURCES: VND RESEARCH, COMPANY REPORTS
Figure 2: PVS’s revenue breakdown by
segment (VND tr)
Figure 3: PVS’s adjusted gross profit by
segment (VND tr)
SOURCES: VND RESEARCH, COMPANY REPORTS SOURCES: VND RESEARCH, COMPANY REPORTS
The collapse of crude oil prices in late-2014 led to significant spending cuts by
major oil and gas operators, hence reducing PVS’s net profit in recent years.
Even though global crude oil prices recovered somewhat in 2017 and 2018, the
financial performance of PVS has not improved in tandem. Generally, it takes 1-
2 years before oilfield services companies like PVS start benefiting from upward
Oil & Gas Exp & Prodn │ Vietnam
PetroVietnam Technical Services │ March 27, 2019
41
movements of crude oil prices due to the long lead times associated with a
resumption of exploration activity.
Despite the difficulties from weak market conditions, PVS has successfully
maintained strong financial health (FY18 net margin of 7.0% and FY18 ROE of
9.3%), underpinned by high liquidity ratios (current ratio of 2.0x), low leverage
(debt/equity ratio of 0.1x) and a high cash balance (cash per share of VND16.80
at the end-FY18E).
The collapse of the crude oil price in
late 2014 led to significant spending
cuts by major oil and gas operators,
which reduced PVS’s EPS in recent
years.
Figure 4: PVS’s profitability vs. crude oil price movements
SOURCES: VND RESEARCH, COMPANY REPORTS
Despite difficulties from weak market
conditions, PVS has managed to
maintain strong financial health.
Figure 5: PVS’s key liquidity and leverage ratios
SOURCES: VND RESEARCH, COMPANY REPORTS
PVS’s cash and cash equivalent
accounted for c.35% of the company’s
total assets at end-FY18.
Figure 6: PVS’s cash per share vs. PVS’s share price (VND)
SOURCES: VND RESEARCH, COMPANY REPORTS
Key beneficiary of Vietnam’s push for renewed domestic dry
gas reserves
PVS is the sole domestic contractor providing engineering, procurement and
construction (EPC) services to offshore oil and gas projects in Vietnam. Given its
dominant market position, we expect PVS to participate in almost all of
Vietnam’s major oil and gas projects in the coming years.
Oil & Gas Exp & Prodn │ Vietnam
PetroVietnam Technical Services │ March 27, 2019
42
Currently, PVS is the main EPC contractor for the ongoing Sao Vang Dai Nguyet
project (total contract value of c.US$850m). Other big projects in its pipeline are
Su Tu Trang Phase 2, Nam Du – U Minh, Blue Whale, and Block B – O Mon.
The total order backlog for these projects, while not yet disclosed in detail, could
amount to US$2,000m, based on our estimates. Ca Rong Do is another big
upcoming project, but is currently suspended (possibly for another two years)
due to a force majeure event in Mar 2018.
All of these projects are key to
ensuring Vietnam’s national energy
security over the next few decades.
We believe these projects are well
timed to meet the imminent rise in dry
gas demand domestically. (Please
refer to our sector report for more
information.)
Figure 7: PVS’s key projects in FY19-22F
SOURCES: VND RESEARCH, COMPANY REPORTS
PVS is the main EPC contractor for
the Sao Vang Dai Nguyet project. The
company is responsible for
constructing a central processing
platform, which will include production
well slots and support dry trees. In
addition, PVS’s joint venture
Malaysian-Vietnam Offshore Terminal
will also supply an FSO vessel to the
project, starting from 2H20F.
Figure 8: Overview of Sao Vang Dai Nguyet project
SOURCES: VND RESEARCH, COMPANY REPORTS
Oil & Gas Exp & Prodn │ Vietnam
PetroVietnam Technical Services │ March 27, 2019
43
Su Tung Trang phase 2 is a high-
potential project for PVS in FY18-21F.
For this project, we expect PVS to
construct additional central processing
platforms for the field.
Figure 9: Overview of Su Tu Trang Phase 2 project
SOURCES: VND RESEARCH, COMPANY REPORTS
Nam Du – U Minh is a potential project
for PVS in FY20-22F. The project will
require the construction of two
wellhead platforms and one FPSO
vessel to serve production activities.
Figure 10: Overview of Nam Du – U Minh project
SOURCES: VND RESEARCH, COMPANY REPORTS
Block B – O Mon is one of the largest
gas projects in Vietnam to date, with
total investment of roughly US$10bn.
We expect PVS to be the sub-
contractor responsible for constructing
some operation platforms for the
project.
However, the development timeline for
Block B – O Mon is uncertain due to
current financing difficulties. We
expect this project to only commence
in 3QFY23F, at the earliest.
Figure 11: Overview of Block B – O Mon project
SOURCES: VND RESEARCH, COMPANY REPORTS
Oil & Gas Exp & Prodn │ Vietnam
PetroVietnam Technical Services │ March 27, 2019
44
Ca Voi Xanh is the largest gas field
discovered in Vietnam to date. The
project is expected to supply an
especially important source of natural
gas for electricity generation and the
petrochemical industry. However, as
the project has not reached final
investment decision (FID), we have
not integrated this project into our PVS
financial forecasts for FY18-21F.
Figure 12: Overview of Ca Voi Xanh project
SOURCES: VND RESEARCH, COMPANY REPORTS
The Ca Rong Do project is considered
key in slowing the decline of Vietnam’s
oil and gas production in FY18-20F.
However, due to unexpected
geopolitical issues, the project was
suspended in Mar 2018. PVS is the
main EPC contractor for the project,
responsible for constructing a tension
leg wellhead platform and supplying
an FPSO vessel for oil production. As
the project is unlikely to resume before
2021F, we eliminate this project from
our PVS financial forecasts for the
FY18-21F period.
Figure 13: Overview of Ca Rong Do project
SOURCES: VND RESEARCH, COMPANY REPORTS
Strong earnings growth expected in FY18-21F
With several big projects on the horizon, we forecast PVS to post a sales CAGR
of 19.6% and net profit CAGR of 25.4% in FY18-21F. Based on the scope of
work for these projects, PVS’s M&C and FPSO/FSO segments are expected to
benefit the most once these projects get off the ground.
In addition, we anticipate PVS’s profitability in FY18-21F to improve, thanks to
the discontinuation of the loss-making remote-operated vehicle (ROV) seismic
survey segment from FY19F. We note that this segment alone incurred gross
losses of c.VND400bn in FY18, equivalent to 21.1% of PVS’s adjusted gross
profit in FY18.
Oil & Gas Exp & Prodn │ Vietnam
PetroVietnam Technical Services │ March 27, 2019
45
Figure 14: Our forecasts for PVS’s
revenue, by segment (VND tr)
Figure 15: Our forecasts for PVS’s adjusted
gross profit, by segment (VND tr)
SOURCES: VND ESTIMATES, COMPANY REPORTS SOURCES: VND ESTIMATES, COMPANY REPORTS
We forecast PVS to post a net profit
CAGR of 25.4% in FY18-21F
Figure 16: Our forecasts for PVS’s net profit (VND tr)
SOURCES: VND RESEARCH, COMPANY REPORTS
VALUATION AND RECOMMENDATION
Initiate coverage with Add and target price of VND25,000
We initiate coverage on PVS with an Add rating and target price of VND25,000,
based on a combination of DCF (weight 50%) and target FY19-21F P/E multiple
of 7.8x (weight 50%).
Our DCF valuation for PVS is VND24,295, based on terminal growth of 1.0%
and weighted average cost of capital (WACC) of 22.5%. We estimate PVS’s
WACC at 21.7% assuming: 1) a risk-free rate of 5.0%, 2) beta of 1.75, and 3)
equity risk premium of 11%.
Figure 17: DCF model – Summary of free cash flow (FCF)
SOURCES: VND RESEARCH ESTIMATES, COMPANY REPORTS
VNDbn
Dec-16A Dec-17A Dec-18E Dec-19F Dec-20F Dec-25F Dec-30F Dec-35F
CAGR
20-35F
Total revenue 18,720 16,729 14,667 13,627 21,180 33,247 36,758 39,013 4.2%
% yoy 0.0% -10.6% -12.3% -7.1% 55.4% 2.8% 1.6% 1.0%
COGS & OPEX (18,620) (16,704) (14,363) (12,886) (20,044) (31,437) (34,757) (36,890)
Unlevered profit / EBIT 100 24 304 741 1,136 1,810 2,001 2,124 4.3%
Operating margin 0.5% 0.1% 2.1% 5.4% 5.4% 5.4% 5.4% 5.4%
Effective tax rate -30.7% -22.0% -42.7% -22.0% -22.0% -22.0% -22.0% -22.0%
EBIT * (1-Tax) or NOPAT 69 19 174 578 886 1,411 1,561 1,656 4.3%
+ Depreciation and amortisation 871 685 567 567 520 678 752 799
% of revenue 4.7% 4.1% 3.9% 4.2% 2.5% 2.0% 2.0% 2.0%
- Capex (448) (436) (355) (329) (512) (804) (889) (943)
% of revenue -2.4% -2.6% -2.4% -2.4% -2.4% -2.4% -2.4% -2.4%
+ Change in working capital (767) 677 (204) (28) (1,257) (1,162) (1,300) (1,384)
% of revenue -4.1% 4.0% -1.4% -0.2% -5.9% -3.5% -3.5% -3.5%
Interest and other financial activities, net 1,140 978 655 763 830 1,354 1,496 1,587
% of revenue 6.1% 5.8% 4.5% 5.6% 3.9% 4.1% 4.1% 4.1%
Unlevered free cash flow (UFCF) 865,052 1,923,111 837,543 1,551,331 467,309 1,478,070 1,619,860 1,715,855
% yoy 0.0% 122.3% -56.4% 85.2% -69.9% 0.6% 2.1% 1.0%
With several big projects on the
horizon, we forecast PVS to post a
sales CAGR of 19.6% and adjusted
gross profit CAGR of 18.2% in
FY18-21F.
We note that the adjusted gross
profit of the FPSO/FSO segment in
FY18E was abnormally high,
thanks to the non-recurring profit
recorded from the asset re-
valuation of FSO Orkid and FPSO
Ruby.
Vietnam Oil and Gas Sector Primed for Exploration Growth

More Related Content

What's hot

EY Price Point: Global oil and gas market outlook
EY Price Point: Global oil and gas market outlookEY Price Point: Global oil and gas market outlook
EY Price Point: Global oil and gas market outlookEY
 
EY Price Point: global oil and gas market outlook, Q319
EY Price Point: global oil and gas market outlook, Q319EY Price Point: global oil and gas market outlook, Q319
EY Price Point: global oil and gas market outlook, Q319EY
 
New base energy news issue 911 dated 21 august 2016
New base energy news issue  911 dated 21 august 2016New base energy news issue  911 dated 21 august 2016
New base energy news issue 911 dated 21 august 2016Khaled Al Awadi
 
EY Price Point: global oil and gas market outlook
EY Price Point: global oil and gas market outlookEY Price Point: global oil and gas market outlook
EY Price Point: global oil and gas market outlookEY
 
Mercer Capital's Value Focus: Energy Industry | Q1 2019 | Region Focus: Eagle...
Mercer Capital's Value Focus: Energy Industry | Q1 2019 | Region Focus: Eagle...Mercer Capital's Value Focus: Energy Industry | Q1 2019 | Region Focus: Eagle...
Mercer Capital's Value Focus: Energy Industry | Q1 2019 | Region Focus: Eagle...Mercer Capital
 
New base 10 august 2019 energy news issue 1267 by khaled al awadi
New base 10 august 2019 energy news issue   1267  by khaled al awadiNew base 10 august 2019 energy news issue   1267  by khaled al awadi
New base 10 august 2019 energy news issue 1267 by khaled al awadiKhaled Al Awadi
 
New base special 14 september 2014
New base special  14 september   2014New base special  14 september   2014
New base special 14 september 2014Khaled Al Awadi
 
EY Price Point: global oil and gas market outlook, Q2 | April 2022
EY Price Point: global oil and gas market outlook, Q2 | April 2022EY Price Point: global oil and gas market outlook, Q2 | April 2022
EY Price Point: global oil and gas market outlook, Q2 | April 2022EY
 
Ne base 08 feruary 2018 energy news issue 1138 by khaled al awadi
Ne base 08 feruary 2018 energy news issue   1138  by khaled al awadiNe base 08 feruary 2018 energy news issue   1138  by khaled al awadi
Ne base 08 feruary 2018 energy news issue 1138 by khaled al awadiKhaled Al Awadi
 
The North American Crude Boom: Impacts on U.S. & PADD IV Refiners
The North American Crude Boom: Impacts on U.S. & PADD IV RefinersThe North American Crude Boom: Impacts on U.S. & PADD IV Refiners
The North American Crude Boom: Impacts on U.S. & PADD IV RefinersTmc2920
 
New base 759 special 31 december 2015
New base 759 special  31 december 2015New base 759 special  31 december 2015
New base 759 special 31 december 2015Khaled Al Awadi
 
EY Price Point: global oil and gas market outlook
EY Price Point: global oil and gas market outlookEY Price Point: global oil and gas market outlook
EY Price Point: global oil and gas market outlookEY
 
New base special 16 january 2014
New base special  16 january 2014New base special  16 january 2014
New base special 16 january 2014Khaled Al Awadi
 
New base special 16 january 2014 khaled al awadi
New base special  16 january 2014 khaled al awadiNew base special  16 january 2014 khaled al awadi
New base special 16 january 2014 khaled al awadiKhaled Al Awadi
 
Special Report - Is the OPEC Agreement a Game Changer?
Special Report  - Is the OPEC Agreement a Game Changer?Special Report  - Is the OPEC Agreement a Game Changer?
Special Report - Is the OPEC Agreement a Game Changer?Amir Khan
 
New base energy news issue 875 dated 19 june 2016
New base energy news issue  875 dated 19 june 2016New base energy news issue  875 dated 19 june 2016
New base energy news issue 875 dated 19 june 2016Khaled Al Awadi
 

What's hot (20)

EY Price Point: Global oil and gas market outlook
EY Price Point: Global oil and gas market outlookEY Price Point: Global oil and gas market outlook
EY Price Point: Global oil and gas market outlook
 
EY Price Point: global oil and gas market outlook, Q319
EY Price Point: global oil and gas market outlook, Q319EY Price Point: global oil and gas market outlook, Q319
EY Price Point: global oil and gas market outlook, Q319
 
New base energy news issue 911 dated 21 august 2016
New base energy news issue  911 dated 21 august 2016New base energy news issue  911 dated 21 august 2016
New base energy news issue 911 dated 21 august 2016
 
EY Price Point: global oil and gas market outlook
EY Price Point: global oil and gas market outlookEY Price Point: global oil and gas market outlook
EY Price Point: global oil and gas market outlook
 
Mercer Capital's Value Focus: Energy Industry | Q1 2019 | Region Focus: Eagle...
Mercer Capital's Value Focus: Energy Industry | Q1 2019 | Region Focus: Eagle...Mercer Capital's Value Focus: Energy Industry | Q1 2019 | Region Focus: Eagle...
Mercer Capital's Value Focus: Energy Industry | Q1 2019 | Region Focus: Eagle...
 
EY Price Point
EY Price PointEY Price Point
EY Price Point
 
New base 10 august 2019 energy news issue 1267 by khaled al awadi
New base 10 august 2019 energy news issue   1267  by khaled al awadiNew base 10 august 2019 energy news issue   1267  by khaled al awadi
New base 10 august 2019 energy news issue 1267 by khaled al awadi
 
New base special 14 september 2014
New base special  14 september   2014New base special  14 september   2014
New base special 14 september 2014
 
EY Price Point: global oil and gas market outlook, Q2 | April 2022
EY Price Point: global oil and gas market outlook, Q2 | April 2022EY Price Point: global oil and gas market outlook, Q2 | April 2022
EY Price Point: global oil and gas market outlook, Q2 | April 2022
 
Ne base 08 feruary 2018 energy news issue 1138 by khaled al awadi
Ne base 08 feruary 2018 energy news issue   1138  by khaled al awadiNe base 08 feruary 2018 energy news issue   1138  by khaled al awadi
Ne base 08 feruary 2018 energy news issue 1138 by khaled al awadi
 
The North American Crude Boom: Impacts on U.S. & PADD IV Refiners
The North American Crude Boom: Impacts on U.S. & PADD IV RefinersThe North American Crude Boom: Impacts on U.S. & PADD IV Refiners
The North American Crude Boom: Impacts on U.S. & PADD IV Refiners
 
New base 759 special 31 december 2015
New base 759 special  31 december 2015New base 759 special  31 december 2015
New base 759 special 31 december 2015
 
EY Price Point: global oil and gas market outlook
EY Price Point: global oil and gas market outlookEY Price Point: global oil and gas market outlook
EY Price Point: global oil and gas market outlook
 
New base special 16 january 2014
New base special  16 january 2014New base special  16 january 2014
New base special 16 january 2014
 
New base special 16 january 2014 khaled al awadi
New base special  16 january 2014 khaled al awadiNew base special  16 january 2014 khaled al awadi
New base special 16 january 2014 khaled al awadi
 
Special Report - Is the OPEC Agreement a Game Changer?
Special Report  - Is the OPEC Agreement a Game Changer?Special Report  - Is the OPEC Agreement a Game Changer?
Special Report - Is the OPEC Agreement a Game Changer?
 
Crude oil an integrated analysis special report by www.capitalheight.com
Crude oil  an integrated analysis special report by www.capitalheight.comCrude oil  an integrated analysis special report by www.capitalheight.com
Crude oil an integrated analysis special report by www.capitalheight.com
 
New base energy news issue 875 dated 19 june 2016
New base energy news issue  875 dated 19 june 2016New base energy news issue  875 dated 19 june 2016
New base energy news issue 875 dated 19 june 2016
 
Energy 120424
Energy 120424Energy 120424
Energy 120424
 
Krause Fund
Krause FundKrause Fund
Krause Fund
 

Similar to Vietnam Oil and Gas Sector Primed for Exploration Growth

Impact of covid 19 in oil industry part 2
Impact of covid 19 in oil industry part 2Impact of covid 19 in oil industry part 2
Impact of covid 19 in oil industry part 2DVSResearchFoundatio
 
EY Price Point: global oil and gas market outlook
EY Price Point: global oil and gas market outlookEY Price Point: global oil and gas market outlook
EY Price Point: global oil and gas market outlookEY
 
Global Oil Outlook August 2016
Global Oil Outlook August 2016Global Oil Outlook August 2016
Global Oil Outlook August 2016Eric Corbett
 
New base special 15 september 2014
New base special  15 september   2014New base special  15 september   2014
New base special 15 september 2014Khaled Al Awadi
 
EY Q1 2020 price point
EY Q1 2020 price pointEY Q1 2020 price point
EY Q1 2020 price pointEY
 
Upstream Ahead - Oil & Gas Industry in India | 2021
Upstream Ahead - Oil & Gas Industry in India | 2021Upstream Ahead - Oil & Gas Industry in India | 2021
Upstream Ahead - Oil & Gas Industry in India | 2021Social Friendly
 
BMI-UKTI Webinar Presentation On Asia O&G Opportunities
BMI-UKTI Webinar Presentation On Asia O&G OpportunitiesBMI-UKTI Webinar Presentation On Asia O&G Opportunities
BMI-UKTI Webinar Presentation On Asia O&G OpportunitiesUmang Parikh
 
Vanda Insights Petrochem 2019
Vanda Insights Petrochem 2019Vanda Insights Petrochem 2019
Vanda Insights Petrochem 2019VandanaHari1
 
Mercer Capital's Value Focus: Refining | 2Q16
Mercer Capital's Value Focus: Refining | 2Q16 Mercer Capital's Value Focus: Refining | 2Q16
Mercer Capital's Value Focus: Refining | 2Q16 Mercer Capital
 
Oil Insights November 2015
Oil Insights November 2015Oil Insights November 2015
Oil Insights November 2015Oussama Laroussi
 
Mercer Capital's Value Focus: Energy Industry | Q3 2021 | Segment: Bakken
Mercer Capital's Value Focus: Energy Industry | Q3 2021 | Segment:  BakkenMercer Capital's Value Focus: Energy Industry | Q3 2021 | Segment:  Bakken
Mercer Capital's Value Focus: Energy Industry | Q3 2021 | Segment: BakkenMercer Capital
 
U.S. Midstream and Downstream Services Market Update
U.S. Midstream and Downstream Services Market UpdateU.S. Midstream and Downstream Services Market Update
U.S. Midstream and Downstream Services Market UpdateCapstone Headwaters
 
The role of Saudi Arabia in Global Energy Markets
The role of Saudi Arabia in Global Energy MarketsThe role of Saudi Arabia in Global Energy Markets
The role of Saudi Arabia in Global Energy MarketsEdouardLotz
 
US oil and gas reserves and production study 2018
US oil and gas reserves and production study 2018US oil and gas reserves and production study 2018
US oil and gas reserves and production study 2018Nihad Azizli
 
Mercer Capital's Value Focus: Refining | Year-End 2018
Mercer Capital's Value Focus: Refining | Year-End 2018Mercer Capital's Value Focus: Refining | Year-End 2018
Mercer Capital's Value Focus: Refining | Year-End 2018Mercer Capital
 
EY Price Point: global oil and gas market outlook (Q4, October 2020)
EY Price Point: global oil and gas market outlook (Q4, October 2020)EY Price Point: global oil and gas market outlook (Q4, October 2020)
EY Price Point: global oil and gas market outlook (Q4, October 2020)EY
 
EY Price Point: Global oil and gas market outlook Q4 2018
EY Price Point: Global oil and gas market outlook Q4 2018EY Price Point: Global oil and gas market outlook Q4 2018
EY Price Point: Global oil and gas market outlook Q4 2018EY
 
Exxon Initiating Coverage Report
Exxon Initiating Coverage ReportExxon Initiating Coverage Report
Exxon Initiating Coverage ReportMichael Butkerait
 

Similar to Vietnam Oil and Gas Sector Primed for Exploration Growth (20)

VN oil and gas 2014.PDF
VN oil and gas 2014.PDFVN oil and gas 2014.PDF
VN oil and gas 2014.PDF
 
Impact of covid 19 in oil industry part 2
Impact of covid 19 in oil industry part 2Impact of covid 19 in oil industry part 2
Impact of covid 19 in oil industry part 2
 
EY Price Point: global oil and gas market outlook
EY Price Point: global oil and gas market outlookEY Price Point: global oil and gas market outlook
EY Price Point: global oil and gas market outlook
 
Global Oil Outlook August 2016
Global Oil Outlook August 2016Global Oil Outlook August 2016
Global Oil Outlook August 2016
 
New base special 15 september 2014
New base special  15 september   2014New base special  15 september   2014
New base special 15 september 2014
 
EY Q1 2020 price point
EY Q1 2020 price pointEY Q1 2020 price point
EY Q1 2020 price point
 
Upstream Ahead - Oil & Gas Industry in India | 2021
Upstream Ahead - Oil & Gas Industry in India | 2021Upstream Ahead - Oil & Gas Industry in India | 2021
Upstream Ahead - Oil & Gas Industry in India | 2021
 
BMI-UKTI Webinar Presentation On Asia O&G Opportunities
BMI-UKTI Webinar Presentation On Asia O&G OpportunitiesBMI-UKTI Webinar Presentation On Asia O&G Opportunities
BMI-UKTI Webinar Presentation On Asia O&G Opportunities
 
Vanda Insights Petrochem 2019
Vanda Insights Petrochem 2019Vanda Insights Petrochem 2019
Vanda Insights Petrochem 2019
 
Mercer Capital's Value Focus: Refining | 2Q16
Mercer Capital's Value Focus: Refining | 2Q16 Mercer Capital's Value Focus: Refining | 2Q16
Mercer Capital's Value Focus: Refining | 2Q16
 
Oil Insights November 2015
Oil Insights November 2015Oil Insights November 2015
Oil Insights November 2015
 
EY Price Point 8.17.20
EY Price Point  8.17.20EY Price Point  8.17.20
EY Price Point 8.17.20
 
Mercer Capital's Value Focus: Energy Industry | Q3 2021 | Segment: Bakken
Mercer Capital's Value Focus: Energy Industry | Q3 2021 | Segment:  BakkenMercer Capital's Value Focus: Energy Industry | Q3 2021 | Segment:  Bakken
Mercer Capital's Value Focus: Energy Industry | Q3 2021 | Segment: Bakken
 
U.S. Midstream and Downstream Services Market Update
U.S. Midstream and Downstream Services Market UpdateU.S. Midstream and Downstream Services Market Update
U.S. Midstream and Downstream Services Market Update
 
The role of Saudi Arabia in Global Energy Markets
The role of Saudi Arabia in Global Energy MarketsThe role of Saudi Arabia in Global Energy Markets
The role of Saudi Arabia in Global Energy Markets
 
US oil and gas reserves and production study 2018
US oil and gas reserves and production study 2018US oil and gas reserves and production study 2018
US oil and gas reserves and production study 2018
 
Mercer Capital's Value Focus: Refining | Year-End 2018
Mercer Capital's Value Focus: Refining | Year-End 2018Mercer Capital's Value Focus: Refining | Year-End 2018
Mercer Capital's Value Focus: Refining | Year-End 2018
 
EY Price Point: global oil and gas market outlook (Q4, October 2020)
EY Price Point: global oil and gas market outlook (Q4, October 2020)EY Price Point: global oil and gas market outlook (Q4, October 2020)
EY Price Point: global oil and gas market outlook (Q4, October 2020)
 
EY Price Point: Global oil and gas market outlook Q4 2018
EY Price Point: Global oil and gas market outlook Q4 2018EY Price Point: Global oil and gas market outlook Q4 2018
EY Price Point: Global oil and gas market outlook Q4 2018
 
Exxon Initiating Coverage Report
Exxon Initiating Coverage ReportExxon Initiating Coverage Report
Exxon Initiating Coverage Report
 

Recently uploaded

Bladex 1Q24 Earning Results Presentation
Bladex 1Q24 Earning Results PresentationBladex 1Q24 Earning Results Presentation
Bladex 1Q24 Earning Results PresentationBladex
 
Vip B Aizawl Call Girls #9907093804 Contact Number Escorts Service Aizawl
Vip B Aizawl Call Girls #9907093804 Contact Number Escorts Service AizawlVip B Aizawl Call Girls #9907093804 Contact Number Escorts Service Aizawl
Vip B Aizawl Call Girls #9907093804 Contact Number Escorts Service Aizawlmakika9823
 
Andheri Call Girls In 9825968104 Mumbai Hot Models
Andheri Call Girls In 9825968104 Mumbai Hot ModelsAndheri Call Girls In 9825968104 Mumbai Hot Models
Andheri Call Girls In 9825968104 Mumbai Hot Modelshematsharma006
 
fca-bsps-decision-letter-redacted (1).pdf
fca-bsps-decision-letter-redacted (1).pdffca-bsps-decision-letter-redacted (1).pdf
fca-bsps-decision-letter-redacted (1).pdfHenry Tapper
 
(办理原版一样)QUT毕业证昆士兰科技大学毕业证学位证留信学历认证成绩单补办
(办理原版一样)QUT毕业证昆士兰科技大学毕业证学位证留信学历认证成绩单补办(办理原版一样)QUT毕业证昆士兰科技大学毕业证学位证留信学历认证成绩单补办
(办理原版一样)QUT毕业证昆士兰科技大学毕业证学位证留信学历认证成绩单补办fqiuho152
 
Log your LOA pain with Pension Lab's brilliant campaign
Log your LOA pain with Pension Lab's brilliant campaignLog your LOA pain with Pension Lab's brilliant campaign
Log your LOA pain with Pension Lab's brilliant campaignHenry Tapper
 
Attachment Of Assets......................
Attachment Of Assets......................Attachment Of Assets......................
Attachment Of Assets......................AmanBajaj36
 
Bladex Earnings Call Presentation 1Q2024
Bladex Earnings Call Presentation 1Q2024Bladex Earnings Call Presentation 1Q2024
Bladex Earnings Call Presentation 1Q2024Bladex
 
Q3 2024 Earnings Conference Call and Webcast Slides
Q3 2024 Earnings Conference Call and Webcast SlidesQ3 2024 Earnings Conference Call and Webcast Slides
Q3 2024 Earnings Conference Call and Webcast SlidesMarketing847413
 
VIP High Class Call Girls Saharanpur Anushka 8250192130 Independent Escort Se...
VIP High Class Call Girls Saharanpur Anushka 8250192130 Independent Escort Se...VIP High Class Call Girls Saharanpur Anushka 8250192130 Independent Escort Se...
VIP High Class Call Girls Saharanpur Anushka 8250192130 Independent Escort Se...Suhani Kapoor
 
Vp Girls near me Delhi Call Now or WhatsApp
Vp Girls near me Delhi Call Now or WhatsAppVp Girls near me Delhi Call Now or WhatsApp
Vp Girls near me Delhi Call Now or WhatsAppmiss dipika
 
Classical Theory of Macroeconomics by Adam Smith
Classical Theory of Macroeconomics by Adam SmithClassical Theory of Macroeconomics by Adam Smith
Classical Theory of Macroeconomics by Adam SmithAdamYassin2
 
Quantitative Analysis of Retail Sector Companies
Quantitative Analysis of Retail Sector CompaniesQuantitative Analysis of Retail Sector Companies
Quantitative Analysis of Retail Sector Companiesprashantbhati354
 
Stock Market Brief Deck for 4/24/24 .pdf
Stock Market Brief Deck for 4/24/24 .pdfStock Market Brief Deck for 4/24/24 .pdf
Stock Market Brief Deck for 4/24/24 .pdfMichael Silva
 
government_intervention_in_business_ownership[1].pdf
government_intervention_in_business_ownership[1].pdfgovernment_intervention_in_business_ownership[1].pdf
government_intervention_in_business_ownership[1].pdfshaunmashale756
 
OAT_RI_Ep19 WeighingTheRisks_Apr24_TheYellowMetal.pptx
OAT_RI_Ep19 WeighingTheRisks_Apr24_TheYellowMetal.pptxOAT_RI_Ep19 WeighingTheRisks_Apr24_TheYellowMetal.pptx
OAT_RI_Ep19 WeighingTheRisks_Apr24_TheYellowMetal.pptxhiddenlevers
 
letter-from-the-chair-to-the-fca-relating-to-british-steel-pensions-scheme-15...
letter-from-the-chair-to-the-fca-relating-to-british-steel-pensions-scheme-15...letter-from-the-chair-to-the-fca-relating-to-british-steel-pensions-scheme-15...
letter-from-the-chair-to-the-fca-relating-to-british-steel-pensions-scheme-15...Henry Tapper
 
The Triple Threat | Article on Global Resession | Harsh Kumar
The Triple Threat | Article on Global Resession | Harsh KumarThe Triple Threat | Article on Global Resession | Harsh Kumar
The Triple Threat | Article on Global Resession | Harsh KumarHarsh Kumar
 

Recently uploaded (20)

Bladex 1Q24 Earning Results Presentation
Bladex 1Q24 Earning Results PresentationBladex 1Q24 Earning Results Presentation
Bladex 1Q24 Earning Results Presentation
 
Vip B Aizawl Call Girls #9907093804 Contact Number Escorts Service Aizawl
Vip B Aizawl Call Girls #9907093804 Contact Number Escorts Service AizawlVip B Aizawl Call Girls #9907093804 Contact Number Escorts Service Aizawl
Vip B Aizawl Call Girls #9907093804 Contact Number Escorts Service Aizawl
 
Andheri Call Girls In 9825968104 Mumbai Hot Models
Andheri Call Girls In 9825968104 Mumbai Hot ModelsAndheri Call Girls In 9825968104 Mumbai Hot Models
Andheri Call Girls In 9825968104 Mumbai Hot Models
 
fca-bsps-decision-letter-redacted (1).pdf
fca-bsps-decision-letter-redacted (1).pdffca-bsps-decision-letter-redacted (1).pdf
fca-bsps-decision-letter-redacted (1).pdf
 
(办理原版一样)QUT毕业证昆士兰科技大学毕业证学位证留信学历认证成绩单补办
(办理原版一样)QUT毕业证昆士兰科技大学毕业证学位证留信学历认证成绩单补办(办理原版一样)QUT毕业证昆士兰科技大学毕业证学位证留信学历认证成绩单补办
(办理原版一样)QUT毕业证昆士兰科技大学毕业证学位证留信学历认证成绩单补办
 
Log your LOA pain with Pension Lab's brilliant campaign
Log your LOA pain with Pension Lab's brilliant campaignLog your LOA pain with Pension Lab's brilliant campaign
Log your LOA pain with Pension Lab's brilliant campaign
 
Attachment Of Assets......................
Attachment Of Assets......................Attachment Of Assets......................
Attachment Of Assets......................
 
Bladex Earnings Call Presentation 1Q2024
Bladex Earnings Call Presentation 1Q2024Bladex Earnings Call Presentation 1Q2024
Bladex Earnings Call Presentation 1Q2024
 
Q3 2024 Earnings Conference Call and Webcast Slides
Q3 2024 Earnings Conference Call and Webcast SlidesQ3 2024 Earnings Conference Call and Webcast Slides
Q3 2024 Earnings Conference Call and Webcast Slides
 
VIP High Class Call Girls Saharanpur Anushka 8250192130 Independent Escort Se...
VIP High Class Call Girls Saharanpur Anushka 8250192130 Independent Escort Se...VIP High Class Call Girls Saharanpur Anushka 8250192130 Independent Escort Se...
VIP High Class Call Girls Saharanpur Anushka 8250192130 Independent Escort Se...
 
Vp Girls near me Delhi Call Now or WhatsApp
Vp Girls near me Delhi Call Now or WhatsAppVp Girls near me Delhi Call Now or WhatsApp
Vp Girls near me Delhi Call Now or WhatsApp
 
Classical Theory of Macroeconomics by Adam Smith
Classical Theory of Macroeconomics by Adam SmithClassical Theory of Macroeconomics by Adam Smith
Classical Theory of Macroeconomics by Adam Smith
 
Quantitative Analysis of Retail Sector Companies
Quantitative Analysis of Retail Sector CompaniesQuantitative Analysis of Retail Sector Companies
Quantitative Analysis of Retail Sector Companies
 
Stock Market Brief Deck for 4/24/24 .pdf
Stock Market Brief Deck for 4/24/24 .pdfStock Market Brief Deck for 4/24/24 .pdf
Stock Market Brief Deck for 4/24/24 .pdf
 
government_intervention_in_business_ownership[1].pdf
government_intervention_in_business_ownership[1].pdfgovernment_intervention_in_business_ownership[1].pdf
government_intervention_in_business_ownership[1].pdf
 
OAT_RI_Ep19 WeighingTheRisks_Apr24_TheYellowMetal.pptx
OAT_RI_Ep19 WeighingTheRisks_Apr24_TheYellowMetal.pptxOAT_RI_Ep19 WeighingTheRisks_Apr24_TheYellowMetal.pptx
OAT_RI_Ep19 WeighingTheRisks_Apr24_TheYellowMetal.pptx
 
letter-from-the-chair-to-the-fca-relating-to-british-steel-pensions-scheme-15...
letter-from-the-chair-to-the-fca-relating-to-british-steel-pensions-scheme-15...letter-from-the-chair-to-the-fca-relating-to-british-steel-pensions-scheme-15...
letter-from-the-chair-to-the-fca-relating-to-british-steel-pensions-scheme-15...
 
The Triple Threat | Article on Global Resession | Harsh Kumar
The Triple Threat | Article on Global Resession | Harsh KumarThe Triple Threat | Article on Global Resession | Harsh Kumar
The Triple Threat | Article on Global Resession | Harsh Kumar
 
🔝+919953056974 🔝young Delhi Escort service Pusa Road
🔝+919953056974 🔝young Delhi Escort service Pusa Road🔝+919953056974 🔝young Delhi Escort service Pusa Road
🔝+919953056974 🔝young Delhi Escort service Pusa Road
 
Monthly Economic Monitoring of Ukraine No 231, April 2024
Monthly Economic Monitoring of Ukraine No 231, April 2024Monthly Economic Monitoring of Ukraine No 231, April 2024
Monthly Economic Monitoring of Ukraine No 231, April 2024
 

Vietnam Oil and Gas Sector Primed for Exploration Growth

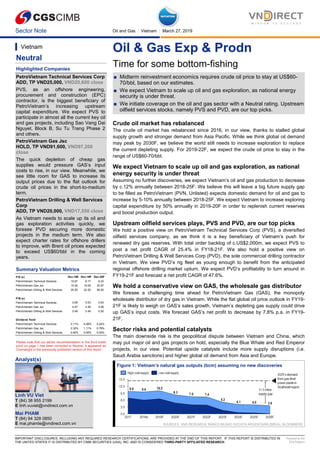
  • 1. Sector Note Oil and Gas │ Vietnam │ March 27, 2019 IMPORTANT DISCLOSURES, INCLUDING ANY REQUIRED RESEARCH CERTIFICATIONS, ARE PROVIDED AT THE END OF THIS REPORT. IF THIS REPORT IS DISTRIBUTED IN THE UNITED STATES IT IS DISTRIBUTED BY CIMB SECURITIES (USA), INC. AND IS CONSIDERED THIRD-PARTY AFFILIATED RESEARCH. Powered by the EFA Platform Oil & Gas Exp & Prodn Time for some bottom-fishing ■ Midterm reinvestment economics requires crude oil price to stay at US$60- 70/bbl, based on our estimates. ■ We expect Vietnam to scale up oil and gas exploration, as national energy security is under threat. ■ We initiate coverage on the oil and gas sector with a Neutral rating. Upstream oilfield services stocks, namely PVS and PVD, are our top picks. Crude oil market has rebalanced The crude oil market has rebalanced since 2016, in our view, thanks to stalled global supply growth and stronger demand from Asia Pacific. While we think global oil demand may peak by 2030F, we believe the world still needs to increase exploration to replace the current depleting supply. For 2019-22F, we expect the crude oil price to stay in the range of US$60-70/bbl. We expect Vietnam to scale up oil and gas exploration, as national energy security is under threat Assuming no further discoveries, we expect Vietnam’s oil and gas production to decrease by c.12% annually between 2018-25F. We believe this will leave a big future supply gap to be filled as PetroVietnam (PVN, Unlisted) expects domestic demand for oil and gas to increase by 5-10% annually between 2018-25F. We expect Vietnam to increase exploring capital expenditure by 50% annually in 2019-20F in order to replenish current reserves and boost production output. Upstream oilfield services plays, PVS and PVD, are our top picks We hold a positive view on PetroVietnam Technical Services Corp (PVS), a diversified oilfield services company, as we think it is a key beneficiary of Vietnam’s push for renewed dry gas reserves. With total order backlog of c.US$2,000m, we expect PVS to post a net profit CAGR of 25.4% in FY18-21F. We also hold a positive view on PetroVietnam Drilling & Well Services Corp (PVD), the sole commercial drilling contractor in Vietnam. We view PVD’s rig fleet as young enough to benefit from the anticipated regional offshore drilling market upturn. We expect PVD’s profitability to turn around in FY19-21F and forecast a net profit CAGR of 47.6%. We hold a conservative view on GAS, the wholesale gas distributor We foresee a challenging time ahead for PetroVietnam Gas (GAS), the monopoly wholesale distributor of dry gas in Vietnam. While the flat global oil price outlook in FY19- 21F is likely to weigh on GAS’s sales growth, Vietnam’s depleting gas supply could drive up GAS’s input costs. We forecast GAS’s net profit to decrease by 7.8% p.a. in FY19- 21F. Sector risks and potential catalysts The main downside risk is the geopolitical dispute between Vietnam and China, which may put major oil and gas projects on hold, especially the Blue Whale and Red Emperor projects, in our view. Potential upside catalysts include more supply disruptions (i.e. Saudi Arabia sanctions) and higher global oil demand from Asia and Europe. Figure 1: Vietnam’s natural gas outputs (bcm) assuming no new discoveries SOURCES: VND RESEARCH, BANCO BILBAO VIZCAYA ARGENTARIA (BBVA), BLOOMBERG Vietnam Neutral Highlighted Companies PetroVietnam Technical Services Corp ADD, TP VND25,000, VND20,600 close PVS, as an offshore engineering, procurement and construction (EPC) contractor, is the biggest beneficiary of PetroVietnam’s increasing upstream capital expenditure. We expect PVS to participate in almost all the current key oil and gas projects, including Sao Vang Dai Nguyet, Block B, Su Tu Trang Phase 2 and others. PetroVietnam Gas Jsc HOLD, TP VND91,600, VND97,200 close The quick depletion of cheap gas supplies would pressure GAS’s input costs to rise, in our view. Meanwhile, we see little room for GAS to increase its output prices due to the flat outlook for crude oil prices in the short-to-medium term. PetroVietnam Drilling & Well Services Corp ADD, TP VND20,000, VND17,550 close As Vietnam needs to scale up its oil and gas exploration activities quickly, we foresee PVD securing more domestic projects in the medium term. We also expect charter rates for offshore drillers to improve, with Brent oil prices expected to exceed US$60/bbl in the coming years. Summary Valuation Metrics Please note that our sector recommendation in the third bullet point on page 1 has been corrected to Neutral. It appeared as Overweight in the previously published version of this report. Analyst(s) Linh VU Viet T (84) 38 955 2199 E linh.vuviet@vndirect.com.vn Mai PHAM T (84) 94 328 0850 E mai.phamle@vndirect.com.vn P/E (x) Dec-18E Dec-19F Dec-20F PetroVietnam Technical Services 10.67 8.17 6.33 PetroVietnam Gas Jsc 15.46 19.09 20.97 PetroVietnam Drilling & Well Services 35.50 22.20 56.50 P/B (x) PetroVietnam Technical Services 0.69 0.63 0.63 PetroVietnam Gas Jsc 4.47 4.39 4.26 PetroVietnam Drilling & Well Services 0.49 0.49 0.50 Dividend Yield PetroVietnam Technical Services 3.11% 4.06% 5.24% PetroVietnam Gas Jsc 3.32% 1.11% 0.78% PetroVietnam Drilling & Well Services 0.00% 0.00% 0.00%
  • 2. Oil and Gas │ Vietnam Oil & Gas Exp & Prodn │ March 27, 2019 2 Time for some bottom-fishing INVESTMENT SUMMARY Crude oil market has been rebalanced We believe global oil prices have come full circle since the historic collapse in 4Q14, driven by the supply glut from shale oil. We think the rebalancing of the oil market has been driven by stalled global supply growth and stronger demand from Asia Pacific. Accordingly, average Brent crude oil price touched US$54.1/bbl in 2017 (+24.0% yoy) and US$71.2/bbl in 2018 (+31.5% yoy). Crude oil prices crashed in late-2014 as OPEC, in a bid to kill off competition from US shale oil, decided to flood the market with excess supply of oil which drove the price down dramatically. However, this strategy failed and OPEC had to agree on a supply cut to rebalance the market by the end of 2016. Crude oil prices have gradually recovered since then. Figure 2: Historical Brent crude oil price (US$/bbl) SOURCES: ENERGY INFORMATION ADMINISTRATION, VND RESEARCH, BLOOMBERG While the correction in 4Q18 raised concerns about the crude oil price possibly falling back into bearish territory, we believe that sentiment is running ahead of fundamentals due to a combination of broad equity market sell-off and growing fears of a global economic slowdown, as well as due to Saudi Arabia’s reduced geopolitical leverage to affect cuts, following the death of Saudi journalist Jamal Khashoggi in Oct 2018. We believe the big correction oil prices in 4Q18 was transitory and driven more by sentiment than by fundamental. Since Jan 2019, global oil prices have stabilised and recovered, helped by the impact of certain key OPEC countries cutting supplies by 2.2mbd to rebalance the market. Figure 3: Movements of Brent crude oil price (US$/bbl) in 2018 SOURCES: ENERGY INFORMATION ADMINISTRATION, VND RESEARCH, BLOOMBERG
  • 3. Oil and Gas │ Vietnam Oil & Gas Exp & Prodn │ March 27, 2019 3 Fundamentally, we still expect the global crude oil market to remain well balanced in 2019F, once the production cuts from Organization of the Petroleum Exporting Countries (OPEC) take effect and prevent inventories from building further. Barring a severe economic slump, we believe global oil demand will grow at roughly the pace seen in recent years, powered by emerging economies which, aside from China, continue to be in good health. We also see the shale boom, which caused an oil-price crash in 2014, as not being sufficient to pose a significant threat to global crude oil prices in the medium term. Rystad Energy estimates that shale oil can only account for a maximum of 8-10% of global crude oil supply till 2040F. Fundamentally, we still expect the global crude oil market to remain well balanced in 2019F, once the production cuts from OPEC take effect and prevent inventories from building further. Figure 4: Crude oil demand-supply balance (mbd) SOURCES: ENERGY INFORMATION ADMINISTRATION, VND RESEARCH We also see the shale boom, which caused an oil-price crash in 2014, as not being sufficient to pose a significant threat to global crude oil price in the medium term. Figure 5: Global oil demand (mbd) based on Rystad Energy estimates SOURCES: RYSTAD ENERGY, VND RESEARCH In the long term, while Rystad Energy expects future oil demand growth to peak by 2030F, by which time other energy sources may become more cost- competitive (i.e. renewables and electric vehicles) and socially acceptable (nuclear), we still see a certain long-term need for crude oil due to its competitive pricing and widespread popularity. We note that crude oil is used not just for transportation. In fact, the fastest- growing driver for oil consumption is chemicals. A rising middle class globally means the demand for petrochemicals will also increase as they are the base constituents of many basic products from paint to personal care items, growth in demand for which tends to track overall consumption growth; also, there are no obvious substitutes for these petrochemicals in their application areas.
  • 4. Oil and Gas │ Vietnam Oil & Gas Exp & Prodn │ March 27, 2019 4 As such, we see long-term growth in demand for petrochemicals by manufacturers, which should support oil demand, in our view. Figure 6: Global oil supply if oil discoveries remain at 2017-18 levels (mbd) SOURCES: RYSTAD ENERGY ESTIMATES, VND RESEARCH In terms of supply, there is also a pressing need to scale up global exploration activities to boost reserves. Due to significant cutbacks in exploration spending since 2014, global oil discoveries fell to just c.7billion metric tonnes of oil equivalent (btoe) in 2017, the lowest level since the 1940s and down sharply from an average of c.15 btoe per year discovered in the 2004-14 period (according to Energy Information Administration). Given the rapid depletion of existing oil fields, if exploration activities remain as sluggish as in 2017, the world is likely to face a supply shortage of c.35mbd by 2040F (according to Rystad Energy’s estimates). Due to significant cutbacks in exploration spending since 2014, global oil discoveries fell to just c.7 btoe. in 2017. Figure 7: Global conventional oil discoveries (btoe) SOURCES: ENERGY INFORMATION ADMINISTRATION, VND RESEARCH Given the rapid depletion of existing oil fields, if exploration activities remain as sluggish as they were in 2017, the world is likely to face a supply shortage of c.35mbd by 2040F, according to Rystad Energy. Figure 8: Global oil supply (mbd) if oil discoveries remain as low as 2017-18 levels SOURCES: RYSTAD ENERGY ESTIMATES, VND RESEARCH From 2019-21F, we expect that extraction economics will demand that crude oil price trades within the US$60-70/bbl range, with an approximately 50% increase in extraction costs from 2015 levels as the current shallow-water oil fields get
  • 5. Oil and Gas │ Vietnam Oil & Gas Exp & Prodn │ March 27, 2019 5 depleted and extraction moves to deeper-water oil fields with higher complexity and development cost. From 2019-21F, we expect that extraction economics will demand that crude oil price trades within a US$60- 70/bbl range, which is… Figure 9: Breakeven cost of global new crude oil supply (US$/bbl) in 2019-21F SOURCES: RYSTAD ENERGY ESTIMATES, VND RESEARCH … approximately 50% higher than the extraction cost in 2015 as the current shallow-water oil fields get depleted and extraction moves to deeper-water oil fields with higher complexity and development cost. Figure 10: Breakeven cost of global crude oil supply (US$/bbl) in 2015 SOURCES: RYSTAD ENERGY ESTIMATES, VND RESEARCH Typically, there is a broad range in general expectations of crude oil price for the 2019-22F period from international organisations. In our view, Brent crude oil price will stay above US60$/bbl over the next four years, which aligns with the US$60-70/bbl breakeven cost of new crude oil supply in 2019- 21F. In our view, Brent crude oil price will stay above US$60/bbl over the next four years. Figure 11: Brent crude oil price forecasts (US$/bbl) as at Dec 2018 SOURCES: RYSTAD ENERGY, BLOOMBERG, BANCO BILBAO VIZCAYA ARGENTARIA (BBVA), VND RESEARCH
  • 6. Oil and Gas │ Vietnam Oil & Gas Exp & Prodn │ March 27, 2019 6 Vietnam’s energy security is under threat in medium term Vietnam’s oil and gas production has been declining at an annual rate of c.8% in 2015-18. This steep drop in production has roughly tracked the decline in capital expenditure for exploration activities of PetroVietnam’s (PVN, Unlisted) – the state-owned corporation responsible for national oil and gas activities in Vietnam - since 2015, due to depressed crude oil prices. This lack of exploration has led to insufficient new discoveries, with annual reserve growth falling to 4 million tonnes of oil equivalent (mtoe) in 2017, the lowest level in history (according to PetroVietnam). Vietnam’s oil and gas production has been declining at an annual rate of c.8% in 2015-18. Figure 12: Vietnam’s oil and gas production output (mtoe) SOURCES: PETROVIETNAM, VND RESEARCH The lack of exploration in the country has led to insufficient new discoveries, with annual reserves growth falling to 4mtoe in 2017, the lowest level in history. Figure 13: PetroVietnam’s capital expenditure (VND tr) SOURCES: PETROVIETNAM, VND RESEARCH Meanwhile, the majority of existing oilfields in Vietnam are already in their final stages of production, with production outputs declining by 15-30% per year since 2016. If there are no oil new discoveries, we believe the domestic supply of crude oil will not be sufficient to satisfy the feedstock demand from Binh Son Refinery (BSR VN: UpCOM, Not Rated) from 2020F onwards. Note that BSR currently relies entirely on domestic crude oil as feedstock. If there are no new oil discoveries, we believe the domestic supply of crude oil will not be sufficient to satisfy the feedstock demand from Binh Son Refinery (BSR) from 2020F onwards. Figure 14: Vietnam’s crude oil outputs assuming no new oil discoveries (m tonnes) SOURCES: VIETNAM PETROLEUM INSTITUTE’S ESTIMATES, VND RESEARCH
  • 7. Oil and Gas │ Vietnam Oil & Gas Exp & Prodn │ March 27, 2019 7 The depletion of natural gas output is even more worrying to us as domestic natural gas demand is expected by PetroVietnam to grow 50% by 2025F when three new gas-fired power plants begin operation. The depletion of natural gas output is even more worrying to us. Figure 15: Vietnam’s natural gas outputs (bcm) assuming no new discoveries SOURCES: VIETNAM PETROLEUM INSTITUTE’S ESTIMATES, VND RESEARCH We see a significant exploration scale-up already under way The robust recovery of crude oil price since late 2016 has put Vietnam in a good position to step up exploration activities after years of subdued investments. The average oil extraction cost in Vietnam was ~US$45/bbl in 2018 (according to Rystad Energy), below consensus forecasts for Brent crude oil prices of US$65- 70/bbl in 2019F. Given the looming energy security issues alluded to earlier, we believe this might help to boost Vietnam’s exploration activities in the medium term. The average oil extraction cost in Vietnam is ~US$45/bbl, below consensus forecasts for Brent crude oil prices of US$65-70/bbl in 2019F. Figure 16: Breakeven field development cost (US$/bbl) by country in 2018 SOURCES: RYSTAD ENERGY’S ESTIMATES, VND RESEARCH According to PVN’s business plan until 2020F, the target for annual growth of oil and gas reserves is 20-40mtoe. This target, which is 2-4 times higher than the estimated reserves growth of 10mtoe in 2018 (according to PetroVietnam), is highly demanding given the escalated exploration cost of new discoveries, in our view. As shelf oil fields run dry, the frontier of exploration will be pushed to more remote areas which require higher levels of equipment, technology, and expensive specialists. Under intense pressure to increase discoveries and given the higher cost of developing new oil fields, we expect Vietnam to increase capital expenditure for oil exploration by c.40% annually in 2019-22F in order to replenish current reserves and boost production output.
  • 8. Oil and Gas │ Vietnam Oil & Gas Exp & Prodn │ March 27, 2019 8 Under intense pressure to increase discoveries and given the higher cost of developing new oil fields, we expect Vietnam to increase capital expenditure for oil exploration by c.40% annually in 2019- 22F. Figure 17: PetroVietnam’s capex forecasts (VND tr) based on our estimates SOURCES: VND RESEARCH In the medium term, PetroVietnam is planning large oil exploration and drilling projects like Ca Rong Do (Red Emperor), Ca Voi Xanh (Blue Whale) and Block B-O Mon. According to PetroVietnam, those projects are reported to have the largest oil and gas production potential in Vietnam. Meanwhile, Sao Vang-Dai Nguyet and other gas fields are being developed in parallel with the second phase of Su Tu Trang (White Lion) project to ensure sufficient gas supply for the southeast region once two new gas-fired power plants, namely Nhon Trach 3 and Nhon Trach 4, come into operation in 2021F. Ca Rong Do, Sao Vang Dai Nguyet, Block B – O Mon, and Ca Voi Xanh are the largest oil and gas projects in Vietnam to date. Figure 18: PetroVietnam’s key oil and gas projects in medium term SOURCES: VND RESEARCH We also see the proposed revision of the petroleum law to further boost foreign direct investment (FDI) in Vietnam’s exploration activities in the coming years. At a recent energy seminar, Vice Chairman of Economic Committee – Mr Nguyen Duc Kien unveiled that the Law on Petroleum will be amended, possibly between 2019F and 2020F, to legally facilitate the development of Vietnam’s oil and gas industry as well as a sustainable maritime economy until 2030F. According to Vietnam Petroleum Institute’s proposal, the revision of petroleum law should be focused on making the production-sharing contract (PSC) more attractive to foreign investors. Figure 19: Possible revision of petroleum law 2008 – Production-sharing contract SOURCES: VIETNAM PETROLEUM INSTITUTE, VND RESEARCH According to Vietnam Petroleum Institute’s proposal, the revision of the petroleum law should be focused on making the production sharing contract Regulation Min. Max. Min. Max. Income tax 10%-29% 7%-23% 32% 28% Export duty 10% 10% 4% 0% Allowable costs 50% 70% 70% 70% Profit sharing to contractor 50% 83% 25%-83% 45%-90% Resource tax - Crude oil 8%-25% 6%-20% 7%-23% 4%-20% Resource tax - Natural gas 0%-10% 0%-6% 1%-6% 0%-6% Current - Petroleum law 2008 Proposed revison
  • 9. Oil and Gas │ Vietnam Oil & Gas Exp & Prodn │ March 27, 2019 9 (PSC) more attractive to foreign investors. “In fact, foreign investors have spent US$45bn on exploration but they have brought just US$21bn back to their countries,” said Mr Tran Sy Thanh, PetroVietnam Chairman in Sep 2018. VALUATION AND RECOMMENDATION Initiate sector coverage at Neutral, with upstream oilfield services stocks as our top picks Typically, fluctuations in crude oil prices have the most impact on up-to- midstream oil and gas companies. Even so, the link between oil prices and earnings is generally nuanced for oil field service companies owing to their dependence on exploration & production (E&P) activity which tends to track oil prices but with a big time lag. Generally, it takes 1-2 years before oilfield service companies start benefiting from upward movements in crude oil prices due to the long lead times associated with a resumption of exploration activity. Figure 20: EPS of key upstream oil and gas stocks (VND) Figure 21: EPS of key downstream oil and gas stocks (VND) SOURCES: VND RESEARCH, COMPANY REPORTS SOURCES: VND RESEARCH, COMPANY REPORTS We hold a positive view on PetroVietnam Technical Services Corp (PVS VN, Add, TP: VND25,000) as we believe it will be the first beneficiary of the expected recovery in Vietnam’s oil exploration activities. PVS is the sole domestic contractor that provides engineering, procurement and construction (EPC) services to offshore oil and gas projects in Vietnam. Currently, PVS is the main EPC contractor for the Sao Vang Dai Nguyet project (total contract value of c.US$850m). Other big projects in its pipeline are Su Tu Trang Phase 2, Nam Du – U Minh, Blue Whale, and Block B – O Mon. The total order backlog for these projects, while not yet disclosed in detail, could amount to US$2,000m, based on our estimates. We initiate on PVS with an Add and TP of VND25,000, based on a combination of DCF (weight 50%) and target FY19-21F P/E of 7.8x (weight 50%). We also hold a positive view on PetroVietnam Drilling & Well Services Corp (PVD VN, Add, TP: VND20,000). As the need for more oil and gas discoveries becomes increasingly pressing, Rystad Energy expects global capex for oilfield services to bounce back and post a CAGR of 10.2% in FY18-22F. Drilling contractors, in particular, are regarded as one of the earliest and primary beneficiaries of such an upturn in global spending for offshore oilfield services. We expect the jack-up utilisation rate to return to above 90% by 2023F (vs. c.65% in 2018). We initiate coverage on PVD with an Add rating and TP of VND20,000, based on a 50:50 weighting of DCF and 0.6x FY19-21F P/BV.
  • 10. Oil and Gas │ Vietnam Oil & Gas Exp & Prodn │ March 27, 2019 10 In contrast, we foresee a challenging time ahead for PetroVietnam Gas Jsc (GAS VN, Hold, TP: VND91,600). We expect a declining profitability for the company’s dry gas segment, which contributed some 50-55% of its total annual gross profit in the FY15-18 period. While the selling price of this segment has little upside due to the flat oil price outlook, the input price for this segment is also facing upward pressure due to the quick depletion of the cheap domestic gas supply. Thus, in FY18-21F, we forecast GAS’s EPS to decrease by 7.8% p.a. We initiate coverage on GAS with a Hold rating and target price of VND91,600, based on an equal weighting of DCF and target FY19-21F P/E multiple of 18.0x. At the same time, the scaling up of upstream exploration activities has had little impact on the profitability of downstream refiners and distributors such as Binh Son Refinery and Petrolimex (PLX VN, Not Rated). Figure 22: Valuation snapshot for Vietnam oil and gas stocks under our coverage SOURCES: VND RESEARCH, BLOOOMBERG (AS AT 26 MAR 2019) Overall, we are more positive on mid-cap stocks PVS and PVD than the large- cap GAS. Apart from their stronger fundamental outlook, we expect PVS and PVD to benefit from the shift in investors’ focus in the Vietnam stock market away from large-cap names to high-quality mid-cap names. In our view, there is still a sizeable valuation gap between the large-cap stocks and hundreds of mid- cap stocks (which are trading at half the large-cap valuations, based on our estimates). In 1 Jan-31 Mar 2019, Vietnam’s mid-cap share prices have risen by nearly 13%, higher than the 8.5% increase in large-cap share prices. Figure 23: Global oil and gas peer comparison Note: Not Rated forecasts based on Bloomberg consensus estimates; trailing 12 months (TTM) SOURCES: VND RESEARCH, BLOOOMBERG (AS AT 26 MAR 2019) 3-year EPS 5-yr TTM CY19F CY20F CAGR (%) 5-yr TTM CY19F CY20F 5-yr TTM CY19F 5-yr TTM CY19F PV GAS GAS VN HOLD 97,200 91,600 8,010 13.8 16.4 19.3 20.9 -10.6% 3.5 4.2 4.0 3.8 28.2% 23.6% 20.6% 18.8% 15.7% 15.4% PV Technical Services PVS VN ADD 20,600 25,000 420 8.7 9.8 8.7 6.6 -25.7% 0.7 0.9 0.8 0.8 14.6% 6.7% 7.0% 5.2% 3.1% 4.5% PV Drilling PVD VN ADD 17,550 20,000 290 16.2 38.0 20.3 20.1 -66.4% 1.1 0.6 0.5 0.5 14.8% 1.4% 2.6% 6.3% 1.1% 1.3% Company Bloomberg Ticker Recom. Share Price (local curr) Target Price (local curr) Market Cap (US$ m) P/E (x) P/BV (x) ROE (%) ROA (%) 3-year EPS 5-yr TTM CY19F CY20F CAGR (%) 5-yr TTM CY19F CY20F 5-yr TTM CY19F 5-yr TTM CY19F Gas distribution companies PV GAS GAS VN HOLD 97,200 91,600 8,010 13.8 16.4 19.3 20.9 -10.6% 3.5 4.2 4.0 3.8 28.2% 23.6% 20.6% 18.8% 15.7% 15.4% PTT PLC PTT TB HOLD 48.50 53.00 45,088 17.1 10.4 10.9 10.3 -29.0% 1.6 1.6 1.4 1.3 11.3% 7.7% 9.0% 6.6% 4.7% 6.4% Indraprastha Gas IGL IN NOT RATED 301.3 N/A 2,650 17.7 25.4 N/A N/A 28.0% 0.6 0.6 0.6 N/A 3.4% 2.2% N/A 3.5% 4.7% N/A China Gas Holdings 384 HK ADD 28.15 40.00 2,271 18.6 22.1 17.50 14.10 28.7% 3.6 5.3 3.8 2.7 19.5% 24.9% 25.4% 6.8% 10.4% 11.1% Toho Gas Ltd 9533 JP NOT RATED 5,070 N/A 43,500 24.0 30.0 N/A N/A -1.1% 1.5 1.3 N/a N/A 7.7% 4.6% N/A 4.1% 2.8% N/A Titas Gas Trans & Distri TITASGAS BD NOT RATED 36.70 N/A 432 8.6 7.6 N/A N/A -21% 1.3 0.6 N/a N/A 15.9% 6.6% N/A 8.9% 3.6% N/A Petronas Gas Bhd PTG MK HOLD 17.70 18.50 9,217 23.5 18.4 18.0 19.6 -0.9% 3.9 2.8 2.7 2.6 17.3% 15.2% 15.0% 13.2% 10.8% 12.0% Oil services companies PV Technical Services PVS VN ADD 20,600 25,000 420 8.7 9.8 8.7 6.6 -25.7% 0.7 0.9 0.8 0.8 14.6% 6.7% 7.0% 5.2% 3.1% 4.5% Mermaid Maritime MMT SP NOT RATED 0.08 N/A 119 23.0 N/A N/A N/A -36.0% 0.6 0.3 N/A N/A -6.7% -4.2% N/A -4.6% -3.1% N/A Yinson Holdings YNS MK ADD 4.52 4.84 1,085 16.0 13.7 24.4 36.7 3.5% 3.3 1.9 1.5 1.5 17.5% 9.6% 6.6% 6.8% 4.0% 6.0% Sembcorp Marine SMM SP ADD 1.68 2.46 2,604 21.6 N/A 103.2 68.7 -70.8% 2.2 1.3 1.5 1.5 6.9% -8.6% 1.5% 2.7% -2.3% 1.2% Hyundai Engineering 000720 KS ADD 51,600 68,000 4,979 12.1 18.2 13.9 13.2 -21.7% 1.0 0.9 1.0 0.9 7.6% 4.6% 7.6% 2.4% 1.6% 4.1% Keppel Corp KEP SP ADD 6.21 8.28 8,159 10.2 12.1 11.5 10.1 -39.1% 1.5 0.9 0.9 0.8 12.2% 10.1% 8.3% 4.2% 4.7% 4.3% Malaysia Marine Eng MMHE MK NOT RATED 0.79 N/A 212 21.9 36.0 N/A N/A -35.9% 1.3 0.4 N/A N/A 2.4% 1.0% N/A 1.2% 0.8% N/A Offshore drilling companies PV Drilling PVD VN ADD 17,550 20,000 290 16.2 38.0 20.3 20.1 -66.4% 1.1 0.6 0.5 0.5 14.8% 1.4% 2.6% 6.3% 1.1% 1.3% Velesto Energy Bhd VEB MK ADD 0.28 0.28 465 26.5 411.0 52.7 51.3 N/A 1.7 0.7 0.7 0.7 -16.2% 0.2% 1.3% -6.1% 1.2% 1.8% Sapura Energy Bhd SAPE MK ADD 0.34 0.57 511 34.6 N/A N/A N/A N/A 1.1 0.2 0.4 0.4 -0.2% -2.8% -4.8% 0.2% 1.6% 0.9% Ensco OXHI LN NOT RATED 4.42 N/A 1,846 10.7 N/A N/A N/A N/A 0.5 0.2 N/A N/A -11.6% -7.6% N/A -6.6% -4.5% N/A Transocean RIGN SW NOT RATED 9.42 N/A 102,200 6.2 N/A N/A N/A N/A 0.4 0.4 N/A N/A -7.7% -15.5% N/A -4.2% -8.3% N/A Rowan Companies RDC LN NOT RATED 12.11 N/A 1,473 13.5 N/A N/A N/A N/A 0.5 0.3 N/A N/A 0.2% -6.7% N/A 0.0% -4.2% N/A Average - Gas distribution peers 15,881 17.6 18.6 -19.9% 2.3 2.3 14.8% 12.1% 8.8% 7.5% Average - Oil services peers 2,511 16.2 18.0 -32.2% 1.5 0.9 7.8% 2.7% 2.6% 1.3% Average - Offshore drilling peers 17,797 18.0 224.5 -66.4% 0.9 0.4 -3.5% -5.2% -1.7% -2.2% Company Bloomberg Ticker Recom. Share Price (local curr) Target Price (local curr) Market Cap (US$ m) P/E (x) P/BV (x) ROE (%) ROA (%)
  • 11. Oil and Gas │ Vietnam Oil & Gas Exp & Prodn │ March 27, 2019 11 RISKS AND POTENTIAL CATALYSTS Downside risks The key threat to Vietnam’s oil and gas exploration ramp-up, in our view, is the ongoing territorial dispute with China in the East Sea. Some of Vietnam’s major oil and gas projects such as Ca Rong Do and Blue Whale, fall within China’s “nine-dash line,” which serves as the basis for China’s controversial claims to most of the resource-rich waterway in the East Sea. Such claims by China have been rejected by Vietnam as the nine-dash line extends over large portions of Vietnam’s exclusive economic zone. While China has never used the nine-dash line as an inviolable border to its sovereignty, a certain amount of pressure is still imposed on Vietnam’s oil and gas exploration activities in these areas. In March 2018, the Ca Rong Do project was suspended indefinitely, supposedly due to pressure from China. Despite geopolitical tensions in the East Sea being a concern, we believe major oil and gas projects in Vietnam will proceed in time to meet rising dry gas demand through domestic sources. Figure 24: Location of key oil and gas projects in Vietnam SOURCES: INTERNATIONAL MARITIME ORGANIZATION (IMO) Despite geopolitical tensions with China being a considerable concern, we believe major oil and gas projects in Vietnam will proceed in time to meet rising dry gas demand through domestic sources. While Block B – O Mon project is not within the disputed area, Sao Vang Dai Nguyet project is located well within the long-time developed Nam Con Son basin, and Blue Whale project has the participation of Exxon Mobil (XOM US, Not Rated) – the giant US-based energy developer that thwarted China’s protests in striking an exploration deal with Vietnam in 2008. With China clearly on the “back foot” in ongoing trade negotiations with the US, in our view, we believe it will be more careful in challenging US companies’ interests in the South China Sea. Potential upside catalysts  Global geopolitical disputes cause more supply disruptions such as US sanctions on Saudi Arabia/Russia/Iran.  Shale oil production growth is not as high as expected.  Higher oil demand growth from Asia Pacific and Europe.
  • 12. Company Note Oil & Gas Exp & Prodn │ Vietnam │ March 27, 2019 Shariah Compliant IMPORTANT DISCLOSURES, INCLUDING ANY REQUIRED RESEARCH CERTIFICATIONS, ARE PROVIDED AT THE END OF THIS REPORT. IF THIS REPORT IS DISTRIBUTED IN THE UNITED STATES IT IS DISTRIBUTED BY CIMB SECURITIES (USA), INC. AND IS CONSIDERED THIRD-PARTY AFFILIATED RESEARCH. Powered by the EFA Platform Insert Insert PetroVietnam Drilling & Well Services JSC Patience is a virtue ■ PVD’s rig fleet is young enough to benefit from the oil services market upturn. ■ We expect PVD’s profitability to turn around in FY19-21F. ■ We initiate coverage with an Add rating and target price of VND20,000. We see PVD’s rig fleet as young enough… Compared to its global peers, PVD is still a fairly-competitive offshore driller, in our view, thanks to its relatively-young rig fleet. The average age of PVD’s rig fleet is only eight years, which is much lower than the global average of 20 years. According to Bassoe Analytics, c.40% of the global jack-up fleet (as at 2018) is at least 30 years old. …to benefit from anticipated global oilfield services market upturn As the need for more oil and gas discoveries becomes increasingly pressing, Rystad Energy expects global capex for oilfield services to bounce back and post a CAGR of 10.2% in 2018-22F. Drilling contractors, in particular, are regarded as one of the earliest and primary beneficiaries of such an upturn in global spending for offshore oilfield services. We forecast jack-up utilisation rate to rise above 90% by 2023F (c.65% in 2018). We differ in expecting PVD’s profitability to turn around in FY19-21F We expect PVD to make a major turnaround to net profit growth in FY19-21F. We forecast PVD to post revenue CAGR of 11.6% and EPS CAGR of 47.6% in FY18-21F. Our key assumptions are: 1) the jack-up charter rate increases from US$55k/day in FY18 to c.US$70k/day in FY21F. Our charter rate assumption aligns with the new charter rate of US$68k/day given to PVD I jack-up from 20 January 2019 (source: Bassoe Analytics), (2) the utilisation rate for PVD’s jack-up fleet is stable over FY19-21F at 90% (the FY18 level), (3) the TAD rig starts working again in 2H20F at a charter rate of US$75k/day. Initiate coverage with Add and target price of VND20,000 We initiate coverage on PVD with a Add rating and target price of VND20,000, based on a combination of DCF (weight 50%) and FY19-21F target P/BV multiple of 0.6x (weight 50%). Our DCF valuation is based on terminal growth of 1.2% and weighted average cost of capital (WACC) of 19.7%. We estimate PVD’s WACC at 17.7% assuming: 1) a risk- free rate of 5.0%, 2) beta of 1.8 and 3) equity risk premium of 11%. Risks and potential re-rating catalysts Potential catalysts are: 1) Ca Rong Do project revives and PVD’s TAD rig receives higher-than-expected charter rate, and 2) higher-than-expected charter rates for PVD’s jack-up fleet. Downside risks include: 1) lower-than-expected global crude oil price, 2) PVD’s TAD rig fails to resume operations post FY19F. SOURCES: VND RESEARCH, COMPANY REPORTS Vietnam ADD (previously NOT RATED) Consensus ratings*: Buy 3 Hold 3 Sell 0 Current price: VND17,550 Target price: VND20,000 Previous target: N/A Up/downside: 14.0% CGS-CIMB / Consensus: 2.8% Reuters: PVD.HM Bloomberg: PVD VN Market cap: US$289.6m VND6,719,021m Average daily turnover: US$1.47m VND34,080m Current shares o/s: 383.3m Free float: 34.0% *Source: Bloomberg Key changes in this note Not applicable. Source: Bloomberg Price performance 1M 3M 12M Absolute (%) 2 17 -9.5 Relative (%) 3.5 8.7 7.2 Major shareholders % held PetroVietnam Group 50.4 Others 49.6 Insert Analyst(s) Linh VU Viet T (84) 38 955 2199 E linh.vuviet@vndirect.com.vn Mai PHAM T (84) 94 328 0850 E mai.phamle@vndirect.com.vn Financial Summary Dec-17A Dec-18A Dec-19F Dec-20F Dec-21F Revenue (VNDb) 3,891 5,503 5,880 6,843 7,652 Operating EBITDA (VNDb) 393 696 613 718 1,074 Net Profit (VNDb) 45.3 187.9 352.7 355.6 604.6 Core EPS (VND) 118 490 920 928 1,577 Core EPS Growth (65%) 315% 88% 1% 70% FD Core P/E (x) 148.5 35.8 19.1 18.9 11.1 DPS (VND) 3.64 0.00 0.00 0.00 0.00 Dividend Yield 0.021% 0.000% 0.000% 0.000% 0.000% EV/EBITDA (x) 18.22 9.87 10.94 9.20 5.40 P/FCFE (x) NA 5.0 NA 282.7 6.3 Net Gearing 5.35% 4.07% 2.55% 1.49% (4.69%) P/BV (x) 0.51 0.50 0.50 0.50 0.48 ROE 0.34% 1.40% 2.60% 2.63% 4.38% % Change In Core EPS Estimates CIMB/consensus EPS (x) 65,740 84,342 105,163 79.0 99.8 120.7 11,000 16,000 21,000 Price Close Relative to VNINDEX (RHS) 5 10 Mar-18 Jun-18 Sep-18 Dec-18 Volm
  • 13. Oil & Gas Exp & Prodn │ Vietnam PetroVietnam Drilling & Well Services JSC │ March 27, 2019 13 Patience is a virtue INVESTMENT THESIS PVD is still struggling financially amid a slow recovery in global offshore drilling market PetroVietnam Drilling and Well Services’ (PVD) main business is to provide offshore exploration drilling for oilfield operators in Vietnam and Southeast Asia. The company’s financial performance has deteriorated significantly since the crude oil price’s collapse in late 2014. To be specific, the average daily charter rates for PVD’s jack-up fleet have decreased by c.50% since 2015. Meanwhile, PVD’s TAD rig has even stopped working since the end of 2016 due to the lack of job opportunities. Figure 1: PVD’s revenue breakdown by segment (VND bn) Figure 2: PVD’s adjusted gross profit breakdown by segment (VND bn) SOURCES: VND RESEARCH, COMPANY REPORTS SOURCES: VND RESEARCH, COMPANY REPORTS Figure 3: PVD’s charter rate and utilisation rate of jack-up fleet Figure 4: PVD’s charter rate and utilisation rate of TAD rig SOURCES: VND RESEARCH, COMPANY REPORTS SOURCES: VND RESEARCH, COMPANY REPORTS Recent weakness in PVD’s financial performance mirrors the worldwide struggle in the offshore drilling market since late 2014. In particular, the charter rate and utilisation rate for the global jack-up fleet (independent leg cantilever, IC, 250 feet and above) has dropped by c.30% and c.25%, respectively, in 2018 from their peaks in mid-2015 (source: IHS Markit). From late 2016 to 2018, the demand for exploration drilling remained low despite recent recovery in the The average daily charter rates of PVD’s jack-up fleet have decreased by c.50% since 2015. Meanwhile, PVD’s TAD rig has even stopped working since late 2016 due to the lack of job opportunities.
  • 14. Oil & Gas Exp & Prodn │ Vietnam PetroVietnam Drilling & Well Services JSC │ March 27, 2019 14 crude oil price. Historically, the demand for drilling rigs has followed the crude oil price curve with a lag of c.1 year. According to Rystad Energy, compared to other oilfield services such as engineering procurement construction and installation (EPCI) and subsea, the contract price of offshore drillers has suffered the most over 2014-17. This situation is largely due to the inflexible nature of offshore drilling business, which demands very high maintenance expenses for idle rigs (unutilised rigs). Typically, offshore drillers would rather accept a low contract price instead of leaving their rigs in idle mode. In addition, the longer the rig is idle, the higher the reactivation expense required once it returns to work. Recent weakness in PVD’s financial performance has mirrored the worldwide struggle in the offshore drilling market since late 2014. Figure 5: Global charter rate and utilisation of jack-up (IC 250ft and above) SOURCES: VND RESEARCH, COMPANY REPORTS, BLOOMBERG, IHS MARKIT According to Rystad Energy, compared to other oilfield services such as EPCI and subsea, the contract price of offshore drillers has suffered the most over 2014-17. Figure 6: Offshore price index (2014 = 100 points) SOURCES: RYSTAD ENERGY, VND RESEARCH Typically, offshore drillers would rather accept a low contract price instead of leaving their rigs in idle mode as maintenance costs are high for idle rigs. In addition, the longer the rig is idle, the higher the reactivation expense required once it returns to work. Figure 7: Expected reactivation costs (US$ m) vs. number of months idling SOURCES: VND RESEARCH, ABG SUNDAL COLLIER However, we view PVD’s rig fleet as young enough… Compared to its global peers, PVD is still a fairly-competitive offshore driller, in our view, thanks to its relatively-young rig fleet. The average age of PVD’s rig fleet is only eight years, which is much lower than the global average of 20 years (according to Bassoe Analytics). Particularly, Bassoe Analytics also noted that c.40% of global jack-up fleet (as at 2018) is at least 30 years old. There are even 46 rigs (excluding those considered non-competitive) built long ago in the 1970s and which face huge efficiency problems.
  • 15. Oil & Gas Exp & Prodn │ Vietnam PetroVietnam Drilling & Well Services JSC │ March 27, 2019 15 In the medium term, we think that rigs aged over 30 years are likely to be scrapped and rigs aged over 20 years are likely to be excluded from tenders as oil companies continue to focus on better technology, higher efficiency and reducing safety risk. Figure 8: Average age of PVD’s jack-up fleet (years), as at end 2018 SOURCES: VND RESEARCH, COMPANY REPORTS Figure 9: Average age of jack-up fleet (years) by major global offshore drilling company, as at end 2018 SOURCES: VND RESEARCH, RIGZONE Figure 10: The number of jack-up rigs aged above 28 years by location, as at end 2018 SOURCES: VND RESEARCH, RIGZONE …to benefit from the anticipated global oilfield services market upturn According to Rystad Energy, the global offshore oilfield services market is likely to have reached its trough in 2018 in terms of profitability. As the need for more oil and gas discoveries becomes increasingly pressing, Rystad Energy expects the global capex for oilfield services to bounce back and post a CAGR of 10.2% in 2018-22F. This growth rate is considered highly positive for the oilfield service industry since it is even higher than the CAGR witnessed in FY10-14, when Brent crude oil price escalated from US$77/bbl to US$114/bbl. As the need for more oil and gas discoveries becomes increasingly pressing, Rystad Energy expects that the global capex for oilfield services will bounce back and post a CAGR of 10.2% in 2018-22F. Figure 11: Global capex for offshore oilfield services (US$ bn) SOURCES: VND RESEARCH, RYSTAD ENERGY ESTIMATES
  • 16. Oil & Gas Exp & Prodn │ Vietnam PetroVietnam Drilling & Well Services JSC │ March 27, 2019 16 Drilling contractors, in particular, are regarded as one of the earliest and primary beneficiaries of such an upturn in global spending for offshore oilfield services. We expect the jack-up utilisation rate to return to above 90% by 2023F, after c.70% of obsolete jack-ups are retired by the market. Once the market utilisation rate surpasses 85%, drilling contractors are likely to start pushing for considerably higher charter rates, in our view. We expect the jack-up utilisation rate to return to above 90% by 2023F, after c.70% of obsolete jack-ups are retired by the market. Figure 12: Global supply and demand of jack-up fleet SOURCES: VND RESEARCH, BASSOE ANALYTICS We expect PVD’s profitability to turn around over FY18-21F We expect PVD to make a major turnaround to net profit growth in FY18-21F, with EPS CAGR of 47.6%. Our main assumptions are as listed below: 1) We forecast the jack-up charter rate to increase from US$55k/day to c.US$70k/day in FY18-21F. Our charter rate assumption aligns with the new charter rate of US$68k/day given to PVD I jack-up by client Thang Long JOC from 20 January 2019 (source: Bassoe Analytics). Please refer to Figure 11 for specific charter rate per year. 2) We expect the utilisation rate of the jack-up fleet to remain stable at 90% over this period, the same as in FY18. 3) We expect the TAD rig to start working again from 2H20F at a charter rate of US$75k/day. We believe a potential client is Lam Son JOC, operating in the deep-water Thang Long Dong Do oilfield. 4) We expect PVD to recover c.VND90bn of bad debt from PetroVietnam Exploration Production Corporation (PVEP, Not listed) in FY19F. 5) We expect well services and trading segments’ revenue and gross profit in FY18-21F to remain at FY18 levels. Figure 13: Charter rate and utilisation rate of PVD’s jack-up fleet, based on our estimates Figure 14: Charter rate and utilisation rate of PVD’s TAD rig, based on our estimates SOURCES: VND RESEARCH’S ESTIMATES SOURCES: VND RESEARCH’S ESTIMATES We forecast the jack-up charter rate to increase from US$55k/day to c.US$70k/day in FY18-21F. Meanwhile, we expect the TAD rig to start working again from 2H20F at a charter rate of US$75k/day.
  • 17. Oil & Gas Exp & Prodn │ Vietnam PetroVietnam Drilling & Well Services JSC │ March 27, 2019 17 Figure 15: PVD’s revenue (VND tr), based on our estimates Figure 16: PVD’s adjusted gross profit (VND tr) , based on our estimates SOURCES: VND RESEARCH, COMPANY REPORTS SOURCES: VND RESEARCH, COMPANY REPORTS Overall, we project PVD’s PATMI to grow at a CAGR of 47.6% in FY18- 21F. Figure 17: PVD’s net profit (VND bn), based on our estimates SOURCES: VND RESEARCH, COMPANY REPORTS SWOT ANALYSIS Figure 18: SWOT analysis SOURCES: VND RESEARCH , VALUATION AND RECOMMENDATION Initiate coverage with Add and target price of VND20,000 We initiate coverage on PVD with a Add rating and target price of VND20,000, based on a combination of DCF (weight 50%) and FY19-21F target P/BV multiple of 0.6x (weight 50%). Our DCF valuation of VND18,593 is based on terminal growth of 1.2% and weighted average cost of capital (WACC) of 19.7%. We estimate PVD’s WACC at 19.7% assuming: 1) a risk-free rate of 5.4%, 2) beta of 1.8 and 3) equity risk premium of 11%. Strengths Weaknesses 1. The sole commercial offshore drilling contractor in Vietnam with strong support from the government 1. The TAD rig remains in idle and incurs high maintenance expenses. This rig is only suitable for deep-water environment, hence making it more difficult for PVD to get it back to work. 2. Young rig fleet with average age of 8 years, compared to global average of 20 years. 2. The company has not had much experience in operating abroad. 3. High barriers to entry, as offshore drilling is a capital intensive market and highly regulated by the government Opportunities Threats 1. We expect the demand for offshore drilling to recover in the medium term as the need for more oil and gas discoveries becomes increasingly pressing. 1. Brent crude oil price falls below US$60/bbl due to another technology revolution from shale oil. Low oil price will exert downward pressure on the contract prices of oilfield services in general. 2. We expect the Brent crude oil price to remain above US$60/bbl in the medium term, supporting the recovery in contract prices for oilfield services companies. 2. The TAD rig fails to return to work after FY19F. The longer the rig is cold-stacked, the higher the reactivation cost for PVD We forecast PVD to pose revenue CAGR of 11.6% and gross profit CAGR of 54.2% over FY18-21F, driven by a strong rebound in the drilling segment.
  • 18. Oil & Gas Exp & Prodn │ Vietnam PetroVietnam Drilling & Well Services JSC │ March 27, 2019 18 Meanwhile, our target FY19-21F P/BV multiple of 0.6x is deduced from the average TTM P/BV multiple of global peers of 0.4x. We believe PVD deserves to trade at a higher P/BV multiple than its global peers, thanks to its younger rig fleet. In addition, we expect the looming rebound in the oilfield service markets to improve the average P/BV multiples of drilling contractors in the medium term. Figure 19: DCF model – Summary of free cash flow (FCF) SOURCES: VND RESEARCH ESTIMATES, COMPANY REPORTS Figure 20: Cost of equity Figure 21: WACC and terminal growth SOURCES: VND RESEARCH, COMPANY REPORTS SOURCES: VND RESEARCH, COMPANY REPORTS Our target price of VND20,000 is based on a combination of DCF (weight 50%) and FY19-21F target P/BV multiple of 0.6x (weight 50%). Figure 22: Blended target price SOURCES: VND RESEARCH ESTIMATES, COMPANY REPORTS Figure 23: Global offshore drilling sector comparison Note: Not Rated forecasts based on Bloomberg consensus estimates; trailing 12 months (TTM SOURCES: VND RESEARCH, COMPANY REPORTS, BLOOMBERG (AS AT 26 MAR 2019) VNDbn Dec-16A Dec-17A Dec-18E Dec-19F Dec-20F Dec-25F Dec-30F Dec-35F CAGR 20-35F Total revenue 5,360 3,891 5,503 5,880 6,843 10,787 14,064 15,513 5.6% % yoy 0.0% -27.4% 41.4% 6.8% 16.4% 10.0% 3.7% 1.2% COGS & OPEX (5,199) (4,286) (5,416) (5,599) (6,578) (9,492) (12,376) (13,651) Unlevered profit / EBIT 161 (396) 87 281 264 1,294 1,688 1,862 13.9% Operating margin 3.0% -10.2% 1.6% 4.8% 3.9% 12.0% 12.0% 12.0% Effective tax rate 30.8% 76.4% 27.2% 25.0% 25.0% 25.0% 25.0% 25.0% EBIT * (1-Tax) or NOPAT 111 (93) 63 211 198 971 1,266 1,396 13.9% + Depreciation and amortisation 728 788 608 332 453 793 1,034 1,141 % of revenue 13.6% 20.3% 11.1% 5.6% 6.6% 7.4% 7.4% 7.4% - Capex (235) (44) (79) (258) (411) (539) (703) (776) % of revenue -4.4% -1.1% -1.4% -4.4% -6.0% -5.0% -5.0% -5.0% + Change in working capital 277 35 5 102 65 272 355 621 % of revenue 5.2% 0.9% 0.1% 1.7% 0.9% 2.5% 2.5% 4.0% Interest and other financial activities, net 107 547 137 128 148 268 350 386 % of revenue 2.0% 14.1% 2.5% 2.2% 2.2% 2.5% 2.5% 2.5% Unlevered free cash flow (UFCF) 988,337 1,231,987 735,692 514,947 453,501 1,764,420 2,301,846 2,767,501 % yoy 0.0% 24.7% -40.3% -30.0% -11.9% 24.0% 4.2% 1.2% Cost of equity Risk Free Rate 5.4% Beta 1.80 Risk Premium 11.0% Cost of Equity 25.2% VNDbn Equity Value 9,582 Debt 3,330 Cost of Debt 5.0% Tax Rate 25.0% WACC 19.7% Perpetual Growth Rate 1.2% Method Implied share price (VND) Weight (%) Weighted share price (VND) DCF 18,593 50% 9,297 FY19-21F target P/BV of 0.6x 21,478 50% 10,739 Blended price 100% 20,036 Target price 20,000 3-year EPS 5-yr TTM CY19F CY20F CAGR (%) 5-yr TTM CY19F CY20F 5-yr TTM CY19F 5-yr TTM CY19F Offshore drilling companies PV Drilling PVD VN ADD 17,550 20,000 290 16.2 38.0 20.3 20.1 -66.4% 1.1 0.6 0.5 0.5 14.8% 1.4% 2.6% 6.3% 1.1% 1.3% Velesto Energy Bhd VEB MK ADD 0.28 0.28 465 26.5 411.0 52.7 51.3 N/A 1.7 0.7 0.7 0.7 -16.2% 0.2% 1.3% -6.1% 1.2% 1.8% Sapura Energy Bhd SAPE MK ADD 0.34 0.57 511 34.6 N/A N/A N/A N/A 1.1 0.2 0.4 0.4 -0.2% -2.8% -4.8% 0.2% 1.6% 0.9% Ensco OXHI LN NOT RATED 4.42 N/A 1,846 10.7 N/A N/A N/A N/A 0.5 0.2 N/A N/A -11.6% -7.6% N/A -6.6% -4.5% N/A Transocean RIGN SW NOT RATED 9.42 N/A 102,200 6.2 N/A N/A N/A N/A 0.4 0.4 N/A N/A -7.7% -15.5% N/A -4.2% -8.3% N/A Rowan Companies RDC LN NOT RATED 12.11 N/A 1,473 13.5 N/A N/A N/A N/A 0.5 0.3 N/A N/A 0.2% -6.7% N/A 0.0% -4.2% N/A Average - Offshore drilling peers 17,797 18.0 224.5 -66.4% 0.9 0.4 -3.5% -5.2% -1.7% -2.2% P/E (x) P/BV (x) ROE (%) ROA (%) Company Bloomberg Ticker Recom. Share Price (local curr) Target Price (local curr) Market Cap (US$ m)
  • 19. Oil & Gas Exp & Prodn │ Vietnam PetroVietnam Drilling & Well Services JSC │ March 27, 2019 19 Figure 24: Brief description of global comparable companies SOURCES: VND RESEARCH, COMPANY REPORTS RISKS AND CATALYSTS Downside risks  Brent crude oil price falls below US$60/bbl due to another technology revolution from shale oil. Low oil price will exert downward pressure on the contract prices of oilfield services in general.  The TAD rig fails to return to work after FY19F. This rig is currently being cold-stacked and incurs high maintenance expense of c.US$11k/day. We note that the longer the rig is cold-stacked, the higher the reactivation cost for PVD.  Strong correction in global equity market can put downward pressure on the share price of PVD, which is quite volatile and has a high correlation with the overall movement of Vietnam’s stock market. Potential re-rating catalysts  The charter rates of jack-up fleet are higher than expected thanks to stronger improvements in rig demand and market utilisation.  Ca Rong Do project returns from suspension. We believe this project could provide large and highly-profitable drilling contracts for the currently cold- stacked TAD rig.
  • 20. Oil & Gas Exp & Prodn │ Vietnam PetroVietnam Drilling & Well Services JSC │ March 27, 2019 20 APPENDICES Figure 25: Company background of PV Drilling SOURCES: VND RESEARCH, COMPANY REPORTS Figure 26: Organisation structure of PVD SOURCES: VND RESEARCH, COMPANY REPORTS
  • 21. Oil & Gas Exp & Prodn │ Vietnam PetroVietnam Drilling & Well Services JSC │ March 27, 2019 21 Figure 27: Profile of PV Drilling’s key management executives SOURCES: VND RESEARCH, COMPANY REPORTS
  • 22. Oil & Gas Exp & Prodn │ Vietnam PetroVietnam Drilling & Well Services JSC │ March 27, 2019 22 BY THE NUMBERS SOURCES: VND RESEARCH, COMPANY REPORTS 0.11% 0.61% 1.11% 1.61% 2.11% 2.61% 3.11% 0.300 0.400 0.500 0.600 0.700 0.800 0.900 Jan-15AJan-16AJan-17AJan-18AJan-19F Jan-20F P/BV vs ROE Rolling P/BV (x) (lhs) ROE (rhs) -110% -65% -20% 25% 70% 115% 160% 205% 250% 295% 340% 0 20 40 60 80 100 120 140 160 180 200 Jan-15A Jan-16A Jan-17A Jan-18A Jan-19F Jan-20F 12-mth Fwd FD Core P/E vs FD Core EPS Growth 12-mth Fwd Rolling FD Core P/E (x) (lhs) FD Core EPS Growth (rhs) Profit & Loss (VNDb) Dec-17A Dec-18A Dec-19F Dec-20F Dec-21F Total Net Revenues 3,891 5,503 5,880 6,843 7,652 Gross Profit 192 395 610 1,101 1,447 Operating EBITDA 393 696 613 718 1,074 Depreciation And Amortisation -788 -608 -332 -453 -563 Operating EBIT -396 87 281 264 511 Financial Income/(Expense) -81 -67 57 61 83 Pretax Income/(Loss) from Assoc. 5 64 65 76 95 Non-Operating Income/(Expense) 623 140 6 11 12 Profit Before Tax (pre-EI) 151 225 409 412 701 Exceptional Items Pre-tax Profit 151 225 409 412 701 Taxation -115 -61 -102 -103 -175 Exceptional Income - post-tax Profit After Tax 36 163 307 309 526 Minority Interests 10 24 46 46 79 Preferred Dividends FX Gain/(Loss) - post tax Other Adjustments - post-tax Net Profit 45 188 353 356 605 Recurring Net Profit 45 188 353 356 605 Fully Diluted Recurring Net Profit 45 188 353 356 605 Cash Flow (VNDb) Dec-17A Dec-18A Dec-19F Dec-20F Dec-21F EBITDA 392.6 695.6 612.6 717.5 1,073.7 Cash Flow from Invt. & Assoc. (143.4) (148.9) (148.9) (148.9) (148.9) Change In Working Capital 34.6 5.1 102.5 64.5 445.0 (Incr)/Decr in Total Provisions 41.0 (110.2) 0.0 0.0 0.0 Other Non-Cash (Income)/Expense (241.6) (471.1) (203.6) (305.2) (372.6) Other Operating Cashflow 312.6 531.4 494.8 606.3 701.4 Net Interest (Paid)/Received (196.9) (177.1) (237.3) (226.0) (207.8) Tax Paid (84.2) (142.9) (102.3) (103.1) (175.3) Cashflow From Operations 114.6 181.9 517.9 605.2 1,315.6 Capex (44.3) (78.7) (258.1) (410.6) (382.6) Disposals Of FAs/subsidiaries 0.3 0.6 0.0 0.0 0.0 Acq. Of Subsidiaries/investments Other Investing Cashflow (311.7) 1,203.7 0.0 0.0 0.0 Cash Flow From Investing (355.7) 1,125.7 (258.1) (410.6) (382.6) Debt Raised/(repaid) (752.0) 41.0 (268.6) (170.9) 138.8 Proceeds From Issue Of Shares Shares Repurchased Dividends Paid (1.4) 0.0 0.0 0.0 0.0 Preferred Dividends Other Financing Cashflow 0.0 (969.5) 0.0 0.0 0.0 Cash Flow From Financing (753.4) (928.5) (268.6) (170.9) 138.8 Total Cash Generated (994.5) 379.1 (8.8) 23.8 1,071.8 Free Cashflow To Equity (993.1) 1,348.6 (8.8) 23.8 1,071.8 Free Cashflow To Firm (44.2) 1,484.7 497.1 420.7 1,140.7
  • 23. Oil & Gas Exp & Prodn │ Vietnam PetroVietnam Drilling & Well Services JSC │ March 27, 2019 23 BY THE NUMBERS… cont’d SOURCES: VND RESEARCH, COMPANY REPORTS Balance Sheet (VNDb) Dec-17A Dec-18A Dec-19F Dec-20F Dec-21F Total Cash And Equivalents 3,952 3,277 3,217 3,193 4,219 Total Debtors 1,552 1,613 1,724 2,006 2,243 Inventories 754 755 759 827 894 Total Other Current Assets 26 26 28 33 37 Total Current Assets 6,284 5,671 5,729 6,060 7,394 Fixed Assets 14,821 14,462 14,389 14,346 14,166 Total Investments 578 695 695 695 695 Intangible Assets 0 0 0 0 0 Total Other Non-Current Assets 134 173 173 173 173 Total Non-current Assets 15,533 15,331 15,257 15,215 15,035 Short-term Debt 1,343 362 337 321 708 Current Portion of Long-Term Debt Total Creditors 896 992 1,140 1,326 1,483 Other Current Liabilities 1,667 1,423 1,520 1,769 1,978 Total Current Liabilities 3,905 2,777 2,997 3,416 4,169 Total Long-term Debt 3,330 3,477 3,234 3,079 2,831 Hybrid Debt - Debt Component Total Other Non-Current Liabilities 1,110 907 907 907 907 Total Non-current Liabilities 4,439 4,384 4,141 3,986 3,738 Total Provisions 0 0 0 0 0 Total Liabilities 8,345 7,162 7,138 7,402 7,907 Shareholders' Equity 13,208 13,583 13,545 13,522 14,092 Minority Interests 265 258 304 350 429 Total Equity 13,473 13,841 13,848 13,872 14,521 Key Ratios Dec-17A Dec-18A Dec-19F Dec-20F Dec-21F Revenue Growth (27.4%) 41.4% 6.8% 16.4% 11.8% Operating EBITDA Growth (55.8%) 77.2% (11.9%) 17.1% 49.6% Operating EBITDA Margin 10.1% 12.6% 10.4% 10.5% 14.0% Net Cash Per Share (VND) -1,880 -1,469 -923 -540 1,776 BVPS (VND) 34,463 35,440 35,341 35,281 36,769 Gross Interest Cover -2.05 0.51 1.79 1.77 3.73 Effective Tax Rate 76.4% 27.2% 25.0% 25.0% 25.0% Net Dividend Payout Ratio 3.08% NA NA NA NA Accounts Receivables Days 144.4 105.0 103.6 99.8 101.3 Inventory Days 76.43 53.91 52.43 50.58 50.63 Accounts Payables Days 69.74 58.57 71.71 76.42 80.34 ROIC (%) (2.03%) 0.47% 1.54% 1.47% 2.86% ROCE (%) (1.07%) 1.55% 3.28% 3.18% 4.54% Return On Average Assets 0.45% 1.01% 1.25% 1.23% 2.10% Key Drivers Dec-17A Dec-18A Dec-19F Dec-20F Dec-21F Oil Price (US$/bbl) 54.0 72.0 65.0 68.0 70.0 Volume Growth (%) -4.6% -0.5% -0.8% 0.4% -0.2% Ratio Of Up To Downstream (x) N/A N/A N/A N/A N/A Operating Cash Cost (US$/bbl) N/A N/A N/A N/A N/A Ratio Of High To Low Margin (x) N/A N/A N/A N/A N/A
  • 24. Company Note Oil & Gas Exp & Prodn │ Vietnam │ March 27, 2019 Shariah Compliant IMPORTANT DISCLOSURES, INCLUDING ANY REQUIRED RESEARCH CERTIFICATIONS, ARE PROVIDED AT THE END OF THIS REPORT. IF THIS REPORT IS DISTRIBUTED IN THE UNITED STATES IT IS DISTRIBUTED BY CIMB SECURITIES (USA), INC. AND IS CONSIDERED THIRD-PARTY AFFILIATED RESEARCH. Powered by the EFA Platform Insert Insert PetroVietnam Gas JSC Challenging times ahead ■ We expect a flat oil price outlook to weigh on PetroVietnam Gas’s (GAS) sales growth. We forecast EPS to decrease by 7.8% p.a in FY18-21F. ■ Depleting gas supply to put pressure on input costs, while demand growth and capacity expansion should partly offset rising costs. ■ Initiate coverage with a Hold rating and target price of VND91,600. Flat oil price outlook could weigh on sales growth In 2019-21F, we expect Bloomberg consensus forecasts for Brent crude oil to be US$62- US$65/bbl, down 10.1% from the estimated level in FY18. In our view, despite the recent robust recovery, Brent crude oil price is unlikely to return to the pre-2014 level of c.US$100/bbl. Given the flat crude oil price outlook, coupled with unchanged sales volume, we expect GAS’s revenue to increase by a CAGR of 5.1% over FY18-21F. Depleting gas supply puts pressure on input costs The dry gas segment has been instrumental to GAS’s profitability, contributing 50-55% of its total annual gross profit in FY15-18. While we believe the selling price of this segment has little upside due to the flat oil price outlook, the input price for this segment is also facing upward pressure due to the quick depletion of the cheap domestic gas supply. We forecast the dry gas segment’s COGS to increase by a CAGR of 9.9% in FY18-21F. Demand and capacity expansion to partly offset rising costs According to Wood Mackenzie, the demand for dry gas in Vietnam is poised to increase twofold over 2020-35F due to the expected construction of several new gas-fired power plants, such as Nhon Trach 3 – 4 and O Mon 3 – 4. We expect the combination of higher dry gas demand and larger transportation capacity to increase GAS’s transportation revenue by c.85% over 2020-25F, and partially offset the potential loss in gross profit for the dry gas segment. We forecast EPS to decrease by 7.8% p.a. in FY18-21F In FY18E, GAS posted EPS growth of 26.4% yoy, mainly due to a strong recovery in Brent crude oil price (+27.7% yoy). However, for FY18-21F, we forecast GAS’s EPS to decrease by 7.8% p.a. due to the flat oil price outlook and rising input costs. Initiate coverage with a Hold and target price of VND91,600 We initiate coverage on GAS with a Hold rating and target price of VND91,600, based on an equal weighting of DCF and target FY19-21F P/E multiple of 18.0x. Key downside risks include: 1) faster-than-expected depletion of cheap gas supply and 2) sharp fall in crude oil price. Meanwhile, key upside catalysts are: 1) higher oil price due to geopolitical disputes, and 2) gas fields under development, such as Blue Whale and Block B – O Mon, starting operations sooner than expected. SOURCES: VND RESEARCH, COMPANY REPORTS Vietnam HOLD (previously NOT RATED) Consensus ratings*: Buy 4 Hold 2 Sell 0 Current price: VND97,200 Target price: VND91,600 Previous target: N/A Up/downside: -5.81% CGS-CIMB / Consensus: -7.8% Reuters: GAS.HM Bloomberg: GAS VN Market cap: US$8,019m VND186,035,936m Average daily turnover: US$2.02m VND46,621m Current shares o/s: 1,914m Free float: 4.2% *Source: Bloomberg Key changes in this note N/A Source: Bloomberg Price performance 1M 3M 12M Absolute (%) -1.3 12.4 -23.4 Relative (%) 0.2 4.1 -6.7 Major shareholders % held PetroVietnam Group 95.8 Others 4.2 Insert Analyst(s) Linh VU Viet T (84) 38 955 2199 E linh.vuviet@vndirect.com.vn Mai PHAM T (84) 94 328 0850 E mai.phamle@vndirect.com.vn Financial Summary Dec-17A Dec-18A Dec-19F Dec-20F Dec-21F Revenue (VNDb) 64,570 75,627 74,677 80,631 87,774 Operating EBITDA (VNDb) 14,219 17,212 15,797 15,877 17,978 Net Profit (VNDb) 9,577 12,102 10,313 9,555 9,500 Core EPS (VND) 5,004 6,323 5,388 4,992 4,963 Core EPS Growth 36.6% 26.4% (14.8%) (7.4%) (0.6%) FD Core P/E (x) 19.43 15.37 18.04 19.47 19.58 DPS (VND) 3,796 4,110 4,126 4,179 4,155 Dividend Yield 3.90% 4.23% 4.24% 4.30% 4.27% EV/EBITDA (x) 11.93 9.55 10.63 11.01 10.52 P/FCFE (x) 14.4 182.8 16.4 24.1 20.9 Net Gearing (41.7%) (49.3%) (43.2%) (29.3%) 4.9% P/BV (x) 4.48 4.07 4.25 4.50 4.71 ROE 23.8% 27.8% 23.1% 22.4% 23.5% % Change In Core EPS Estimates CIMB/consensus EPS (x) 0.91 0.78 0.75 78.0 88.0 98.0 108.0 118.0 67,000 87,000 107,000 127,000 147,000 Price Close Relative to VNINDEX (RHS) 1 1 2 2 Mar-18 Jun-18 Sep-18 Dec-18 Volm
  • 25. Oil & Gas Exp & Prodn │ Vietnam PetroVietnam Gas JSC │ March 27, 2019 25 Challenging times ahead INVESTMENT THESIS Flat oil price outlook could weigh on sales growth The principal activities of PetroVietnam Gas (GAS) are: 1) to collect and distribute dry gas, and 2) to produce and distribute liquid petroleum gas (LPG). The company also participates in producing and distributing other gas products such as condensate and compressed natural gas (CNG). Most of GAS’s dry gas sales volume (c.60% of volume to gas-fired power plants and c.10% of volume to fertiliser producers) have their selling prices directly linked to the movement of global crude oil prices. The general formula is: 46% x Singapore fuel oil price + transportation tariff (source: PetroVietnam). The rest of GAS’s sales volume is regulated by the government with fixed selling prices, adjusted annually by c.2% for inflation. Meanwhile, the selling prices of LPG are directly linked with global LPG prices. GAS often uses Saudi Aramco’s (SARC, Unlisted) LPG prices as its benchmark. Figure 1: GAS’s revenue structure by segment SOURCES: VND RESEARCH, COMPANY REPORTS Figure 2: GAS’s sales volume of dry gas to end users (mcm) Figure 3: GAS’s LPG sales volume by source (k tonnes) SOURCES: VND RESEARCH, COMPANY REPORTS SOURCES: VND RESEARCH, COMPANY REPORTS We forecast GAS’s revenue to increase by a CAGR of 5.1% over FY18-21F due to the flat crude oil price outlook and unchanged sales volume. For 2019-21F, we observe that Bloomberg consensus forecasts for Brent crude oil price of US$62-US$65/bbl are down 10.1% from the estimated level in 2018. The majority of GAS’s dry gas volume is distributed to gas-fired power plants. Meanwhile, GAS only produces c.40% of total LPG volume in-house from its two gas processing plants (GPP) Ca Mau and Dinh Co in 2018. The majority of its LPG volume is distributed for residential and industrial usage.
  • 26. Oil & Gas Exp & Prodn │ Vietnam PetroVietnam Gas JSC │ March 27, 2019 26 In our view, despite the recent robust recovery, the crude oil price is unlikely to return to the pre-2014 level of c.US$100/bbl. We believe the revolution of US shale oil has permanently changed the global supply curve and we see long- term sustainable crude oil price in the range of US$60-US$70/bbl. - The selling price for electricity - Take or Pay (TOP) volume was c.US$4.1/mmbtu in 2018, with annual increase of c.2% for inflation effect. - The selling price for: 1) electricity – above TOP, and 2) Phu My fertiliser (DPM) is based on the formula: 46% x Singapore fuel oil price + transportation tariff. - The selling price for industrial usage is negotiated annually and generally aligns with the trend of Singapore fuel oil price. - GAS only collects transportation tariff for the dry gas volume distributed to Ca Mau fertilizer (DCM). - The selling price of LPG is directly linked to global LPG price. Figure 4: GAS’s selling prices for dry gas and LPG (US$/mmbtu) SOURCES: VND RESEARCH, COMPANY REPORTS, BLOOMBERG Figure 5: GAS’s dry gas sales volume by end user, based on our estimates (mcm) Figure 6: GAS’s LPG sales volume by source, based on our estimates (k tonnes) SOURCES: VND RESEARCH ESTIMATES, COMPANY REPORTS SOURCES: VND RESEARCH ESTIMATES, COMPANY REPORTS …combined with a flat crude oil price outlook, we expect GAS’s revenue to increase by a CAGR of 5.1% during FY18-21F. Figure 7: GAS’s revenue based on our estimates (VND tr) With largely unchanged sales volume...
  • 27. Oil & Gas Exp & Prodn │ Vietnam PetroVietnam Gas JSC │ March 27, 2019 27 SOURCES: VND RESEARCH ESTIMATES, COMPANY REPORTS Depleting gas supply puts pressure on input costs The dry gas segment has been instrumental to GAS’s profitability, contributing 50-55% of its total annual gross profit in FY15-18. While we believe the selling price of this segment has little upside due to the flat oil price outlook (as we mentioned earlier), the input price of this segment is facing upward pressure due to a quick depletion of cheap domestic gas supply. We forecast the dry gas segment’s COGS to increase by a CAGR of 9.9% in FY18-21F. Figure 8: GAS’s gross profit structure by segment SOURCES: VND RESEARCH, COMPANY REPORTS Figure 9: Supply of domestic dry gas (mcm) SOURCES: VND RESEARCH, VIETNAM PETROLEUM INSTITUTE Figure 10: Cost of sales and gross profit of dry gas segment (VND tr) SOURCES: VND RESEARCH ESTIMATES, COMPANY REPORTS
  • 28. Oil & Gas Exp & Prodn │ Vietnam PetroVietnam Gas JSC │ March 27, 2019 28 Demand and capacity expansion to partly offset rising costs According to Wood Mackenzie, the demand for dry gas in Vietnam is poised to increase twofold over 2020-35F due to the expected construction of several new gas-fired power plants, such as Nhon Trach 3 – 4 and O Mon 3 – 4. With Vietnam’s electricity demand expected to increase three-fold to 500bn kWh in 2030F, according to Vietnam Electricity Group, the development of these new gas-fired power plants is critical to ensure sufficient future supply. Figure 11: Vietnam’s dry gas demand (2005-35F (bcm) SOURCES: VND RESEARCH, WOOD MACKENZIE Figure 12: Plans for gas-fired power plants under the Power Development Plan VII Figure 13: Installed capacity of gas-fired power plants (k MW) SOURCES: MINISTRY OF INDUSTRY AND TRADE SOURCES: VIETNAM PETROLEUM INSTITUE We believe the increase in demand will benefit GAS’s transportation business as it remains the sole wholesale gas distributor in Vietnam. By the end of 2018, GAS had started construction on several new pipeline systems that will enable it to transport gas from fields under development, such as Sao Vang Dai Nguyet and Block B – O Mon. We expect GAS’s piped transportation capacity to more than double by 2023F. Meanwhile, from 2025F, as Vietnam will need to import LNG to meet the expected increase in electricity demand, GAS also plans to construct three new terminals to import LNG from overseas. We expect the combination of higher demand for dry gas and larger transportation capacity to increase GAS’s transportation gross profit by c.85% over 2020-25F, which should partially offset the potential loss in gross profit in the dry gas segment. Power plants Capacity (MW) Target start-up year Nhon Trach 3 750 2022 Nhon Trach 4 750 2022 Son My 2.1 750 2023 Son My 2,2 750 2024 Son My 2.3 750 2025 Son My 1.1 750 2026 Son My 1,2 750 2027 Son My 1,3 750 2028 O Mon 3 750 2020 O Mon 4 750 2021 O Mon 2 750 2026 Kien Giang 1 750 2021 Kien Giang 2 750 2022 Mien Trung 1 750 2023 Dung Quat 1 750 2023 Mien Trung 2 750 2024 Dung Quat 2 750 2024 Quang Tri 1 600 2025 Mien Trung 3 750 2026 Total in plan 14,100 .
  • 29. Oil & Gas Exp & Prodn │ Vietnam PetroVietnam Gas JSC │ March 27, 2019 29 GAS has started to build several new pipeline systems and LNG terminals to prepare themselves for much higher dry gas demand in the future. Figure 14: New pipeline and LNG terminals, according to GAS’s guidance SOURCES: VND RESEARCH, COMPANY REPORTS We see GAS’s piped transportation capacity to increase more than twofold over 2019-23F. Figure 15: GAS’s pipeline transportation capacity (bcm/year) SOURCES: VND RESEARCH, COMPANY REPORTS We expect the combination of higher dry gas demand and larger transportation capacity to increase GAS’s transportation gross profit by c.85% over 2020-25F, and partially offset the potential loss in gross profit in the dry gas segment. Figure 16: GAS’s transportation revenue and gross profit, based on our estimates (VND tr) SOURCES: VND RESEARCH ESTIMATES, COMPANY REPORTS We forecast EPS to decrease by 7.8% p.a. in FY18-21F In FY18E, GAS posted robust EPS growth of 26.4% yoy, mainly due to a strong recovery in crude oil price (+27.7% yoy). However, over the FY18-21F period, we forecast GAS’s EPS to decrease by 7.8% p.a. due to the flat oil price outlook and rising input costs. Project name Current status Capex. (US$m) Capacity (mcm/yr) Year of operation Block B pipeline Preparing for construction 1,118 5,600 2023F Nam Con Son phase 2 Under construction 946 7,000 2021F Su Tu Trang pipeline Preparing for construction 160 2,000 2020F Sao Vang Dai Nguyet pipeline Under feasibity study 150 3,000 2021F Thi Vai LNG terminal Preparing for construction 620 1,370 2022F Son My LNG terminal Under feasibity study 1,350 4,110 2023F
  • 30. Oil & Gas Exp & Prodn │ Vietnam PetroVietnam Gas JSC │ March 27, 2019 30 Figure 17: GAS’s revenue by segment, based on our estimates (VND tr) Figure 18: GAS’s gross profit by segment, based on our estimates (VND tr) SOURCES: VND RESEARCH ESTIMATES, COMPANY REPORTS SOURCES: VND RESEARCH ESTIMATES, COMPANY REPORTS In FY18-21F, we forecast GAS’s EPS to decline by 7.8% p.a. due to the flat oil price outlook and rising input costs. Figure 19: GAS’s net profit, based on our estimates (VND tr) SOURCES: VND RESEARCH ESTIMATES, COMPANY REPORTS SWOT ANALYSIS Figure 20: SWOT analysis SOURCES: VND RESEARCH, BORR DRILLING Strengths Weaknesses 1. State-owned corporation with absolute monopoly in Vietnam’s gas infrastructure and wholesale distribution of dry gas. 1. Pricing policy is highly influenced by the government. 2. GAS also controls nearly 70% of the domestic market for liquefied petroleum gas and boasts extensive distribution network throughout the country. 2. Low-cost dry gas supply is quickly depleting, leading to upwards pressure in input cost. 3. GAS is one of the largest publicly traded Vietnamese companies and also actively pursuing collaboration with foreign partners. Opportunities Threats 1. Demand for dry gas in Vietnam is expected to increase significantly in 2018-2025F period. 1. Delays in the construction of the new pipeline and LNG terminals could prevent GAS from expanding its transportation capacity. 2. Potential participation in upstream dry gas production can lead to more diversified profit streams in the future. 2. Sharp fall in crude oil price would depress GAS’s selling prices for dry gas to key end users. While we expect the dry gas segment to remain a significant revenue contributor, we project its gross profit contribution to decline.
  • 31. Oil & Gas Exp & Prodn │ Vietnam PetroVietnam Gas JSC │ March 27, 2019 31 VALUATION AND RECOMMENDATION Initiate coverage with a Hold and TP of VND91,600 We initiate coverage on GAS with a Hold rating and target price of VND91,600, based on a combination of DCF (weight 50%) and FY19-21F target P/E multiple of 18.0x (weight 50%). Our DCF valuation of VND91,272 is based on terminal growth of 1.2% and weighted average cost of capital (WACC) of 19.9%. We estimate GAS’s WACC at 17.7% assuming: 1) a risk-free rate of 5.0%, 2) beta of 1.2 and 3) equity risk premium of 11%. Our FY19-21F target P/E multiple of 18.0x is deduced from the regional sector P/E median of 18.0x. Using a 3-year average forward FY19-21F EPS of VND5,080, we derive our P/E-based valuation of VND92,063. Figure 21: DCF model – Summary of free cash flow SOURCES: VND RESEARCH ESTIMATES, COMPANY REPORTS Figure 22: WACC and terminal growth Figure 23: Cost of equity SOURCES: VND RESEARCH, COMPANY REPORTS SOURCES: VND RESEARCH, COMPANY REPORTS Our target price for GAS is VND91,600, based on a combination of DCF (weight 50%) and target FY19- 21F P/E multiple of 18.0x (weight 50%). Figure 24: Blended target price SOURCES: VND RESEARCH ESTIMATES, COMPANY REPORTS VNDbn Dec-16A Dec-17A Dec-18F Dec-19F Dec-20F Dec-25F Dec-30F Dec-35F CAGR 20-35 Total revenue 59,145 64,570 75,627 74,677 80,631 145,986 174,934 194,811 6.1% % growth y-o-y 0.0% 9.2% 17.1% -1.3% 8.0% 5.0% 3.0% 1.7% COGS & OPEX (50,667) (53,065) (61,091) (62,597) (69,129) (130,658) (156,566) (174,356) Unlevered profit / EBIT 8,478 11,505 14,537 12,080 11,503 15,329 18,368 20,455 3.9% Operating margin 14.3% 17.8% 19.2% 16.2% 14.3% 10.5% 10.5% 10.5% Effective tax rate -21.8% -21.0% -19.5% -20.9% -20.9% -20.9% -20.9% -20.9% EBIT * (1-Tax) or NOPAT 10,325 13,925 17,376 14,601 13,903 18,528 22,201 24,724 3.9% + D&A 3,309 2,713 2,676 3,716 4,374 8,702 10,561 11,755 % of revenue 5.6% 4.2% 3.5% 5.0% 5.4% 6.0% 6.0% 6.0% - CapEx (3,230) (2,180) (714) (5,974) (8,063) (2,920) (3,499) (3,896) % of revenue -5.5% -3.4% -0.9% -8.0% -10.0% -2.0% -2.0% -2.0% + ∆ WC (310) (302) (446) (267) (383) (825) (1,015) (1,130) % of revenue -0.5% -0.5% -0.6% -0.4% -0.5% -0.6% -0.6% -0.6% Interest and other financial activities, net 692 960 818 1,225 825 1,171 1,311 1,463 % of revenue 1.2% 1.5% 1.1% 1.6% 1.0% 0.8% 0.7% 0.8% UFCF 10,785,962 15,117,104 19,709,274 13,301,725 10,655,555 24,656,091 29,559,354 32,916,180 % growth y-o-y 0.0% 40.2% 30.4% -32.5% -19.9% 4.8% 3.0% 1.7% VNDbn Equity Value 239,244 Debt 9,050 Cost of Debt 4.2% Tax Rate 20.0% WACC 17.7% Perpetual Growth Rate 1.7% Cost of equity Risk Free Rate 5.0% Beta 1.20 Risk Premium 11.0% Cost of Equity 18.2% Method Implied share price (VND) Weight (%) Weighted share price (VND) DCF 91,272 50% 45,636 FY19-21F targetP/E of18x 92,063 50% 46,032 Blended value 91,668 Target price 91,600
  • 32. Oil & Gas Exp & Prodn │ Vietnam PetroVietnam Gas JSC │ March 27, 2019 32 GAS’s 5-year average forward P/E and P/BV are 15.0x and 3.5x, respectively. Figure 25: GAS’s historical P/E and P/BV SOURCES: VND RESEARCH, COMPANY REPORTS, BLOOMBERG Figure 26: Global gas distribution peer comparison Note: Not Rated forecasts based on Bloomberg consensus estimates; trailing 12 months (TTM) SOURCES: VND RESEARCH, BLOOOMBERG (AS AT 26 MAR 2019) Figure 27: Brief description of global comparable companies SOURCES: VND RESEARCH, COMPANY REPORTS RISKS AND CATALYSTS Downside risks ● Delays to key projects such as Block B – O Mon and Blue Whale could push GAS to import LNG sooner than expected and in larger amounts than it 3-year EPS 5-yr TTM CY19F CY20F CAGR (%) 5-yr TTM CY19F CY20F 5-yr TTM CY19F 5-yr TTM CY19F Gas distribution companies PV GAS GAS VN HOLD 97,200 91,600 8,010 13.8 16.4 19.3 20.9 -10.6% 3.5 4.2 4.0 3.8 28.2% 23.6% 20.6% 18.8% 15.7% 15.4% PTT PLC PTT TB HOLD 48.50 53.00 45,088 17.1 10.4 10.9 10.3 -29.0% 1.6 1.6 1.4 1.3 11.3% 7.7% 9.0% 6.6% 4.7% 6.4% Indraprastha Gas IGL IN NOT RATED 301.3 N/A 2,650 17.7 25.4 N/A N/A 28.0% 0.6 0.6 0.6 N/A 3.4% 2.2% N/A 3.5% 4.7% N/A China Gas Holdings 384 HK ADD 28.15 40.00 2,271 18.6 22.1 17.50 14.10 28.7% 3.6 5.3 3.8 2.7 19.5% 24.9% 25.4% 6.8% 10.4% 11.1% Toho Gas Ltd 9533 JP NOT RATED 5,070 N/A 43,500 24.0 30.0 N/A N/A -1.1% 1.5 1.3 N/a N/A 7.7% 4.6% N/A 4.1% 2.8% N/A Titas Gas Trans & Distri TITASGAS BD NOT RATED 36.70 N/A 432 8.6 7.6 N/A N/A -21% 1.3 0.6 N/a N/A 15.9% 6.6% N/A 8.9% 3.6% N/A Petronas Gas Bhd PTG MK HOLD 17.70 18.50 9,217 23.5 18.4 18.0 19.6 -0.9% 3.9 2.8 2.7 2.6 17.3% 15.2% 15.0% 13.2% 10.8% 12.0% Average - Gas distribution peers 15,881 17.6 18.6 -19.9% 2.3 2.3 14.8% 12.1% 8.8% 7.5% Company Bloomberg Ticker Recom. Share Price (local curr) Target Price (local curr) Market Cap (US$ m) P/E (x) P/BV (x) ROE (%) ROA (%)
  • 33. Oil & Gas Exp & Prodn │ Vietnam PetroVietnam Gas JSC │ March 27, 2019 33 otherwise would have. We believe that the LNG import price would be higher than domestic dry gas, further increasing GAS’s input costs. ● Cheap gas supply could be depleted faster than expected and further increase GAS’s input costs. ● Delays in the construction of the new pipeline and LNG terminals could prevent GAS from expanding its transportation capacity. ● Sharp fall in crude oil price would depress GAS’s selling prices for dry gas to key end users. Delays to key projects such as Block B – O Mon and Blue Whale can push GAS into having to import LNG sooner than expected and at larger amounts than it otherwise would have. Note that LNG import price will be higher than that of domestic dry gas, further increasing GAS’s input costs, in our view. Figure 28: Vietnam’s wellhead gas pricing in 2018 (US$/mmbtu) SOURCES: VND RESEARCH, RYSTAD ENERGY LNG import prices can also be highly volatile as they largely track crude oil price movements. If global crude oil price returns to pre-2014 levels, GAS’s input gas cost will come under severe upwards pressure. Figure 29: LNG spot prices (US$/mmbtu) SOURCES: VND RESEARCH, COMPANY REPORTS, BLOOMBERG? Potential re-rating catalysts ● From 2021F, we believe GAS is likely to participate in upstream natural gas production with 25% indirect ownership of the Su Tu Trang well - phase 2. Given that this gas well is still under development and details on pricing have not yet been disclosed by GAS, we have not factored it into our model and consider it an upside catalyst only. In our estimation, if GAS manages to yield a regional average net income of c.US$16/boe from the Su Tu Trang phase 2 project, GAS will have an additional net income of c.VND900bn p.a. until 2035F. ● GAS may be able to pass on the increase in input prices to its end users (mainly gas-fired power plants and fertiliser producers). However, we believe this can only happen if Vietnam significantly increases the current electricity retail price. At the moment, the production cost of gas-fired power plants is highly uncompetitive compared to other electricity sources and much higher than the average electricity retail price in Vietnam. ● Geopolitical disputes could create more disruptions to crude oil supply, driving up oil prices. ● New gas projects such as Blue Whale and Block B – O Mon starting operations sooner than expected, would reduce the need for GAS to import dry gas from overseas.
  • 34. Oil & Gas Exp & Prodn │ Vietnam PetroVietnam Gas JSC │ March 27, 2019 34 GAS is likely to participate in upstream natural gas production with 25% indirect ownership of Su Tu Trang well - phase 2. As this gas well is still under development and details on pricing have not yet been disclosed by PV Gas, we have not factored it into our model and regard it as an upside catalyst only. Figure 30: Overview of Su Tu Trang Phase 2 project (as at 2018) SOURCES: VND RESEARCH, COMPANY REPORTS If GAS manages to yield a regional average net income of c.US$16/boe from the Su Tu Trang phase 2 project, the company would have additional net income of c.VND900bn/annum until 2035F, based on our estimates. Figure 31: Average upstream oil and gas production net income as at 2018 (US$/boe) SOURCES: VND RESEARCH, JADESTONES GAS may be able to pass on the increase in input prices to its end users (mainly gas-fired power plants). However, the production cost of gas- fired power plants is largely uncompetitive compared to other electricity sources and also much higher than the average retail electricity price in Vietnam. Figure 32: Levelised cost of electricity by source in 2017 (US$/MWh) SOURCES: VND RESEARCH, COMPANY REPORTS We believe this can only happen if Vietnam significantly increases the current electricity retail price, which remains the lowest among Southeast Asian countries. Figure 33: Average retail electricity prices by country (US$/MWh) SOURCES: VND RESEARCH, WOOD MACKENZIE
  • 35. Oil & Gas Exp & Prodn │ Vietnam PetroVietnam Gas JSC │ March 27, 2019 35 APPENDIX Figure 34: Company profile of PV GAS as at end-2018 SOURCES: VND RESEARCH, COMPANY REPORTS Figure 35: Organisational structure of PV GAS as at end-2018 SOURCES: VND RESEARCH, COMPANY REPORTS Figure 36: Presence of PV Gas in Vietnam’s natural gas value chain as at end-2018 SOURCES: VND RESEARCH, COMPANY REPORTS
  • 36. Oil & Gas Exp & Prodn │ Vietnam PetroVietnam Gas JSC │ March 27, 2019 36 Figure 37: Profile of PV GAS’s key management executives as at end-2018 SOURCES: VND RESEARCH, COMPANY REPORTS
  • 37. Oil & Gas Exp & Prodn │ Vietnam PetroVietnam Gas JSC │ March 27, 2019 37 BY THE NUMBERS SOURCES: VND RESEARCH, COMPANY REPORTS 16.0% 17.8% 19.5% 21.3% 23.0% 24.8% 26.5% 28.3% 30.0% 2.30 2.80 3.30 3.80 4.30 4.80 5.30 5.80 6.30 Jan-15A Jan-16A Jan-17A Jan-18A Jan-19F Jan-20F P/BV vs ROE Rolling P/BV (x) (lhs) ROE (rhs) -20.0% -11.4% -2.9% 5.7% 14.3% 22.9% 31.4% 40.0% 8.8 10.8 12.8 14.8 16.8 18.8 20.8 22.8 Jan-15AJan-16AJan-17AJan-18A Jan-19F Jan-20F 12-mth Fwd FD Core P/E vs FD Core EPS Growth 12-mth Fwd Rolling FD Core P/E (x) (lhs) FD Core EPS Growth (rhs) Profit & Loss (VNDb) Dec-17A Dec-18A Dec-19F Dec-20F Dec-21F Total Net Revenues 64,570 75,627 74,677 80,631 87,774 Gross Profit 15,036 18,305 15,801 15,520 16,389 Operating EBITDA 14,219 17,212 15,797 15,877 17,978 Depreciation And Amortisation -2,713 -2,676 -3,716 -4,374 -5,962 Operating EBIT 11,505 14,537 12,080 11,503 12,016 Financial Income/(Expense) 844 861 1,077 665 67 Pretax Income/(Loss) from Assoc. -3 -4 -3 -4 -4 Non-Operating Income/(Expense) 119 -40 151 163 177 Profit Before Tax (pre-EI) 12,465 15,355 13,305 12,327 12,256 Exceptional Items Pre-tax Profit 12,465 15,355 13,305 12,327 12,256 Taxation -2,622 -2,999 -2,777 -2,573 -2,558 Exceptional Income - post-tax Profit After Tax 9,843 12,355 10,528 9,754 9,698 Minority Interests -266 -253 -216 -200 -199 Preferred Dividends FX Gain/(Loss) - post tax Other Adjustments - post-tax Net Profit 9,577 12,102 10,313 9,555 9,500 Recurring Net Profit 9,577 12,102 10,313 9,555 9,500 Fully Diluted Recurring Net Profit 9,577 12,102 10,313 9,555 9,500 Cash Flow (VNDb) Dec-17A Dec-18A Dec-19F Dec-20F Dec-21F EBITDA 14,219 17,212 15,797 15,877 17,978 Cash Flow from Invt. & Assoc. -1,225 -1,620 -1,176 -1,187 -1,256 Change In Working Capital 3,158 -590 796 -34 606 (Incr)/Decr in Total Provisions 99 25 0 0 0 Other Non-Cash (Income)/Expense -1,631 -1,858 -2,491 -3,549 -5,722 Other Operating Cashflow 2,467 2,884 10,102 8,879 14,586 Net Interest (Paid)/Received -302 -446 -267 -383 -635 Tax Paid -2,400 -3,113 -2,777 -2,573 -2,558 Cashflow From Operations 14,386 12,495 19,984 17,030 22,998 Capex -2,180 -714 -5,974 -8,063 -17,555 Disposals Of FAs/subsidiaries 17 0 5 6 7 Acq. Of Subsidiaries/investments Other Investing Cashflow -882 -6,463 -3,504 -3,580 -3,580 Cash Flow From Investing -3,044 -7,178 -9,473 -11,638 -21,128 Debt Raised/(repaid) 1,555 -4,300 801 2,331 7,048 Proceeds From Issue Of Shares Shares Repurchased Dividends Paid -7,265 -7,866 -7,896 -7,999 -7,953 Preferred Dividends Other Financing Cashflow -20 50 50 50 50 Cash Flow From Financing -5,729 -12,115 -7,045 -5,617 -854 Total Cash Generated 5,613 -6,798 3,466 -225 1,016 Free Cashflow To Equity 12,897 1,018 11,312 7,724 8,918 Free Cashflow To Firm 11,643 5,763 10,778 5,775 2,505
  • 38. Oil & Gas Exp & Prodn │ Vietnam PetroVietnam Gas JSC │ March 27, 2019 38 BY THE NUMBERS… cont’d SOURCES: VND RESEARCH, COMPANY REPORTS Balance Sheet (VNDb) Dec-17A Dec-18A Dec-19F Dec-20F Dec-21F Total Cash And Equivalents 27,079 28,308 25,293 20,532 13,080 Total Debtors 9,175 10,232 9,582 10,346 11,262 Inventories 1,645 1,952 1,848 2,043 2,240 Total Other Current Assets 357 462 462 462 462 Total Current Assets 38,257 40,955 37,184 33,383 27,044 Fixed Assets 15,396 18,540 20,798 24,487 36,080 Total Investments 281 280 280 280 280 Intangible Assets 0 0 0 0 0 Total Other Non-Current Assets 7,955 2,804 2,804 2,804 2,804 Total Non-current Assets 23,632 21,624 23,882 27,571 39,164 Short-term Debt 1,738 1,490 1,734 2,445 3,906 Current Portion of Long-Term Debt Total Creditors 2,529 2,899 2,696 2,911 3,169 Other Current Liabilities 6,645 6,810 6,810 6,810 6,810 Total Current Liabilities 10,912 11,199 11,240 12,166 13,885 Total Long-term Debt 7,312 3,396 3,952 5,573 11,160 Hybrid Debt - Debt Component Total Other Non-Current Liabilities 394 519 519 519 519 Total Non-current Liabilities 7,706 3,915 4,472 6,092 11,679 Total Provisions 0 0 0 0 0 Total Liabilities 18,618 15,114 15,712 18,259 25,565 Shareholders' Equity 41,490 45,687 43,792 41,333 39,480 Minority Interests 1,782 1,778 1,562 1,362 1,164 Total Equity 43,272 47,465 45,355 42,696 40,643 Key Ratios Dec-17A Dec-18A Dec-19F Dec-20F Dec-21F Revenue Growth 9.2% 17.1% (1.3%) 8.0% 8.9% Operating EBITDA Growth 20.6% 21.1% (8.2%) 0.5% 13.2% Operating EBITDA Margin 22.0% 22.8% 21.2% 19.7% 20.5% Net Cash Per Share (VND) 9,420 12,238 10,244 6,539 -1,038 BVPS (VND) 21,678 23,870 22,881 21,596 20,627 Gross Interest Cover 41.07 33.00 73.00 49.81 28.54 Effective Tax Rate 21.0% 19.5% 20.9% 20.9% 20.9% Net Dividend Payout Ratio 75.9% 65.0% 76.6% 83.7% 83.7% Accounts Receivables Days 59.50 46.83 48.42 45.23 44.93 Inventory Days 10.82 11.45 11.78 10.94 10.95 Accounts Payables Days 17.57 15.87 15.88 14.39 14.19 ROIC (%) 31.7% 45.9% 39.8% 35.4% 31.6% ROCE (%) 25.4% 30.6% 26.0% 24.7% 23.9% Return On Average Assets 15.5% 18.7% 15.6% 15.1% 15.2% Key Drivers Dec-17A Dec-18A Dec-19F Dec-20F Dec-21F Oil Price (US$/bbl) 54.0 72.0 65.0 68.0 70.0 Volume Growth (%) -4.6% -0.5% -0.8% 0.4% -0.2% Ratio Of Up To Downstream (x) N/A N/A N/A N/A N/A Operating Cash Cost (US$/bbl) N/A N/A N/A N/A N/A Ratio Of High To Low Margin (x) N/A N/A N/A N/A N/A
  • 39. Company Note Oil & Gas Exp & Prodn │ Vietnam │ March 27, 2019 Shariah Compliant IMPORTANT DISCLOSURES, INCLUDING ANY REQUIRED RESEARCH CERTIFICATIONS, ARE PROVIDED AT THE END OF THIS REPORT. IF THIS REPORT IS DISTRIBUTED IN THE UNITED STATES IT IS DISTRIBUTED BY CIMB SECURITIES (USA), INC. AND IS CONSIDERED THIRD-PARTY AFFILIATED RESEARCH. Powered by the EFA Platform Insert Insert PetroVietnam Technical Services Let the good times roll ■ We believe PetroVietnam Technical Services (PVS) could be a key beneficiary of Vietnam’s push for renewed dry gas reserves. ■ We expect it to deliver strong earnings growth (net profit CAGR of 25.4%) in FY18-21F. ■ Initiate coverage with Add and target price of VND25,000. A diversified oilfield services company with strong financial health PVS provides a variety of technical services to the oil and gas industry, ranging from exploration support, field construction and oil production to supply bases. Despite facing difficulties from weak market conditions since the collapse of crude oil prices in 2014, PVS has successfully maintained strong financial health (FY18 net margin of 7.0% and FY18 ROE of 9.3%), underpinned by high liquidity ratios (current ratio of 2.0x), low leverage (debt/equity ratio of 0.1x) and a high cash balance (cash per share of VND16.80 at the end-FY18E). Key beneficiary of Vietnam’s push for renewed dry gas reserves PVS is the sole domestic contractor that provides engineering, procurement and construction (EPC) services to offshore oil and gas projects in Vietnam. Currently, PVS is the main EPC contractor for the Sao Vang Dai Nguyet project (total contract value of c.US$850m). Other big projects in its pipeline are Su Tu Trang Phase 2, Nam Du – U Minh, Blue Whale, and Block B – O Mon. The total order backlog for these projects, while not yet disclosed in detail, could amount to US$2,000m, based on our estimates. Strong earnings growth expected in FY18-21F With several big projects on the horizon, we forecast PVS to post a sales CAGR of 19.6% and net profit CAGR of 25.4% in FY18-21F. Based on the scope of work for these projects, PVS’s mechanical & engineering (M&C) and floating production storage & offloading (FPSO/FSO) segments are likely to benefit the most once these projects get off the ground. Initiate coverage with Add and target price of VND25,000 Initiate on PVS with an Add and TP of VND25,000, based on a combination of DCF (weight 50%) and target FY19-21F P/E of 7.8x (weight 50%), based on historical 5-year mean P/E. Potential re-rating catalysts and risks If the geopolitical issues facing Ca Rong Do are resolved and the project starts up again, we estimate it could add: 1) c.VND500bn (engineering works) to PVS’s net profit in FY18- 21F, and 2) c.VND300bn p.a. (FPSO vessel for field operators) to net profit post FY21F. Downside risks are geopolitical issues hampering progress of key oil and gas projects. SOURCES: VND RESEARCH, COMPANY REPORTS Vietnam ADD (previously NOT RATED) Consensus ratings*: Buy 6 Hold 1 Sell 0 Current price: VND20,600 Target price: VND25,000 Previous target: N/A Up/downside: 21.4% CGS-CIMB / Consensus: 6.0% Reuters: PVS.HM Bloomberg: PVS VN Market cap: US$424.4m VND9,846,106m Average daily turnover: US$2.54m VND58,459m Current shares o/s: 478.0m Free float: 34.0% *Source: Bloomberg Key changes in this note N/A Source: Bloomberg Price performance 1M 3M 12M Absolute (%) -1 16.4 2 Relative (%) 0.5 8.1 18.7 Major shareholders % held PetroVietnam Group 51.4 VinaCapital 5.5 Dragon Capital 4.0 Insert Analyst(s) Linh VU Viet T (84) 38 955 2199 E linh.vuviet@vndirect.com.vn Mai PHAM T (84) 94 328 0850 E mai.phamle@vndirect.com.vn Financial Summary Dec-17A Dec-18A Dec-19F Dec-20F Dec-21F Revenue (VNDb) 16,729 14,667 13,627 21,180 26,362 Operating EBITDA (VNDb) 710 871 1,311 1,662 1,961 Net Profit (VNDb) 801 1,023 1,194 1,572 2,015 Core EPS (VND) 1,793 2,213 2,499 3,288 4,216 Core EPS Growth (18.9%) 23.4% 12.9% 31.6% 28.2% FD Core P/E (x) 11.49 9.31 8.24 6.26 4.89 DPS (VND) 594 1,064 1,243 1,118 1,265 Dividend Yield 2.88% 5.17% 6.03% 5.43% 6.14% EV/EBITDA (x) -0.74 -1.40 -2.09 -2.15 -2.51 P/FCFE (x) NA 8.40 4.12 7.33 5.10 Net Gearing (50.7%) (58.6%) (66.5%) (70.6%) (74.4%) P/BV (x) 0.86 0.87 0.78 0.75 0.70 ROE 7.6% 9.3% 10.0% 12.2% 14.8% % Change In Core EPS Estimates CIMB/consensus EPS (x) 1.38 1.52 1.49 84.0 102.8 121.5 13,000 18,000 23,000 Price Close Relative to VNINDEX (RHS) 5 10 15 20 Mar-18 Jun-18 Sep-18 Dec-18 Volm
  • 40. Oil & Gas Exp & Prodn │ Vietnam PetroVietnam Technical Services │ March 27, 2019 40 Let the good times roll INVESTMENT THESIS A diversified oilfield services company with strong financial health and significant net cash position PVS provides a variety of technical services to the oil and gas industry, ranging from exploration support, field construction and oil production to supply bases. The two business segments that contribute the most to PVS’s revenue and gross profit are mechanical and engineering (M&C, 47.4% and 42.1% of FY18E’s revenue and gross profit, respectively) and floating production storage and offloading (FPSO/FSO, 11.0% and 47.3% of FY18E revenue and gross profit, respectively). PVS’s business segments are described below: 1. Mechanical & engineering (M&C): Provides offshore construction services to oil and gas projects in Vietnam 2. Floating, production, storage and offloading (FPSO/FSO): Provides full- service leasing of FPSO/FSO vessels to oil and gas operators. 3. Port base: Provides management, administration, and port operation services to oil and gas operators. 4. Seismic survey (ROV): Provides 2D and 3D seismic survey and data- processing services to oil and gas explorers. Other segments: Includes the provision of offshore support vessels, operation and maintenance services, hospitality, and security services. Figure 1: PVS’s presence in Vietnam’s oil and gas value chain SOURCES: VND RESEARCH, COMPANY REPORTS Figure 2: PVS’s revenue breakdown by segment (VND tr) Figure 3: PVS’s adjusted gross profit by segment (VND tr) SOURCES: VND RESEARCH, COMPANY REPORTS SOURCES: VND RESEARCH, COMPANY REPORTS The collapse of crude oil prices in late-2014 led to significant spending cuts by major oil and gas operators, hence reducing PVS’s net profit in recent years. Even though global crude oil prices recovered somewhat in 2017 and 2018, the financial performance of PVS has not improved in tandem. Generally, it takes 1- 2 years before oilfield services companies like PVS start benefiting from upward
  • 41. Oil & Gas Exp & Prodn │ Vietnam PetroVietnam Technical Services │ March 27, 2019 41 movements of crude oil prices due to the long lead times associated with a resumption of exploration activity. Despite the difficulties from weak market conditions, PVS has successfully maintained strong financial health (FY18 net margin of 7.0% and FY18 ROE of 9.3%), underpinned by high liquidity ratios (current ratio of 2.0x), low leverage (debt/equity ratio of 0.1x) and a high cash balance (cash per share of VND16.80 at the end-FY18E). The collapse of the crude oil price in late 2014 led to significant spending cuts by major oil and gas operators, which reduced PVS’s EPS in recent years. Figure 4: PVS’s profitability vs. crude oil price movements SOURCES: VND RESEARCH, COMPANY REPORTS Despite difficulties from weak market conditions, PVS has managed to maintain strong financial health. Figure 5: PVS’s key liquidity and leverage ratios SOURCES: VND RESEARCH, COMPANY REPORTS PVS’s cash and cash equivalent accounted for c.35% of the company’s total assets at end-FY18. Figure 6: PVS’s cash per share vs. PVS’s share price (VND) SOURCES: VND RESEARCH, COMPANY REPORTS Key beneficiary of Vietnam’s push for renewed domestic dry gas reserves PVS is the sole domestic contractor providing engineering, procurement and construction (EPC) services to offshore oil and gas projects in Vietnam. Given its dominant market position, we expect PVS to participate in almost all of Vietnam’s major oil and gas projects in the coming years.
  • 42. Oil & Gas Exp & Prodn │ Vietnam PetroVietnam Technical Services │ March 27, 2019 42 Currently, PVS is the main EPC contractor for the ongoing Sao Vang Dai Nguyet project (total contract value of c.US$850m). Other big projects in its pipeline are Su Tu Trang Phase 2, Nam Du – U Minh, Blue Whale, and Block B – O Mon. The total order backlog for these projects, while not yet disclosed in detail, could amount to US$2,000m, based on our estimates. Ca Rong Do is another big upcoming project, but is currently suspended (possibly for another two years) due to a force majeure event in Mar 2018. All of these projects are key to ensuring Vietnam’s national energy security over the next few decades. We believe these projects are well timed to meet the imminent rise in dry gas demand domestically. (Please refer to our sector report for more information.) Figure 7: PVS’s key projects in FY19-22F SOURCES: VND RESEARCH, COMPANY REPORTS PVS is the main EPC contractor for the Sao Vang Dai Nguyet project. The company is responsible for constructing a central processing platform, which will include production well slots and support dry trees. In addition, PVS’s joint venture Malaysian-Vietnam Offshore Terminal will also supply an FSO vessel to the project, starting from 2H20F. Figure 8: Overview of Sao Vang Dai Nguyet project SOURCES: VND RESEARCH, COMPANY REPORTS
  • 43. Oil & Gas Exp & Prodn │ Vietnam PetroVietnam Technical Services │ March 27, 2019 43 Su Tung Trang phase 2 is a high- potential project for PVS in FY18-21F. For this project, we expect PVS to construct additional central processing platforms for the field. Figure 9: Overview of Su Tu Trang Phase 2 project SOURCES: VND RESEARCH, COMPANY REPORTS Nam Du – U Minh is a potential project for PVS in FY20-22F. The project will require the construction of two wellhead platforms and one FPSO vessel to serve production activities. Figure 10: Overview of Nam Du – U Minh project SOURCES: VND RESEARCH, COMPANY REPORTS Block B – O Mon is one of the largest gas projects in Vietnam to date, with total investment of roughly US$10bn. We expect PVS to be the sub- contractor responsible for constructing some operation platforms for the project. However, the development timeline for Block B – O Mon is uncertain due to current financing difficulties. We expect this project to only commence in 3QFY23F, at the earliest. Figure 11: Overview of Block B – O Mon project SOURCES: VND RESEARCH, COMPANY REPORTS
  • 44. Oil & Gas Exp & Prodn │ Vietnam PetroVietnam Technical Services │ March 27, 2019 44 Ca Voi Xanh is the largest gas field discovered in Vietnam to date. The project is expected to supply an especially important source of natural gas for electricity generation and the petrochemical industry. However, as the project has not reached final investment decision (FID), we have not integrated this project into our PVS financial forecasts for FY18-21F. Figure 12: Overview of Ca Voi Xanh project SOURCES: VND RESEARCH, COMPANY REPORTS The Ca Rong Do project is considered key in slowing the decline of Vietnam’s oil and gas production in FY18-20F. However, due to unexpected geopolitical issues, the project was suspended in Mar 2018. PVS is the main EPC contractor for the project, responsible for constructing a tension leg wellhead platform and supplying an FPSO vessel for oil production. As the project is unlikely to resume before 2021F, we eliminate this project from our PVS financial forecasts for the FY18-21F period. Figure 13: Overview of Ca Rong Do project SOURCES: VND RESEARCH, COMPANY REPORTS Strong earnings growth expected in FY18-21F With several big projects on the horizon, we forecast PVS to post a sales CAGR of 19.6% and net profit CAGR of 25.4% in FY18-21F. Based on the scope of work for these projects, PVS’s M&C and FPSO/FSO segments are expected to benefit the most once these projects get off the ground. In addition, we anticipate PVS’s profitability in FY18-21F to improve, thanks to the discontinuation of the loss-making remote-operated vehicle (ROV) seismic survey segment from FY19F. We note that this segment alone incurred gross losses of c.VND400bn in FY18, equivalent to 21.1% of PVS’s adjusted gross profit in FY18.
  • 45. Oil & Gas Exp & Prodn │ Vietnam PetroVietnam Technical Services │ March 27, 2019 45 Figure 14: Our forecasts for PVS’s revenue, by segment (VND tr) Figure 15: Our forecasts for PVS’s adjusted gross profit, by segment (VND tr) SOURCES: VND ESTIMATES, COMPANY REPORTS SOURCES: VND ESTIMATES, COMPANY REPORTS We forecast PVS to post a net profit CAGR of 25.4% in FY18-21F Figure 16: Our forecasts for PVS’s net profit (VND tr) SOURCES: VND RESEARCH, COMPANY REPORTS VALUATION AND RECOMMENDATION Initiate coverage with Add and target price of VND25,000 We initiate coverage on PVS with an Add rating and target price of VND25,000, based on a combination of DCF (weight 50%) and target FY19-21F P/E multiple of 7.8x (weight 50%). Our DCF valuation for PVS is VND24,295, based on terminal growth of 1.0% and weighted average cost of capital (WACC) of 22.5%. We estimate PVS’s WACC at 21.7% assuming: 1) a risk-free rate of 5.0%, 2) beta of 1.75, and 3) equity risk premium of 11%. Figure 17: DCF model – Summary of free cash flow (FCF) SOURCES: VND RESEARCH ESTIMATES, COMPANY REPORTS VNDbn Dec-16A Dec-17A Dec-18E Dec-19F Dec-20F Dec-25F Dec-30F Dec-35F CAGR 20-35F Total revenue 18,720 16,729 14,667 13,627 21,180 33,247 36,758 39,013 4.2% % yoy 0.0% -10.6% -12.3% -7.1% 55.4% 2.8% 1.6% 1.0% COGS & OPEX (18,620) (16,704) (14,363) (12,886) (20,044) (31,437) (34,757) (36,890) Unlevered profit / EBIT 100 24 304 741 1,136 1,810 2,001 2,124 4.3% Operating margin 0.5% 0.1% 2.1% 5.4% 5.4% 5.4% 5.4% 5.4% Effective tax rate -30.7% -22.0% -42.7% -22.0% -22.0% -22.0% -22.0% -22.0% EBIT * (1-Tax) or NOPAT 69 19 174 578 886 1,411 1,561 1,656 4.3% + Depreciation and amortisation 871 685 567 567 520 678 752 799 % of revenue 4.7% 4.1% 3.9% 4.2% 2.5% 2.0% 2.0% 2.0% - Capex (448) (436) (355) (329) (512) (804) (889) (943) % of revenue -2.4% -2.6% -2.4% -2.4% -2.4% -2.4% -2.4% -2.4% + Change in working capital (767) 677 (204) (28) (1,257) (1,162) (1,300) (1,384) % of revenue -4.1% 4.0% -1.4% -0.2% -5.9% -3.5% -3.5% -3.5% Interest and other financial activities, net 1,140 978 655 763 830 1,354 1,496 1,587 % of revenue 6.1% 5.8% 4.5% 5.6% 3.9% 4.1% 4.1% 4.1% Unlevered free cash flow (UFCF) 865,052 1,923,111 837,543 1,551,331 467,309 1,478,070 1,619,860 1,715,855 % yoy 0.0% 122.3% -56.4% 85.2% -69.9% 0.6% 2.1% 1.0% With several big projects on the horizon, we forecast PVS to post a sales CAGR of 19.6% and adjusted gross profit CAGR of 18.2% in FY18-21F. We note that the adjusted gross profit of the FPSO/FSO segment in FY18E was abnormally high, thanks to the non-recurring profit recorded from the asset re- valuation of FSO Orkid and FPSO Ruby.