This document presents the deep-subsea Ocean Thermal Energy Conversion (OTEC) concept, highlighting its threefold increase in exergy efficiency compared to topside systems, potential for negative CO2 emissions, and estimated costs of about USD 600 million for a 100 MW system. The deep-subsea design minimizes environmental impact by preventing CO2 upwelling and reduces investment costs by omitting naval structures. Overall, the deep-subsea OTEC offers a more efficient and cost-effective solution for renewable energy production in suitable tropical locations.
![Deep-Subsea OTEC
Vicente Fachina 1
1 Petrobras, Brazil; vicentefachina@gmail.com
Abstract: This article presents the deep-subsea OTEC concept, with a threefold increase in exergy efficiency
as to the topside one. On the environmental aspect, the deep-subsea OTEC concept can bring about negative
CO2 emissions, which poses a positive environmental risk. On the economics, with appropriate public
funding, 100 MW deep-subsea OTEC asset would cost about USD(2010) 600 million. On the life-cost of energy,
40-60 USD(2010)/MWh
Keywords: ocean energy, OTEC, renewable energy, solar energy
1. Introduction
This paper proposes concept design for the deep-subsea ocean thermal energy conversion asset (OTEC) as alternative to
topside. Such concept joins the heat source (tropical surface ocean water) to the heat sink (deep ocean water) by an
insulated pipe, which brings the warm surface ocean water downwards the deep-subsea facility. The key advantages are
to eliminate CO2 upwelling from the deep ocean waters, and to minimize investment and costs for no need of naval
structures and human facilities.
The physical principle of the OTEC energy route is similar to the geothermal one. Both ones are characterized by
utilizing Rankine-derived thermodynamic power cycles. In the tropics, heat sources stem from the surface ocean waters,
and heat sinks from the deep waters below 800 m depth. Since the sun is the primary heat source, it is acceptable to
qualify the OTEC energy route as a kind of solar power with inherent heat storage.
Investments on OTEC include large equipment needed to convert into electricity the low thermal energy density from
the tropical oceans. Nonetheless, there are two positive expectations for economic consideration:
1) 90% operation capacity [1] for OTEC should not present the issues of intermittent energy supply from direct solar
and wind power, or from rainfall regimes of the hydropower, or from crop seasonality of bio-fuels;
2) Besides electricity, other deliverables are possible as desalinated seawater and cold water for air conditioning or
aquiculture systems.
Cornelia and Davis [2] carried out a comparison study for the renewable ocean energy options, and the conclusion is the
OTEC energy route is the best fit for a high energy and carbon prices scenario. These can provide competitive
economic performance indicators in locations with no access to hydropower or high fuel costs. Ocean islands or tropical
coastal regions may benefit from the OTEC deliverables [3]. In case of potential artificial islands or ocean cities in a
future scenario, OTEC can be one of the components in a synergic renewable ocean energy portfolio, together with
offshore wind power, solar power, and others such as currents, tides and waves. In terms of planetary technical energy
resource, ocean thermal gradients account for about 7 TW [4].
2. Concept Design
Equation (1) is an exergy model (exergy per unit mass) [5], which stems from the complete Legendre transformation of
energy1
. The functions h (enthalpy) and s (entropy) stem from thermodynamic functions of working fluids. If there are
chemical, nuclear reactions in the power cycle, energy potentials (μ), together with variation in mol, atomic numbers
(N), shall be considered. Gravity field (g) depends on mass.
In case of OTEC, the term with energy potential does not apply for there are no chemical, nuclear reactions in the power
cycle, only heat transfers. The deep ocean water (DOW) is the heat sink, for which there must have reference values for
the temperature, enthalpy and entropy. The surface ocean water (SOW) is the heat source. Also, any fluid column (L)
above the water line becomes important, and undesirable, if the water pumps are not installed below the water line.
1
A Legendre transformation substitutes function´s first derivatives for the function itself. The complete Legendre transformation of
energy is , where φ is exergy, u is energy, and x represents energy independent variables. The Einstein´s
summation convention over i is applied for the u partial derivatives to x. Such a convention is applied in all models for replacing the
Σ symbol.](https://image.slidesharecdn.com/deep-subseaotec-180121122719/85/Deep-subsea-OTEC-1-320.jpg)
![Deep-Subsea OTEC
Vicente Fachina 1
1 Petrobras, Brazil; vicentefachina@gmail.com
Abstract: This article presents the deep-subsea OTEC concept, with a threefold increase in exergy efficiency
as to the topside one. On the environmental aspect, the deep-subsea OTEC concept can bring about negative
CO2 emissions, which poses a positive environmental risk. On the economics, with appropriate public
funding, 100 MW deep-subsea OTEC asset would cost about USD(2010) 600 million. On the life-cost of energy,
40-60 USD(2010)/MWh
Keywords: ocean energy, OTEC, renewable energy, solar energy
1. Introduction
This paper proposes concept design for the deep-subsea ocean thermal energy conversion asset (OTEC) as alternative to
topside. Such concept joins the heat source (tropical surface ocean water) to the heat sink (deep ocean water) by an
insulated pipe, which brings the warm surface ocean water downwards the deep-subsea facility. The key advantages are
to eliminate CO2 upwelling from the deep ocean waters, and to minimize investment and costs for no need of naval
structures and human facilities.
The physical principle of the OTEC energy route is similar to the geothermal one. Both ones are characterized by
utilizing Rankine-derived thermodynamic power cycles. In the tropics, heat sources stem from the surface ocean waters,
and heat sinks from the deep waters below 800 m depth. Since the sun is the primary heat source, it is acceptable to
qualify the OTEC energy route as a kind of solar power with inherent heat storage.
Investments on OTEC include large equipment needed to convert into electricity the low thermal energy density from
the tropical oceans. Nonetheless, there are two positive expectations for economic consideration:
1) 90% operation capacity [1] for OTEC should not present the issues of intermittent energy supply from direct solar
and wind power, or from rainfall regimes of the hydropower, or from crop seasonality of bio-fuels;
2) Besides electricity, other deliverables are possible as desalinated seawater and cold water for air conditioning or
aquiculture systems.
Cornelia and Davis [2] carried out a comparison study for the renewable ocean energy options, and the conclusion is the
OTEC energy route is the best fit for a high energy and carbon prices scenario. These can provide competitive
economic performance indicators in locations with no access to hydropower or high fuel costs. Ocean islands or tropical
coastal regions may benefit from the OTEC deliverables [3]. In case of potential artificial islands or ocean cities in a
future scenario, OTEC can be one of the components in a synergic renewable ocean energy portfolio, together with
offshore wind power, solar power, and others such as currents, tides and waves. In terms of planetary technical energy
resource, ocean thermal gradients account for about 7 TW [4].
2. Concept Design
Equation (1) is an exergy model (exergy per unit mass) [5], which stems from the complete Legendre transformation of
energy1
. The functions h (enthalpy) and s (entropy) stem from thermodynamic functions of working fluids. If there are
chemical, nuclear reactions in the power cycle, energy potentials (μ), together with variation in mol, atomic numbers
(N), shall be considered. Gravity field (g) depends on mass.
In case of OTEC, the term with energy potential does not apply for there are no chemical, nuclear reactions in the power
cycle, only heat transfers. The deep ocean water (DOW) is the heat sink, for which there must have reference values for
the temperature, enthalpy and entropy. The surface ocean water (SOW) is the heat source. Also, any fluid column (L)
above the water line becomes important, and undesirable, if the water pumps are not installed below the water line.
1
A Legendre transformation substitutes function´s first derivatives for the function itself. The complete Legendre transformation of
energy is , where φ is exergy, u is energy, and x represents energy independent variables. The Einstein´s
summation convention over i is applied for the u partial derivatives to x. Such a convention is applied in all models for replacing the
Σ symbol.](https://image.slidesharecdn.com/deep-subseaotec-180121122719/75/Deep-subsea-OTEC-1-2048.jpg)
![(1)
Figure 1 shows the thermodynamic power cycle utilized by the Author for the numeric simulation.
The Equation set (2) comprises coupled steady state and energy balance equations, which build the working model for
the simulation. The Author has utilized a software tool with built-in thermodynamic functions, the ammonia-water
mixture included. Equation (2a) calculates the overall exergy efficiency of the power cycle by solving for η. Equation
(2b) establishes the overall energy balance of the power cycle, and so does Equation (2c) for electricity only.
Equation (2d) establishes the energy balances for every system depicted in Figure 1.
On the working fluid, research and development activities since the 1980´s have leaded to the use of the ammonia-water
mixture on the OTEC power cycles for its larger enthalpy gap than with ammonia only [6].
(2a)
0 gross
i
i WQ (2b)
0 netgross
i
i WWW (2c)
(2d)
Figure 1: The Uehara®´s power cycle
TG-1∩
U
Q
W
REGENERATOR
ABSORBER
CONDENSER
EVAPORATOR
SEPARATOR
QC
∑Wi
NH4
+
OH
-
TG-2
yw1 (1-y)w1
1-w1
7
8 9
10
1
2
3
4
5
6
11
T5
T2
WT
w1 NH3/H2O
mass fraction
NH3/H2O
mass fraction
w2 NH3/H2O
mass fraction
NH3/H2O
mass fraction](https://image.slidesharecdn.com/deep-subseaotec-180121122719/85/Deep-subsea-OTEC-2-320.jpg)
![Table 1 shows three numeric simulations: the Vega´s [7], the Ouchi´s [8], and the Author´s.
The performance metrics consider electricity as the only output. The Ouchi´s paper does consider desalinated seawater
as an output besides electricity; nevertheless, electricity has to be used for actually making desalinated seawater and
pumping it to onshore or offloading it to a tanker ship. The more desalinated seawater to make and pump, the less
deliverable electricity becomes available and vice-versa.
Table 1. Numeric simulations
Design attribute Vega´s Ouchi´s Author´s
Concept design Topside Topside Deep-subsea
Power cycle type NH3-Rankine Uehara®
Uehara®
Gross power 80 MW 5 MW 5 MW
Net power 53 MW 3 MW 3.5 MW
Ancillary electric consumption Not available Not available 2% gross power
SOW temperature 299 K 298 K 299 K
DOW temperature 278 K 278 K 279 K
SOW flow 264.6 m3
/s 14.5 m3
/s 5.4 m3
/s
Heat exchanger (HX) effectiveness Not available Not available 85%
Turbo generator efficiency Not available Not available 90%
Pumping efficiency Not available Not available 85%
HX temperature gap 3 K 3 K 6 K
HX pressure loss Not available Not available 1 bar
Seawater flow velocity 2.0 m/s 2.0 m/s 2.0 m/s
Piping internal wall roughness Not available Not available 50 μm
Performance metrics
Overall exergy efficiency 6% 7% 23%
Energy content (as to SOW) 0.20 MJ/m3
0.21 MJ/m3
0.65 MJ/m3
Note: Uehara®
[9].
As to the performance metrics in Table 1, the deep-subsea OTEC concept features exergy efficiency about three times
higher than topside´s. The former´s top advantage is the sizing of the heat exchangers, both the evaporator and the
condenser, for 6 K temperature difference. Another advantage is less-energy intensive seawater pumping due to the
higher water density in the deep sea.
Equation (3) models the CO2 relative concentration in air-to-water interfaces (R, the Revelle Factor) [10]. Such
concentration varies between 8 and 15, depending on the CO2 temperature and concentration at the sea level atmosphere.
As a base case, the Author assumes 10.
águaágua
arar
COCO
COCO
R
22
22
/
/
(3)
The concentration gradient of dissolved CO2 in the South Atlantic increases vertically from 2.0 mol CO2/t-water at sea
level up to 2.2 mol CO2/t-water at 1,000 m-depth [11]. Nevertheless, local measurements ought to be made due to
vertical and horizontal ocean current conditions.
For the onshore and the offshore topside assets (with long DOW pipe), there are CO2 positive emissions to the
atmosphere because DOW (with higher CO2 concentration) is pumped upwards the sea level (with lower CO2
concentration).
For the deep-subsea asset (with long SOW pipe), there are CO2 negative emissions, or capture from the atmosphere,
because SOW (with lower CO2 concentration) is pumped downwards the sea bottom (with higher CO2 concentration).](https://image.slidesharecdn.com/deep-subseaotec-180121122719/85/Deep-subsea-OTEC-3-320.jpg)
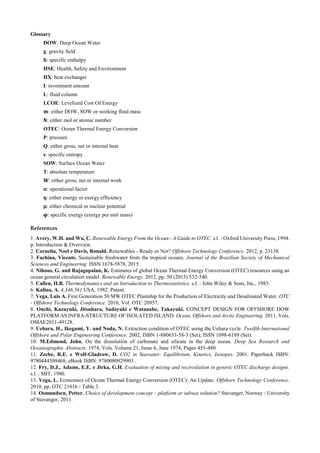
![From Equation (3) and the concentration gradient of dissolved CO2 in the South Atlantic, there would be about 11,700 t
CO2/yr negative CO2 emissions for a 5 MW gross deep-subsea OTEC asset, with 90% operational capacity.
Figure 2 illustrates a concept design of a deep-subsea OTEC asset. The SOW pipe has to be insulated for 1 K maximum
temperature decrease (which is a symmetric design requirement for a DOW pipe in case of a topside facility). The SOW
is pumped downwards the evaporator intake in the deep sea, and then upwards enough for safely discharging it away
from the DOW intake [12]. The DOW has to be pumped through the condenser, and then upwards enough for safely
discharging it away from its intake [12].
Figure 2. Concept design of a deep-subsea OTEC asset (not to scale)
3. Economics
On the investment, Equation (4) stems from the Vega´s model [13] for estimating the investment on first-generation
topside OTEC assets, with 2010-based USD values. Specifically for a deep-subsea OTEC asset, investments are
expected to be about 30% less than for topside2
[14]. In the Equation (4), the 0-subscript means the currency values
shall be converted to the same time base, usually the production start-up as time zero.
Table 2 compares normalized investments between the topside and the deep-subsea concepts. Technical services
comprise business case and initial engineering studies, which are assumed to cost the same for both concepts. The other
activity blocks differ substantially for the inherent deployment nature of the deep-subsea concept as to the topside one:
no need for floating naval structures and related crew needs. Specifically for the deep-subsea equipment, even higher
costs of the floating naval structures and human HSE systems in the topside concept should offset the high costs of the
deep-subsea equipment.
Table 2. Normalized investments
Activity block Top Deep Differences Deep as to Top (base case)
Technical services 5 5 -
Onshore assemblies 20 10 No floating and human HSE systems
Offshore assemblies 60 45 Less workmanship and related HSE systems
Commissioning 15 10 No human HSE systems to commission
Grand totals 100 70
Figure 3 displays Equation (4), with (red line). Values that are more accurate should come
up with the first commercial assets.
Equation (5) models the life-cost of energy (LCOE) as a function of the operational cost index and the net power
( ). The assumptions for Equation (5) are: constant 10%/yr discount rate (j), 90% operation capacity (α) [1], and 25
years for the asset life time (n).
Figure 3 displays Equation (5), with , and .
2
The k-factor value in the Equation (4) is 53 x 106
[USD/MW], which should be multiplied by 0.7 in order to account for the lower
expected investment for the deep-subsea OTEC asset. The value of λ is 0.6.
Figure 2: Concept design of a deep-subsea OTEC asset (not to scale).
-800 m
299 K
-700 m
SOW intake
SOW discharge
Sea level
-20 m (Ref)
279 K
DOW intake
DOW discharge
Subsea
level
Mooring cables](https://image.slidesharecdn.com/deep-subseaotec-180121122719/85/Deep-subsea-OTEC-4-320.jpg)
![(4)
(5)
On the operational cost index ( ), it depends on the asset size and technology, and it is modeled as a fraction of the total
investment at each period. For simplification, it is set constant in all periods. Such a factor shall get smaller if an
effective carbon market actually comes true.
Public funding becomes fundamental due to higher risks involved before market maturity; nevertheless, the
participation of private funding is necessary in order to promote better business efficiency under proper public
regulation frameworks.
Figure 3. LCOE and 2010 investment estimates for first-generation deep-subsea OTEC
4. Conclusions
The OTEC energy route taps into the solar heat storage in the tropical oceans. An overall advantage of the OTEC route
as to other renewable routes is the 90% expected operation capacity, which is far greater than direct solar or wind power.
Out of the several OTEC configurations, the deep-subsea one offers advantages as to the topside ones.
On the technical aspect, a deep-subsea OTEC concept can have exergy efficiencies about threefold higher as to the
topside ones.
On the environmental aspect, the deep-subsea OTEC concept can bring about negative CO2 emissions, for it has to
pump surface ocean water downwards the deep sea, which poses a positive environmental risk.
On the economical aspect, the deep-subsea OTEC concept can cost about 30% less than a topside one. An economic
model for 100 MW asset yields USD(2010) 600 million investments, and 40-60 USD(2010)/MWh LCOE.
Acknowledgments: The Author thanks Petrobras for their receptivity to the OTEC energy route.
100
200
300
400
500
600
700
20
40
60
80
100
120
140
160
10 20 30 40 50 60 70 80 90 100
I0
[USD x 106]
LCOE
[USD/MWh]
Net power [MW]
2% 4% 6% 8% 10%
ξ
j=10%/yr
n=25 years
α=90%](https://image.slidesharecdn.com/deep-subseaotec-180121122719/85/Deep-subsea-OTEC-5-320.jpg)