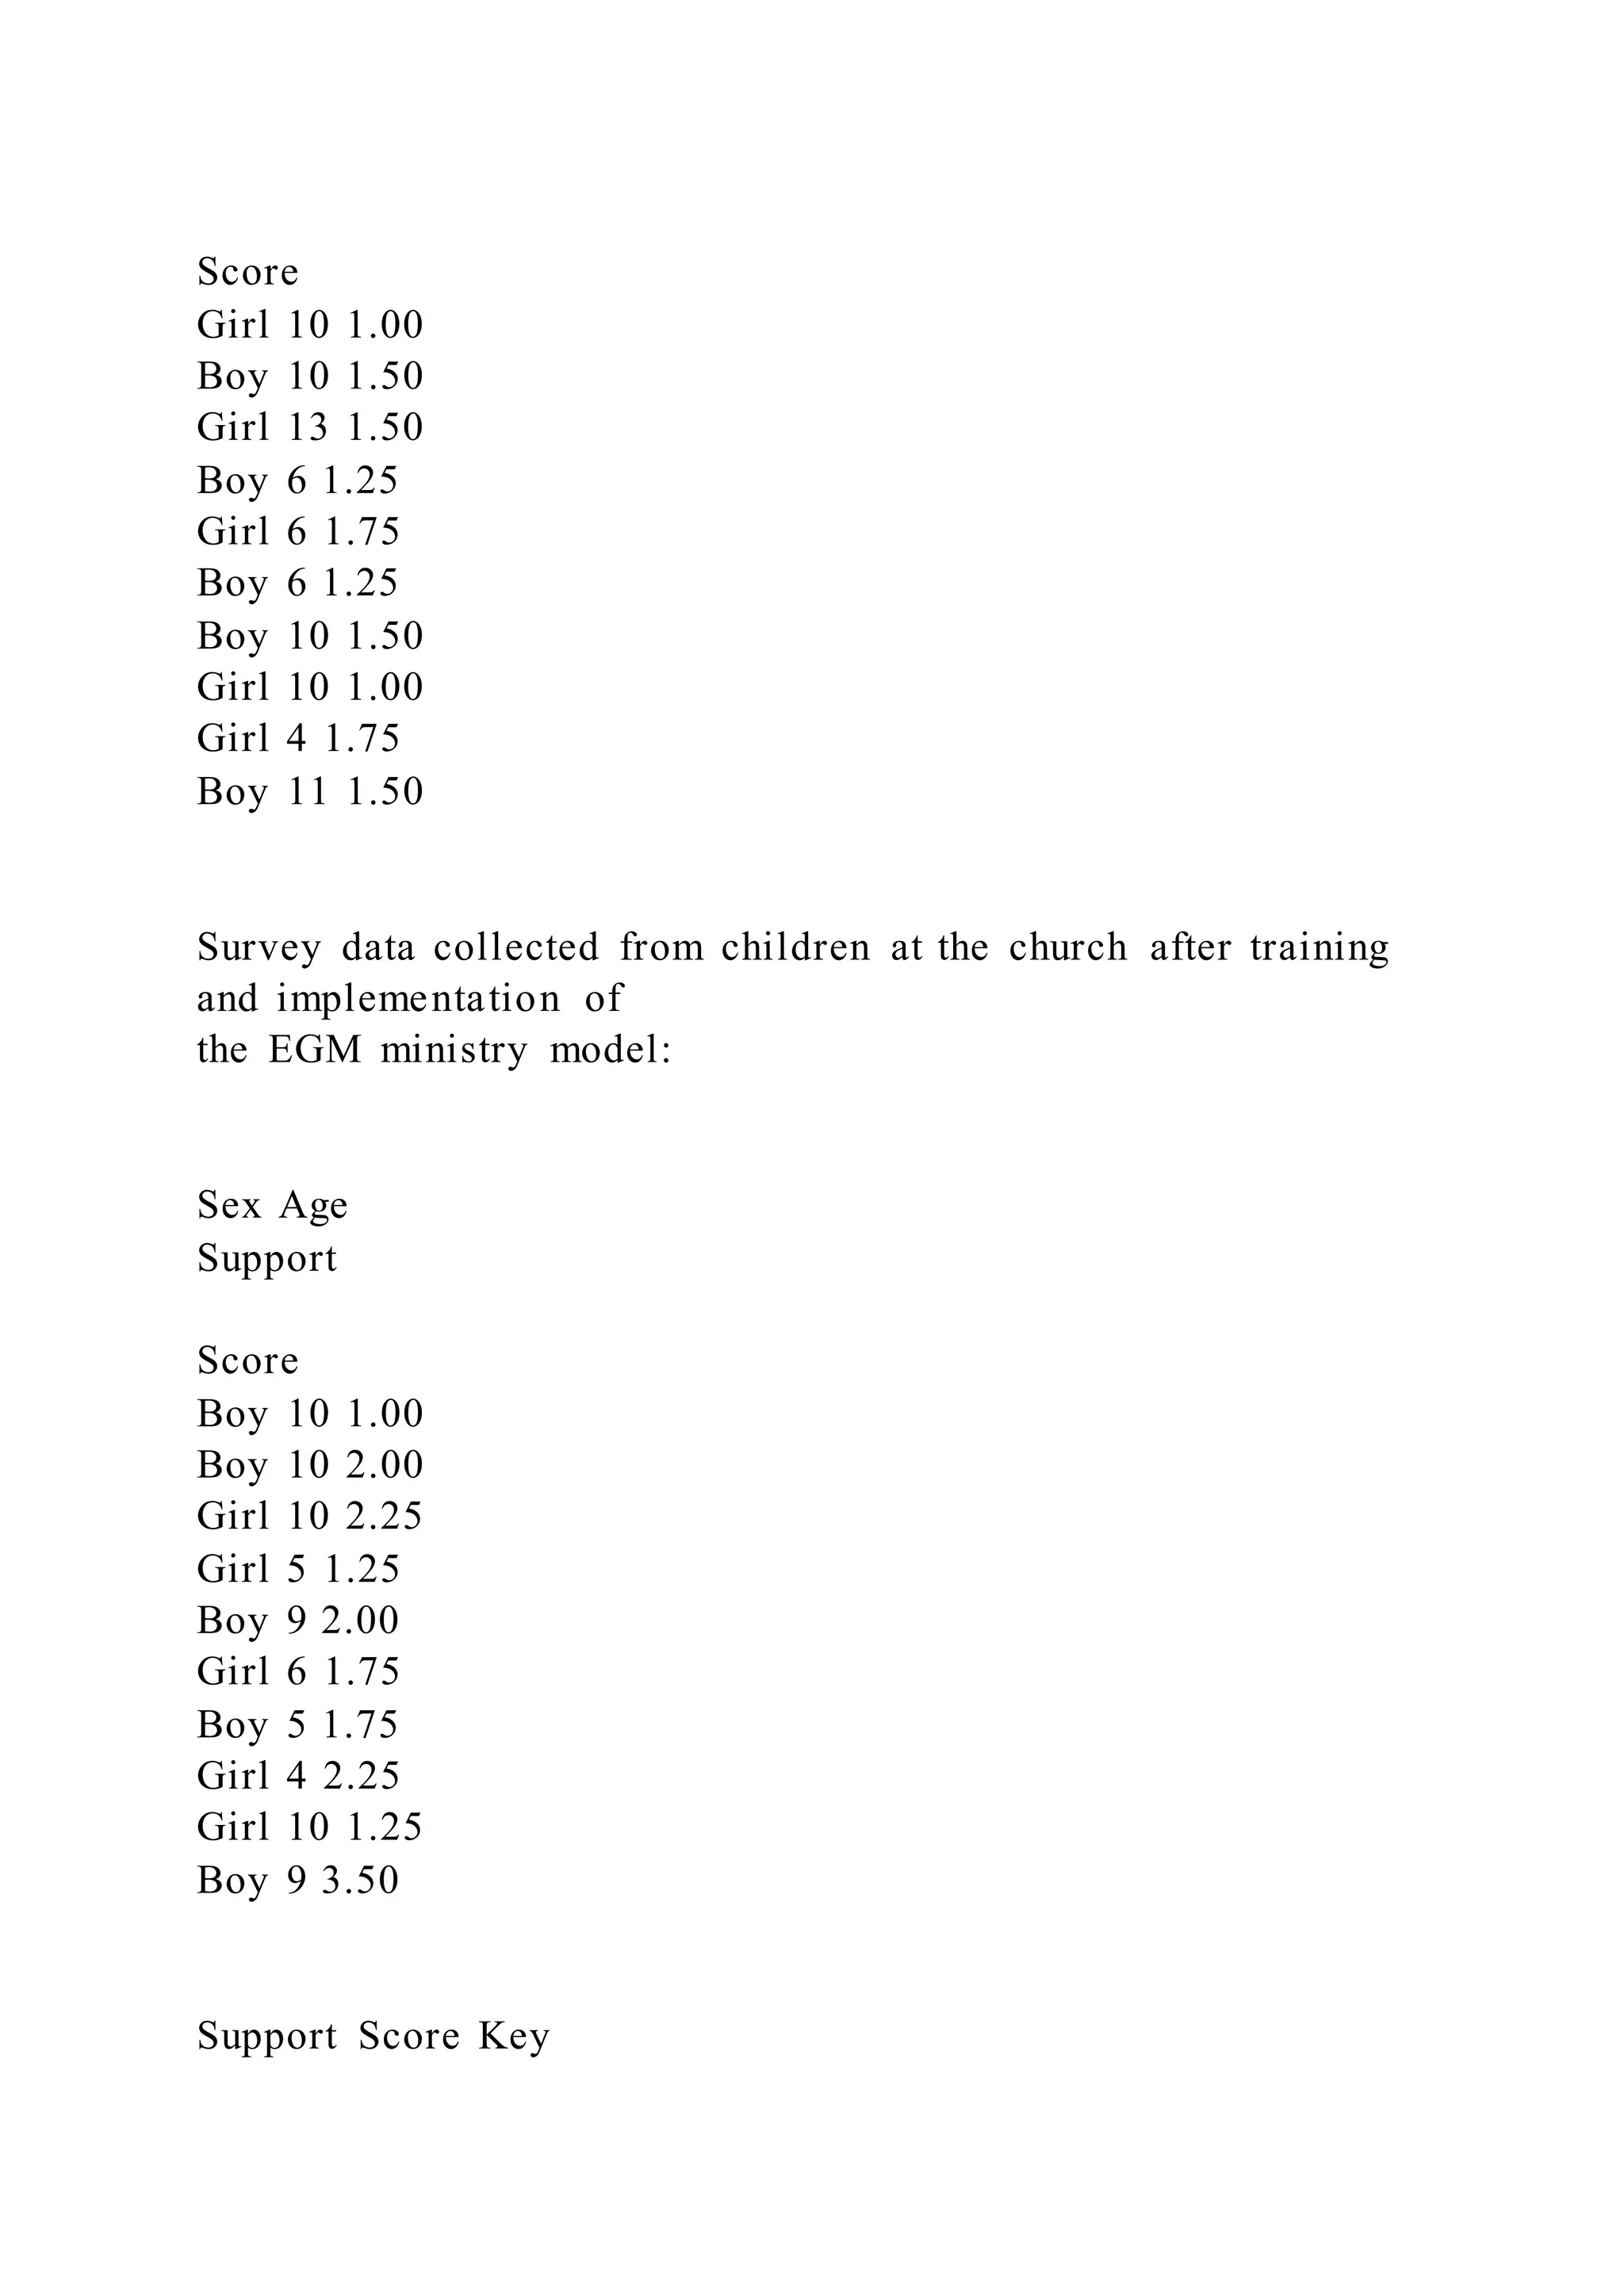
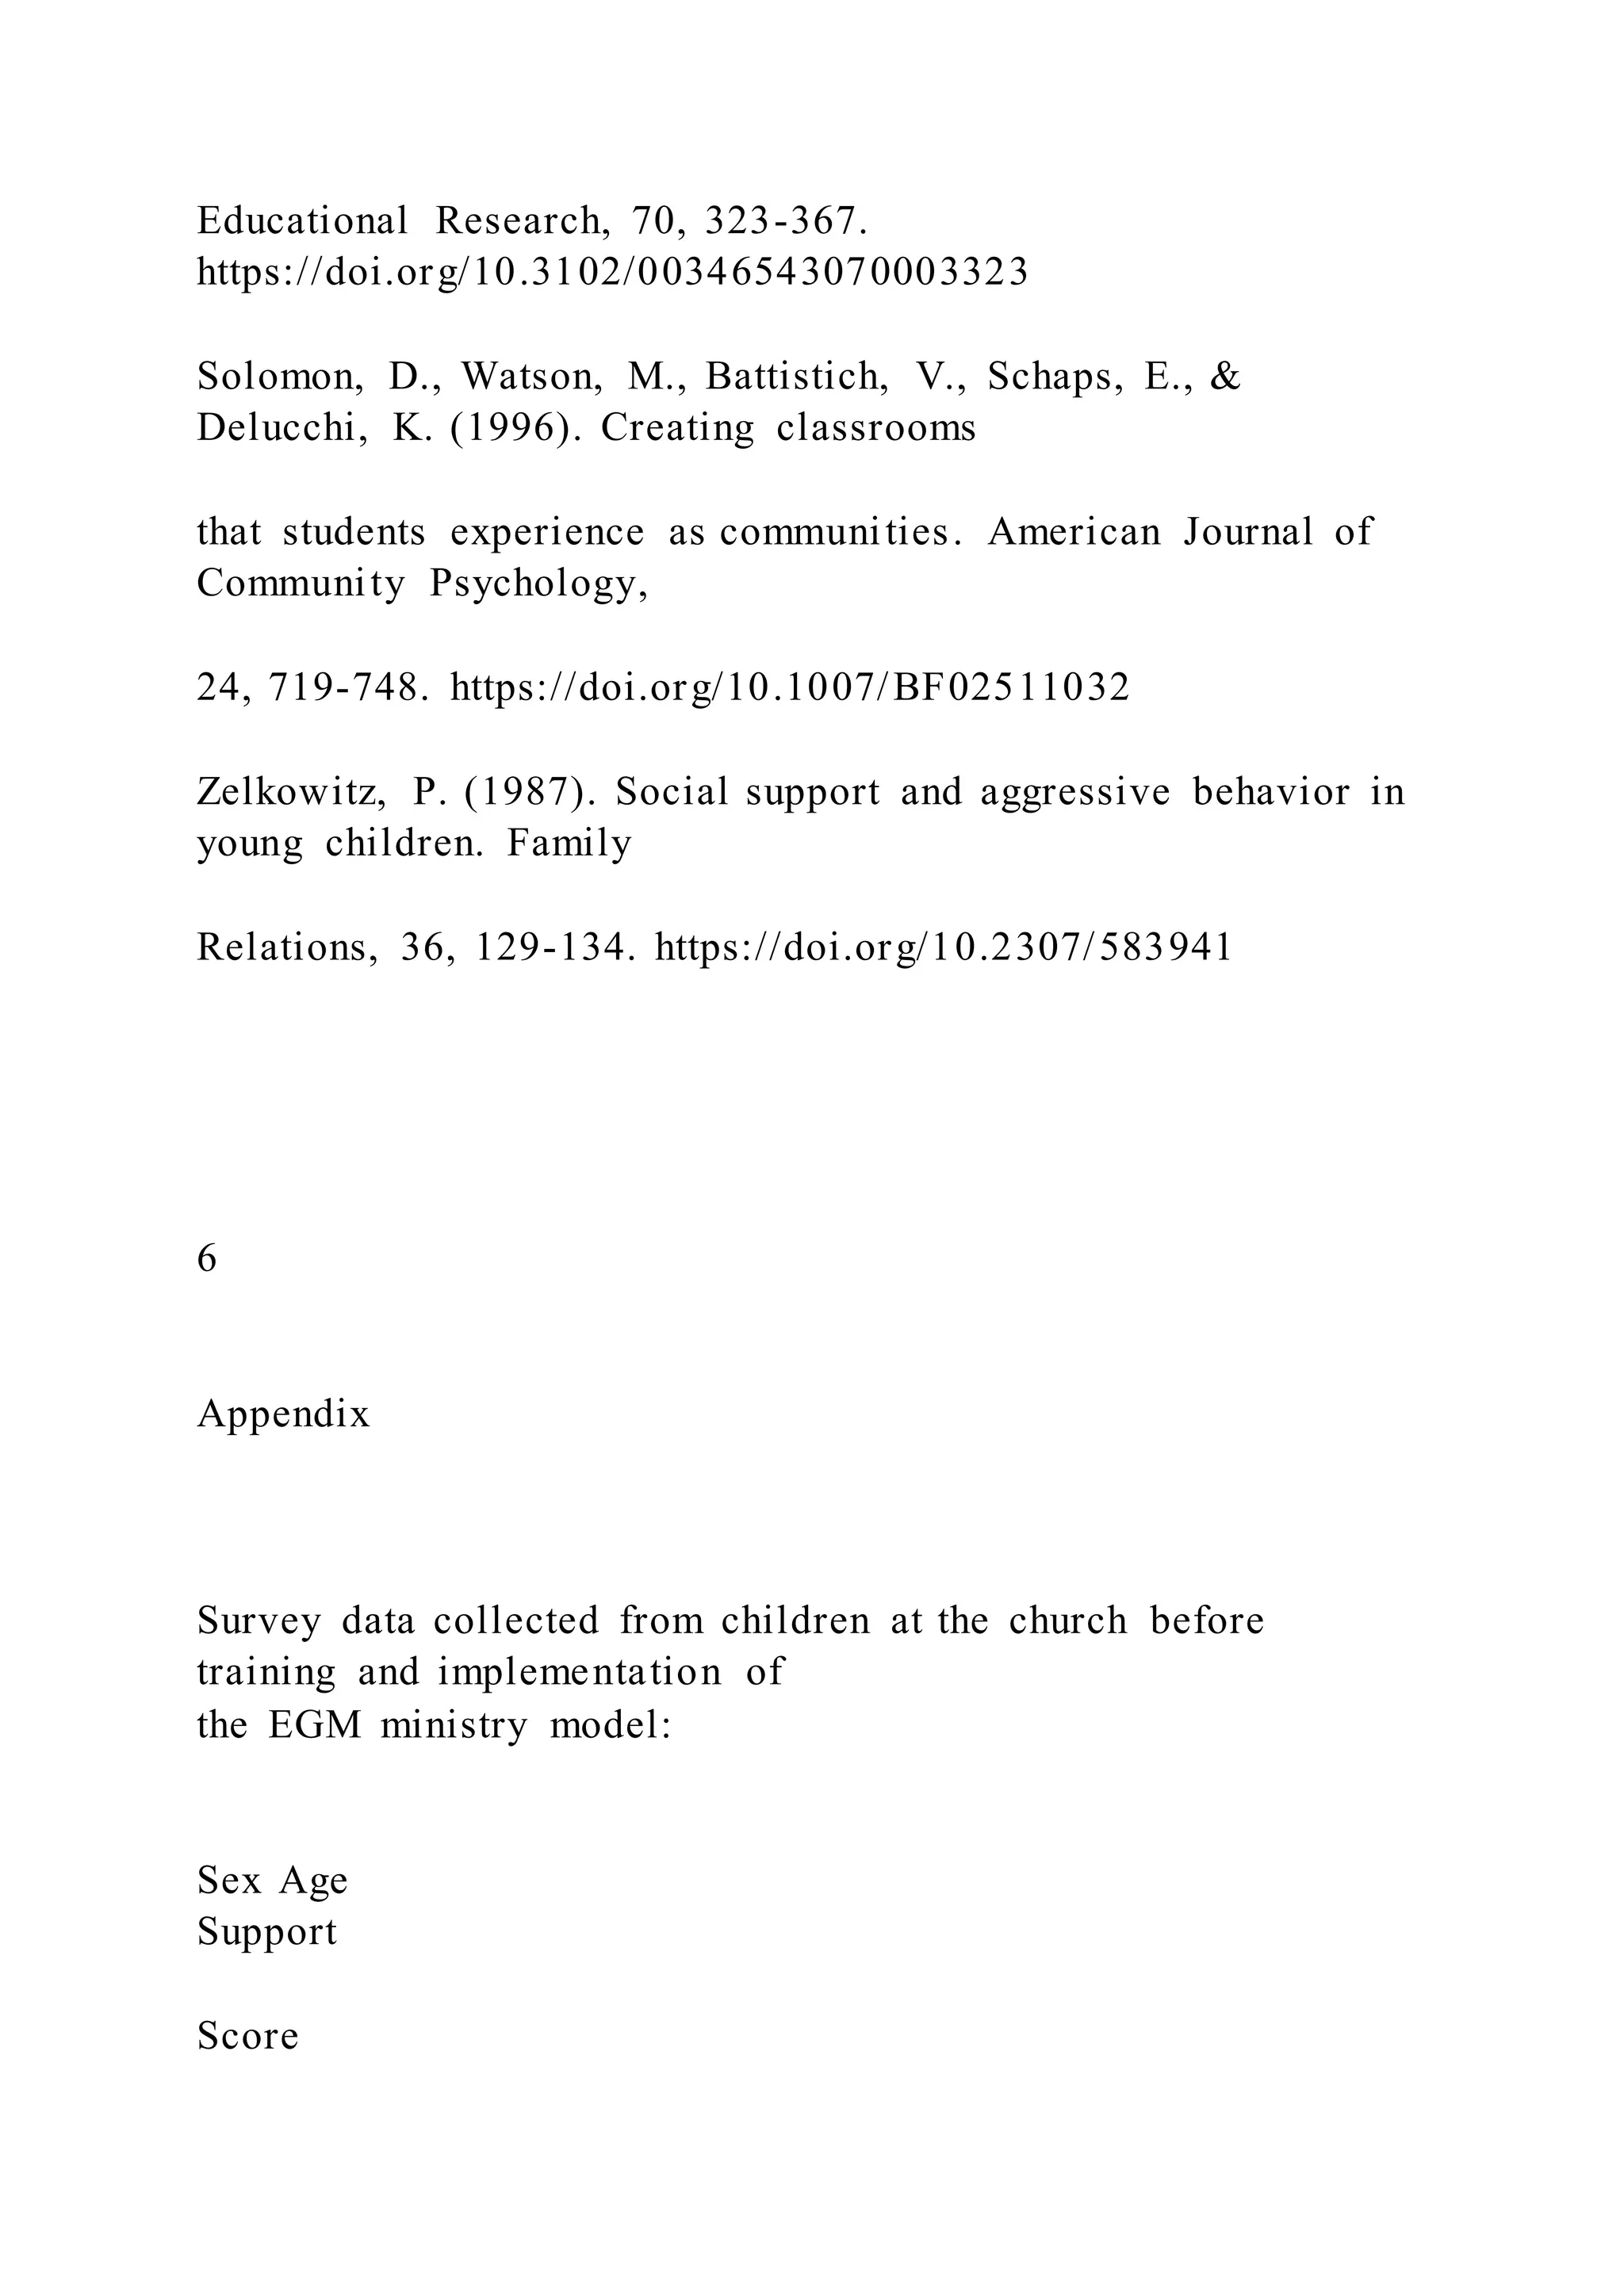
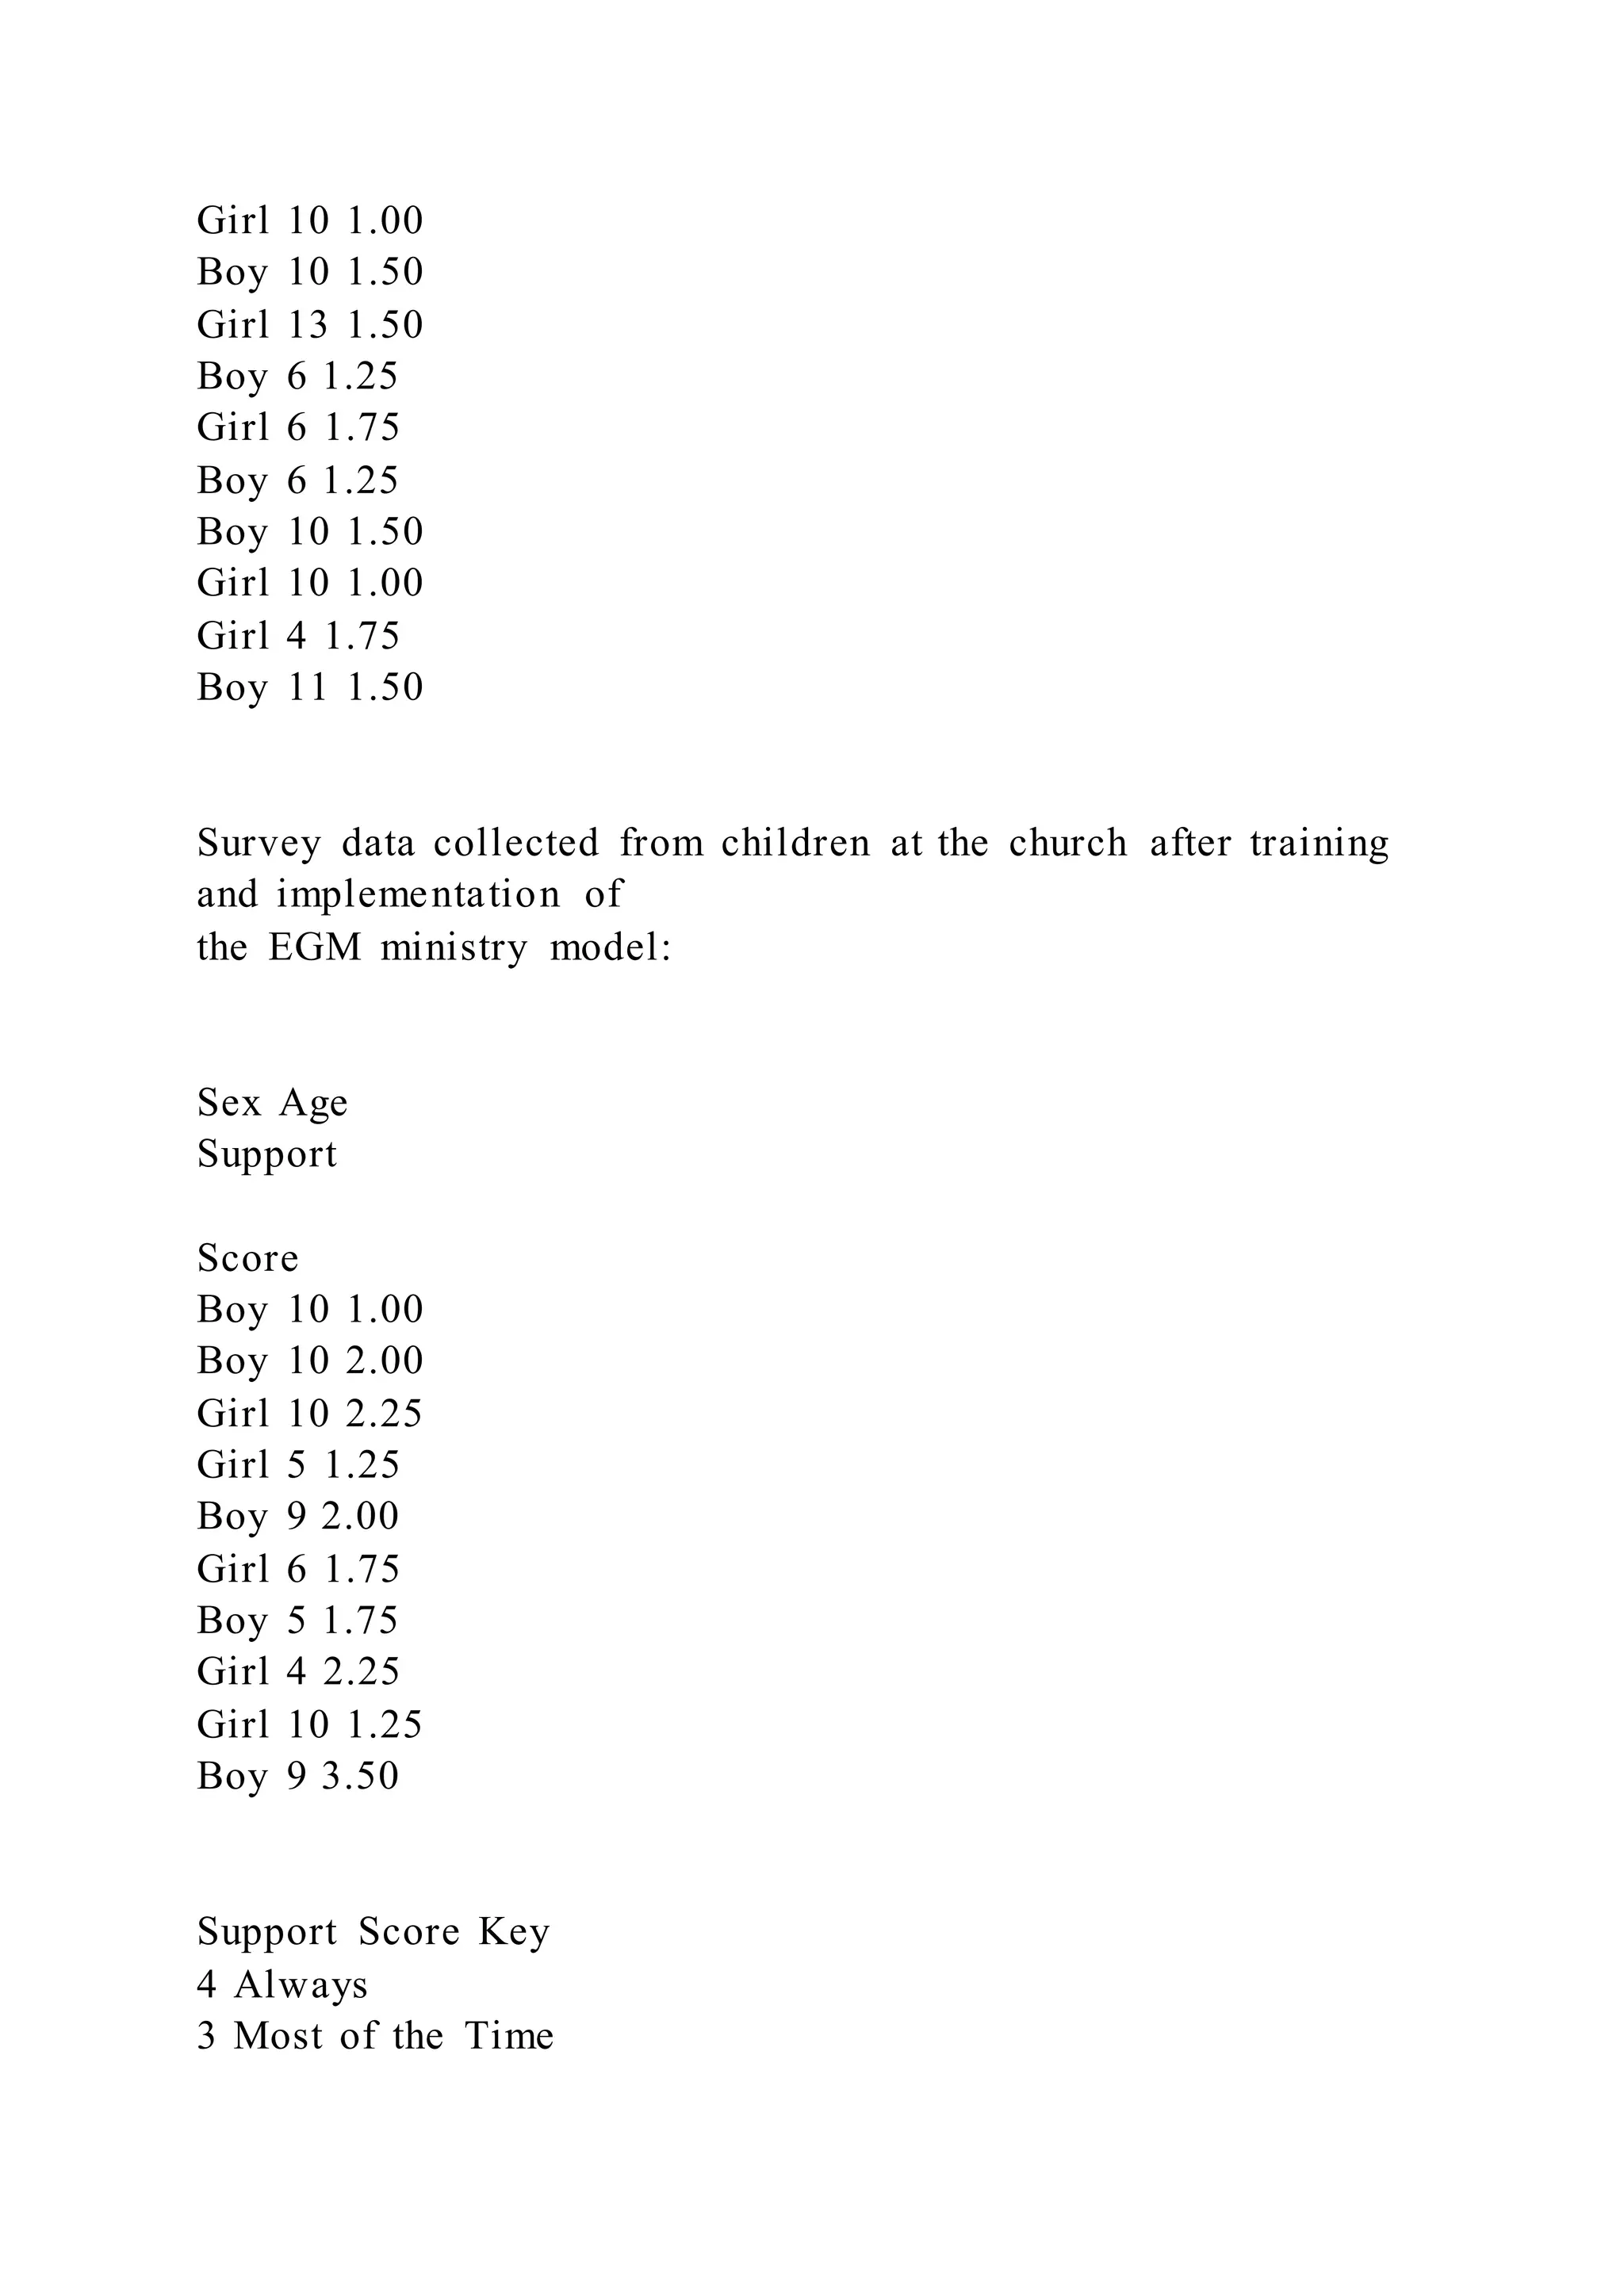
The document outlines a quantitative analysis project examining the role of social support, particularly from church-based children's ministry, in promoting well-being among children and adolescents. It details a pilot study conducted in Chile assessing the effects of a relationship-based ministry model implemented in a local church, measuring constructs such as social support and prosocial behavior before and after the intervention. The study intends to evaluate the effectiveness of the Every Generation Ministries model in enhancing children's relational quality with peers and adults.
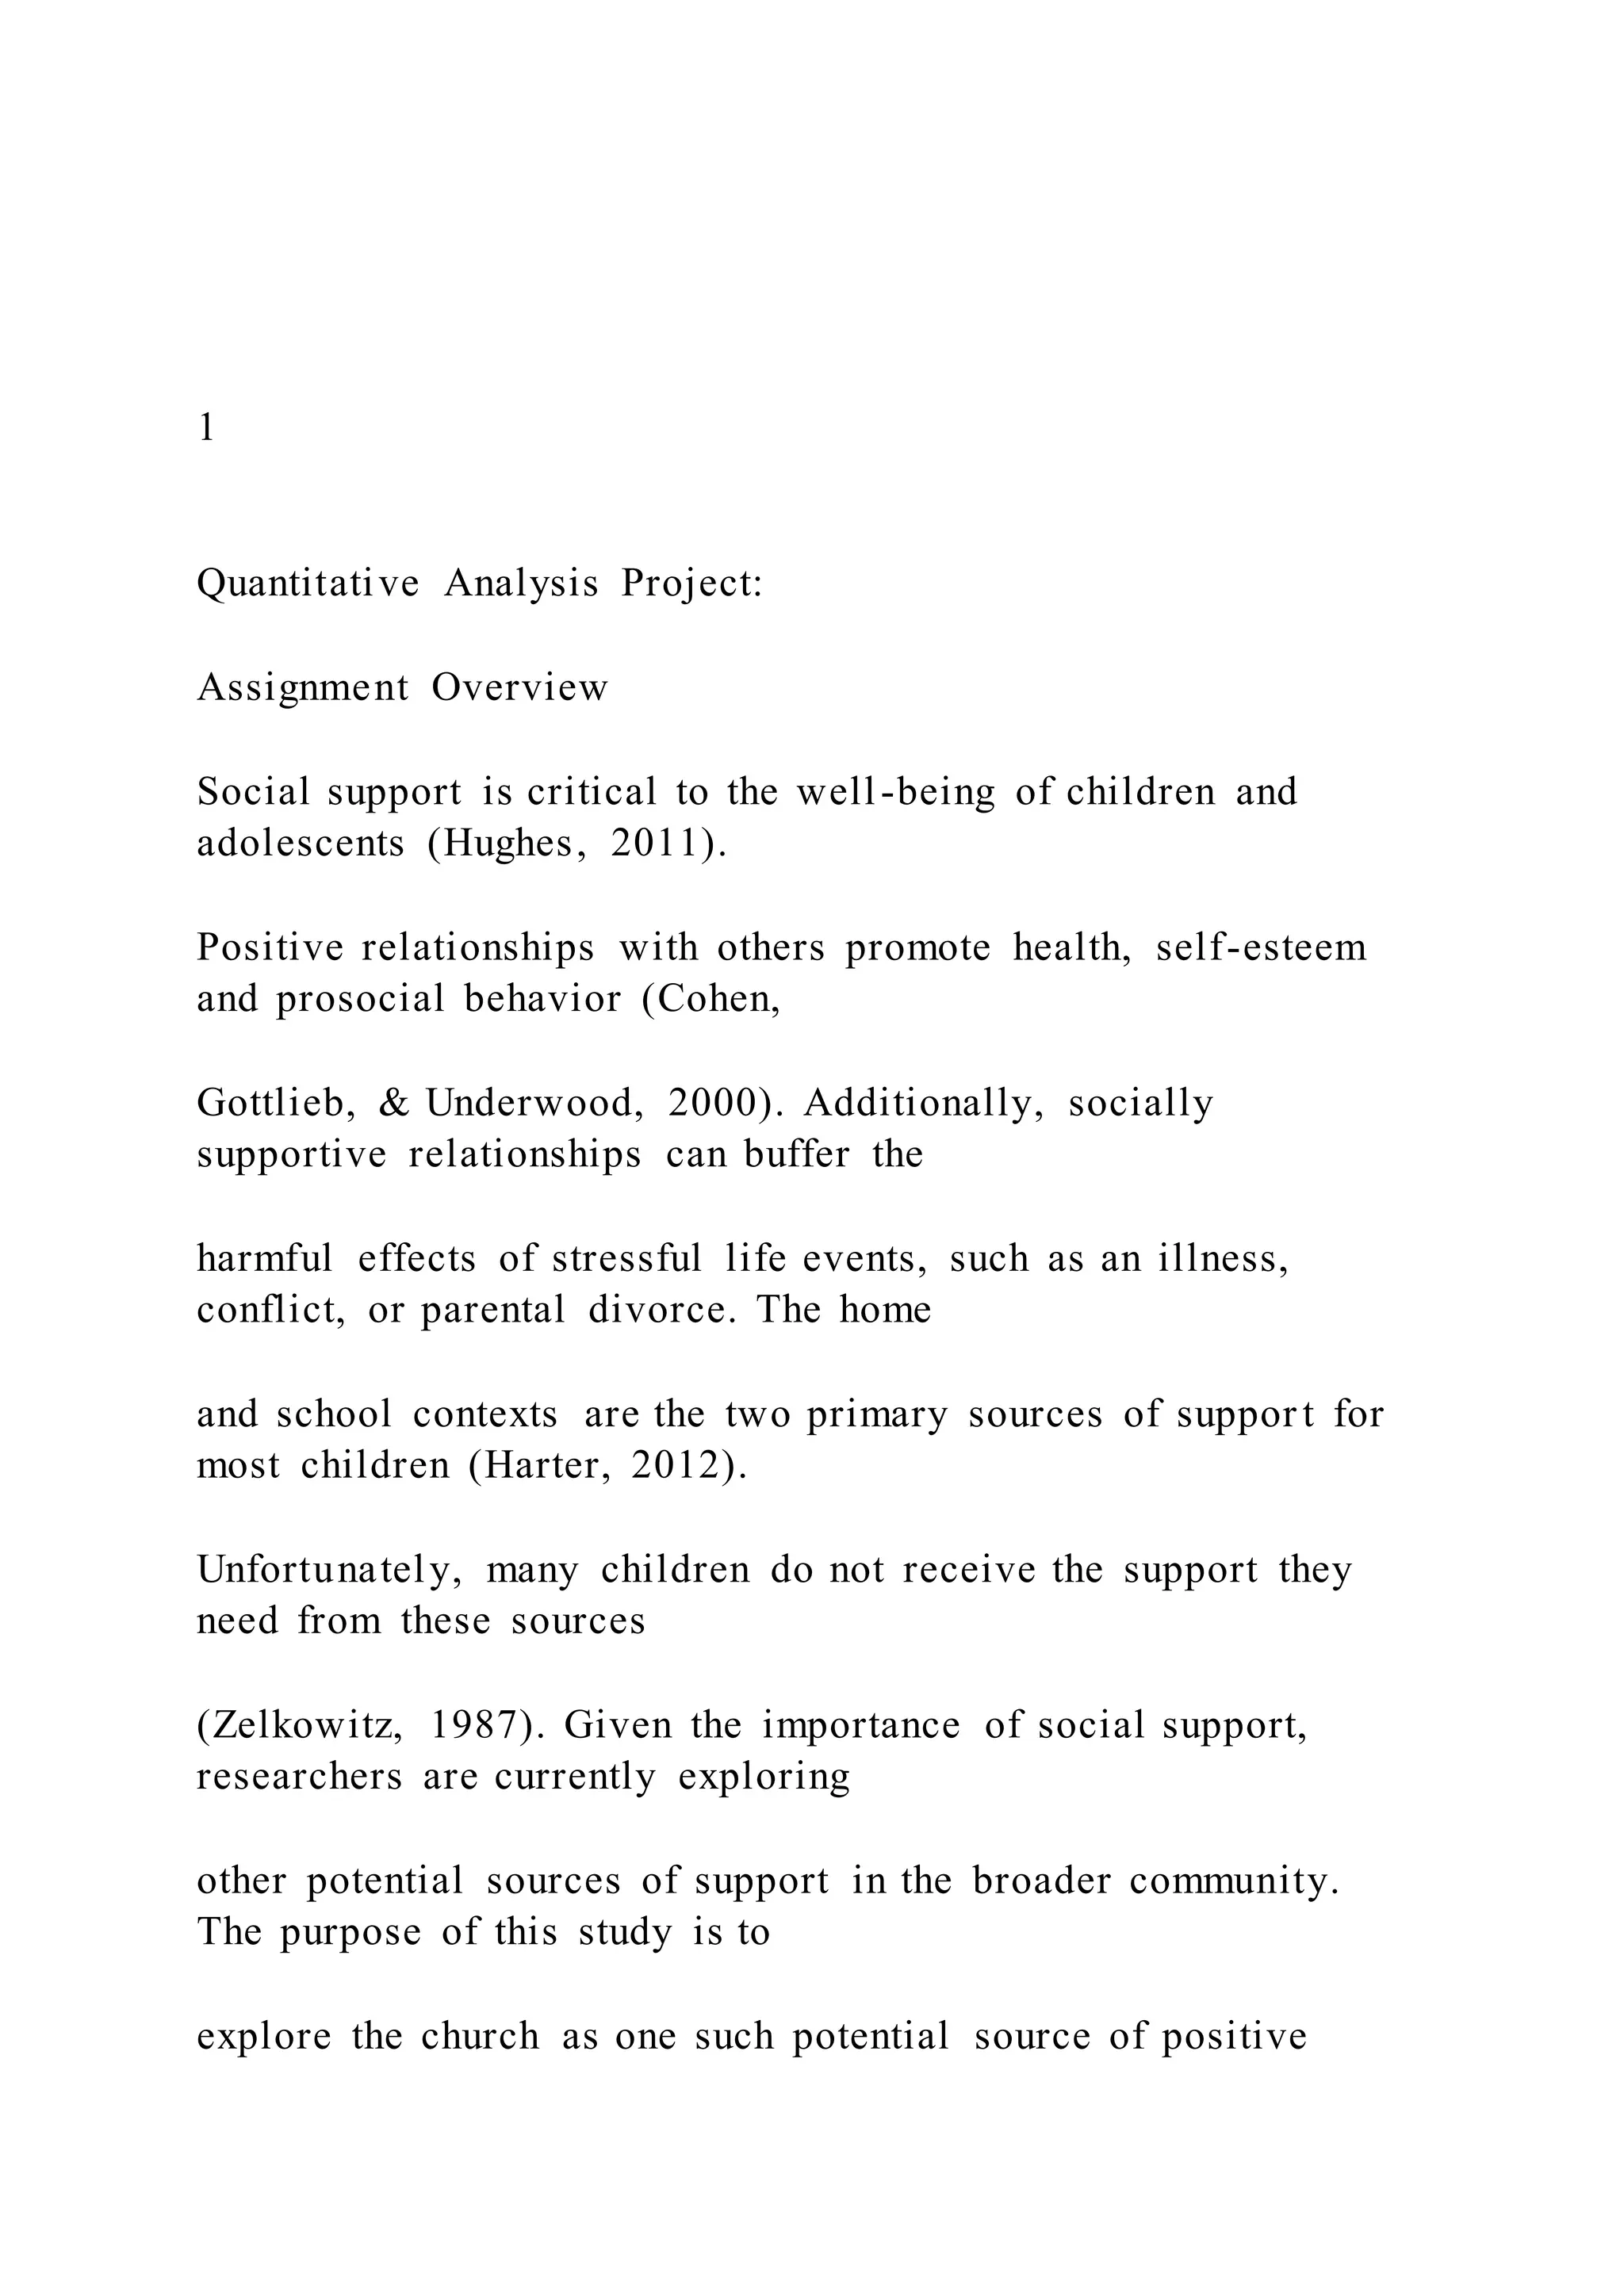


![2 Sometimes
1 Never
Title of Study
Student’s Name
University’s Name
Introduction
[briefly introduce the problem; establish the importance of the
problem]
[briefly state the goal of the study]
Literature Review
[briefly review the relevant literature; provide in-text citations
using APA format]
Hypothesis
[clearly state the hypothesis]
Method
Participants
[briefly describe the participants: number of participants, %
male, age range, average age, information unique to the sample]](https://image.slidesharecdn.com/1quantitativeanalysisprojectassignmentovervi-220919131533-e2651db4/75/1-Quantitative-Analysis-Project-Assignment-Overvi-12-2048.jpg)
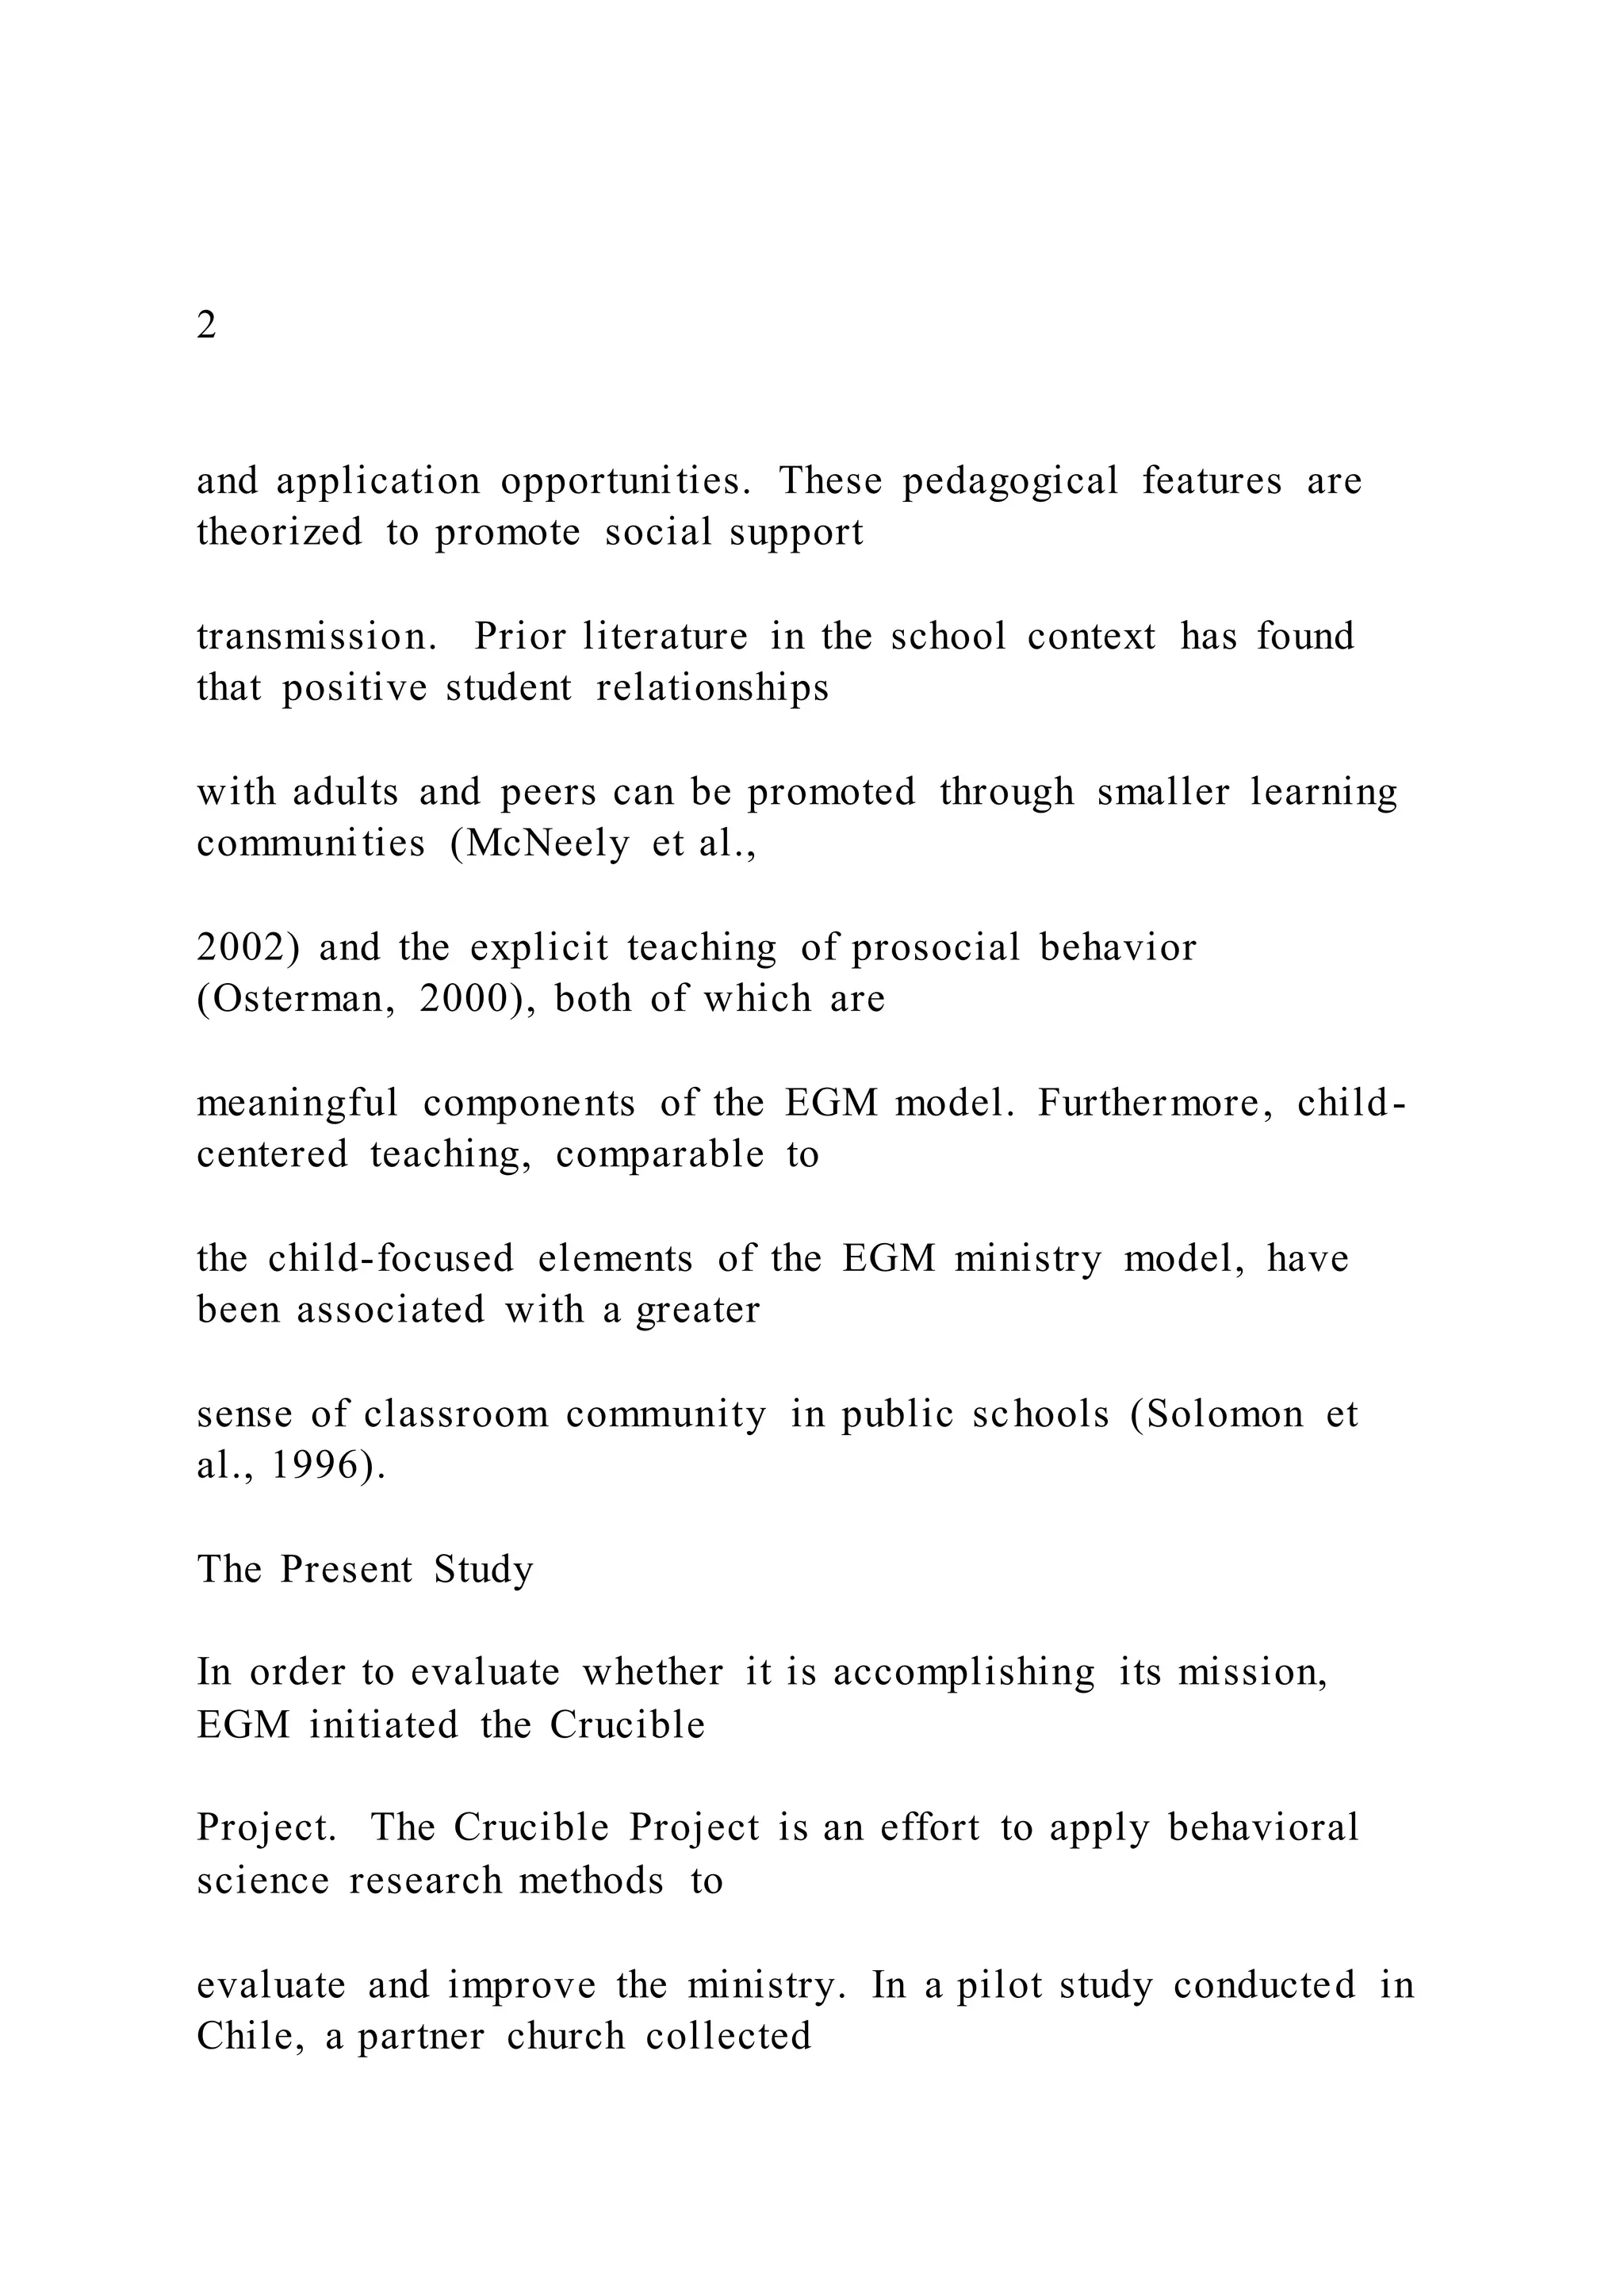
![Measure
[specify variable/construct being measured; provide name of
instrument, response options, sample item, and validity
information]
Procedure
[briefly describe the procedure by which data were collected]
Analytic Method
[briefly describe how the data will be analyzed]
Results
Descriptive Statistics
[report appropriate values rounded to the hundredths place;
interpret table]
[insert SPSS output here]
Descriptive Statistics
[interpret bar chart]
[insert SPSS output here]
Discussion
Summary of Results
[provide a brief summary of the key finding]
[state explicitly whether the hypothesis was supported]](https://image.slidesharecdn.com/1quantitativeanalysisprojectassignmentovervi-220919131533-e2651db4/75/1-Quantitative-Analysis-Project-Assignment-Overvi-13-2048.jpg)
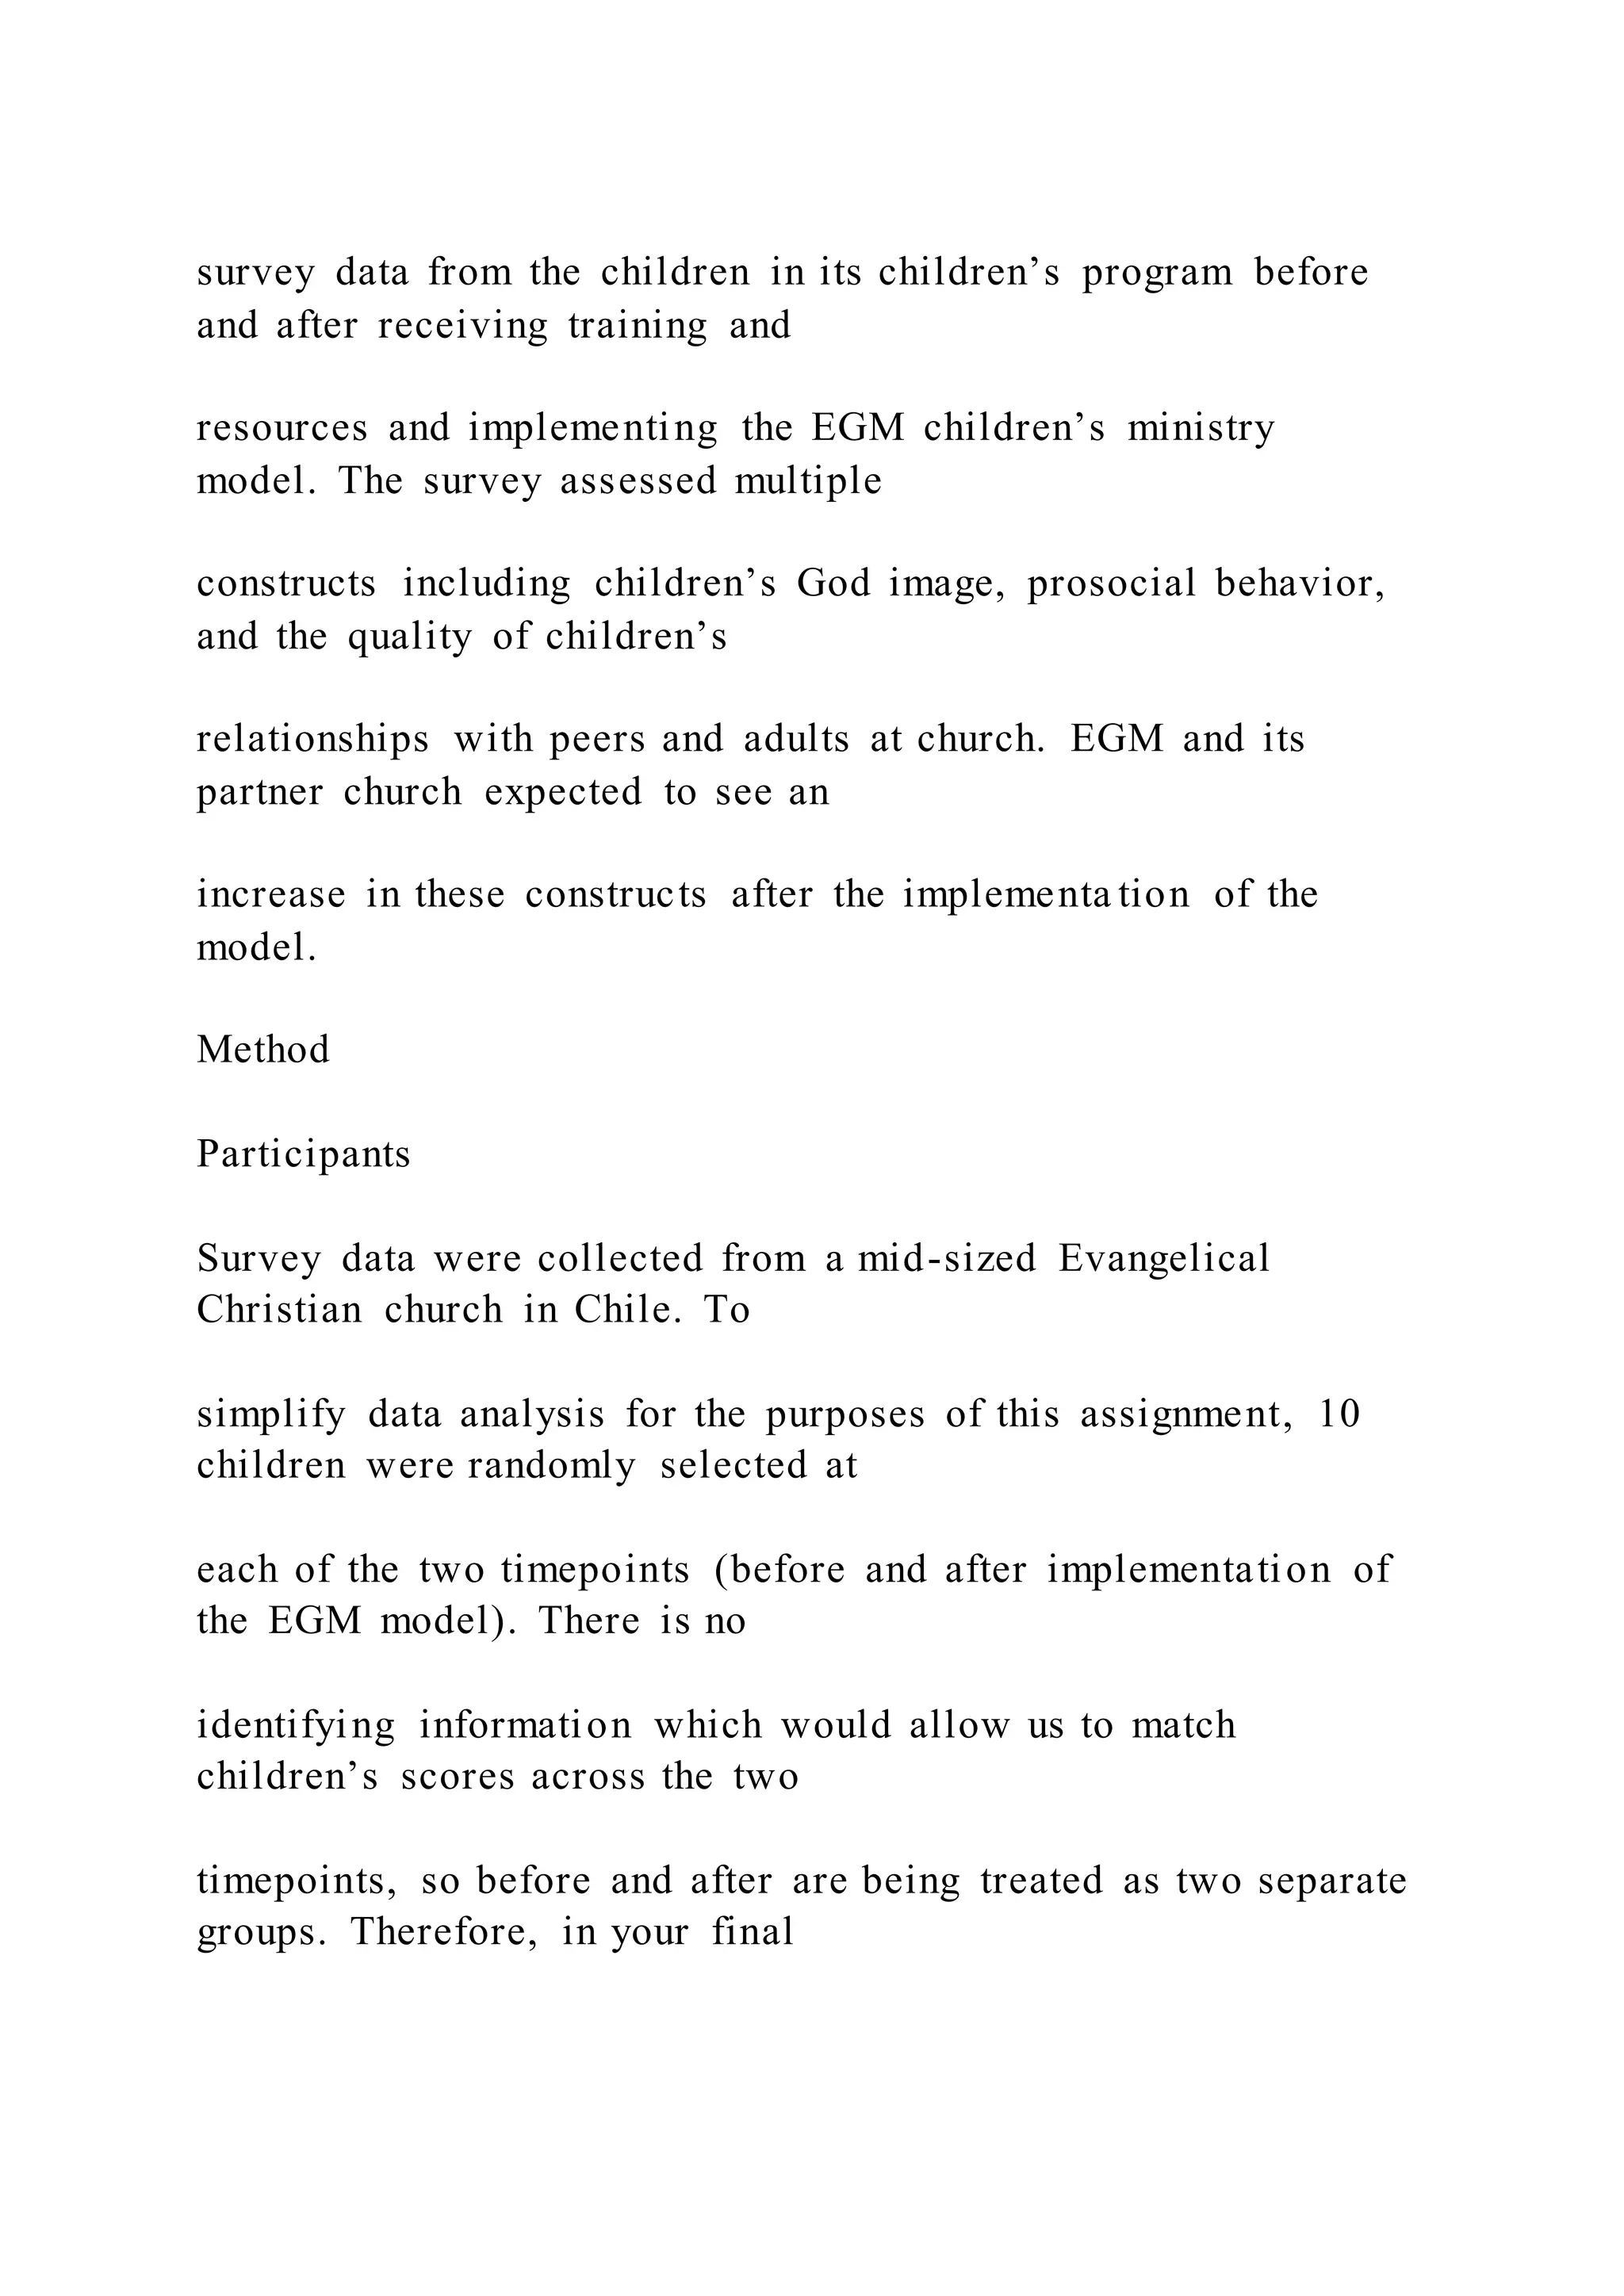
![Results in Light of Prior Literature
[explicitly state whether results were consistent with prior
literature; cite relevant articles as appropriate]
Implications
[provide at least one specific suggestion for practice]
Suggestions for Future Research
[provide at least one specific suggestion for a logical follow-up
study]
References
[provide references for all of the articles cited in the
presentation; use APA format except for the hanging indents]
Graph Step 1:
Graph Step 2:
Graph Step 3:
Table: Compare Means of 2 Groups
Grap](https://image.slidesharecdn.com/1quantitativeanalysisprojectassignmentovervi-220919131533-e2651db4/75/1-Quantitative-Analysis-Project-Assignment-Overvi-14-2048.jpg)