Study on Treatment of Municipal Solid Waste Landfill Leachate by Fenton Process
ChAL Composites
1. Development of novel chitosan–lignin composites for adsorption of dyes
and metal ions from wastewater
Vaishakh Nair a
, Ajitesh Panigrahy a
, R. Vinu a,b,⇑
a
Department of Chemical Engineering, Indian Institute of Technology Madras, Chennai 600036, India
b
National Center for Combustion Research and Development, Indian Institute of Technology Madras, Chennai 600036, India
h i g h l i g h t s
Chitosan–lignin composites with
enhanced surface and chemical
properties were developed.
Weak hydrogen bonding interactions
between chitosan and lignin were
established via FTIR.
Chitosan–lignin (50:50) composite
exhibited high rates of removal of
dyes and Cr(VI).
Adsorption of Remazol Brilliant Blue
R and Cr(VI) followed second order
kinetics.
The active sites and the mechanism of
adsorption on the composite are
unravelled.
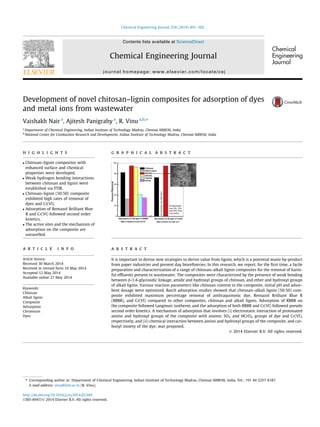
g r a p h i c a l a b s t r a c t
a r t i c l e i n f o
Article history:
Received 30 March 2014
Received in revised form 10 May 2014
Accepted 12 May 2014
Available online 27 May 2014
Keywords:
Chitosan
Alkali lignin
Composite
Adsorption
Chromium
Dyes
a b s t r a c t
It is important to devise new strategies to derive value from lignin, which is a potential waste by-product
from paper industries and present day biorefineries. In this research, we report, for the first time, a facile
preparation and characterization of a range of chitosan–alkali lignin composites for the removal of harm-
ful effluents present in wastewater. The composites were characterized by the presence of weak bonding
between b-1,4-glycosidic linkage, amide and hydroxyl groups of chitosan, and ether and hydroxyl groups
of alkali lignin. Various reaction parameters like chitosan content in the composite, initial pH and adsor-
bent dosage were optimized. Batch adsorption studies showed that chitosan–alkali lignin (50:50) com-
posite exhibited maximum percentage removal of anthraquinonic dye, Remazol Brilliant Blue R
(RBBR), and Cr(VI) compared to other composites, chitosan and alkali lignin. Adsorption of RBBR on
the composite followed Langmuir isotherm, and the adsorption of both RBBR and Cr(VI) followed pseudo
second order kinetics. A mechanism of adsorption that involves (i) electrostatic interaction of protonated
amino and hydroxyl groups of the composite with anionic SO3
À
and HCrO4
À
groups of dye and Cr(VI),
respectively, and (ii) chemical interaction between amino and hydroxyl groups of the composite, and car-
bonyl moiety of the dye, was proposed.
Ó 2014 Elsevier B.V. All rights reserved.
http://dx.doi.org/10.1016/j.cej.2014.05.045
1385-8947/Ó 2014 Elsevier B.V. All rights reserved.
⇑ Corresponding author at: Department of Chemical Engineering, Indian Institute of Technology Madras, Chennai 600036, India. Tel.: +91 44 2257 4187.
E-mail address: vinu@iitm.ac.in (R. Vinu).
Chemical Engineering Journal 254 (2014) 491–502
Contents lists available at ScienceDirect
Chemical Engineering Journal
journal homepage: www.elsevier.com/locate/cej
2. 1. Introduction
Lignin, an amorphous, crosslinked and aromatic polymer, is nat-
urally found in biomasses, and is also a major non-sugar compo-
nent of wood [1]. Lignin is well known as a waste by-product
from pulp and paper industries. However, it is also a major reject
from the present day biorefineries that produce cellulosic ethanol
after the separation of cellulose and hemicellulose in the pretreat-
ment step. Lignin is composed of propyl-phenolic subunits
containing phenolic, hydroxyl, carbonyl, methoxy and aldehyde
groups that serve as potential active sites for adsorption of dyes
and metal ions [2–4]. The composition and structural units of lig-
nin differ depending on the source of biomass from which lignin
is extracted. In paper industries, depending upon the pulping pro-
cess, different types of lignins are obtained as waste by-products.
The waste alkali lignin produced from kraft pulping process is inert
and is usually burnt for power [1,5], eventhough its rich chemical
functionality can be utilized in a better way to produce composites
and value added chemicals. Reuse of lignin will not only reduce the
amount of the biowaste, but also provide additional revenue to the
industries [1]. Recently, lignin has found applications in the form of
adhesives, tanning agents and as a precursor for producing acti-
vated carbon, which is a well known adsorbent [6]. This work aims
at modifying lignin for use as an adsorbent for waste water
decontamination.
Wastewater discharge from dye, paint, paper, textile and elec-
troplating industries contain harmful chemicals like dyes and
metal ions, which pollute the water bodies. The presence of very
low concentrations of even 10 ppm of dyes in water imparts a
color, making it undesirable for use [7]. The reactive dyes that
are discharged into the water bodies are not biodegradable, and
hence, are toxic to aquatic life. Remazol Brilliant Blue R (RBBR) is
an anthraquinonic dye used widely in paints, inks, chemical indica-
tors, dyeing of cottons, silk and as a starting material in the produc-
tion of polymeric dyes [8]. Similarly, hexavalent chromium, Cr(VI),
is mostly generated by chemical processes like electroplating,
leather tanning, pigment manufacturing and mining [9]. Chro-
mium metal ion exists in two valence states, viz., Cr(III) and Cr(VI),
of which the latter is highly toxic and carcinogenic [10].
Adsorption is one of the superior physicochemical methods for
wastewater detoxification compared to other methods like coagu-
lation, ion exchange, oxidation, chemical precipitation, electrode-
position and membrane separation, owing to high removal
efficiency for different types of effluents, ease of operation, avail-
ability of a variety of cheap adsorbents, and the absence of sludge
and harmful by-product formation [11]. Recent investigations on
the removal of effluents by adsorption are focused on utilizing
readily available and cheap bio-based materials like maize [12],
agricultural waste [13], jute fiber [14], rice husk [15] and mango
seed [16]. Table 1 [4,13,15,17–22] presents a summary of adsorp-
tion capacities of various bio-based materials for the removal of
dyes and metal ions. Researchers have utilized lignins extracted
by organosolv and kraft pulping processes for adsorption of dyes
and metal ions [4,17,18,23]. Typically, non-sulphonated lignins like
alkali lignin can be used as adsorbents owing to their insolubility in
water and high resistance to chemical reactions. However, the
structure of lignin varies based on the type of biomass (e.g. soft-
wood, hardwood, grassy), and hence, it is imperative that surface
modified lignins and lignin-based composites are developed as
potential adsorbent materials.
Chitosan, a copolymer obtained by deacetylation of chitin [24],
is a well known biosorbent used for the removal of various types of
pollutants like fluorides, dyes, heavy metal ions and organic com-
pounds found in waste water [19,25]. Chitosan is a copolymer of
2-glucosamine and N-acetyl-2-glucosamine units, wherein the
former constitutes a major fraction of the biopolymer chain. The
adsorption characteristics of chitosan are due to the large number
of hydroxyl (–OH) and primary amine (–NH2) groups that act as
highly active adsorption sites [26]. In acidic condition, the amine
groups are protonated and thereby aids in the adsorption of dye/
metal ion by electrostatic attraction. However, chitosan, as an
adsorbent, has some disadvantages such as dissolution in highly
acidic solution, low surface area, high cost, poor thermal and
mechanical properties [27]. Physical or chemical modification of
chitosan using different materials has been studied to improve
its properties and adsorption capacity. Chitosan composites such
as chitosan–cellulose [22], chitosan–zeolite [28], chitosan–polyan-
iline [29], and graphite oxide–magnetic chitosan [30] have been
developed that exhibit better adsorption together with enhance-
ment in other physical and chemical properties. The development
of chitosan-based biocomposites will bring down the overall cost
of the adsorbent owing to decrease in the use of expensive chito-
san, and provide an opportunity for utilizing the renewable by-
products produced in industries.
Development of biodegradable chitosan–alkali lignin compos-
ites for dye and metal ion adsorption is a new area of application
of alkali lignin. To the best of our knowledge, this is the first work
to report the removal of effluents from wastewater using chitosan–
alkali lignin composites with enhanced physicochemical proper-
ties. In this work, novel chitosan–alkali lignin composites were
prepared, and characterized using various techniques like Fourier
transform infrared spectroscopy (FT-IR), thermogravimetric analy-
sis (TGA), scanning electron microscopy (SEM) and porosimetry to
establish the molecular structure, thermal stability, surface mor-
phology and specific surface area of the composites, respectively.
The adsorption of RBBR and Cr(VI) ion on chitosan, alkali lignin
and chitosan–alkali lignin composites was evaluated. Adsorption
conditions such as chitosan content in the composite, solution
pH and adsorbent concentration were optimized. Equilibrium
adsorption isotherms and adsorption kinetics were evaluated.
The dye and metal ion adsorbed composites were characterized
and the mechanism of adsorption of RBBR and Cr(VI) on the com-
posite active sites was proposed.
2. Experimental section
2.1. Materials
Chitosan (95% deacetylated) and Remazol Brilliant Blue R (C.I.
61200; C22H16N2Na2O11S3; MW 626.54 g molÀ1
) were purchased
Table 1
List of different biosorbents and their sorption capacity for adsorption of dyes and
metal ions as reported in literature.
Biosorbent Dye/metal
ion
Biosorption
capacity
(mg gÀ1
)
References
Lignin Cr(III) 17.97 [4]
Palm shell powder Reactive
Blue 21
24.86 [13]
Peroxide treated rice husk Malachite
Green
26.6 [15]
Tunisian activated lignin Methylene
Blue
147 [17]
Lignin from sugarcane bagasse Methylene
Blue
34.20 [18]
Chitosan Cr(VI) 7.94 [19]
Immobilized green algae
Scenedesmus quadricauda
RBBR 68 [20]
Garden Grass Cu(II) 58.34 [21]
Cellulose–chitosan composite Cu(II) 75.82 [22]
Chitosan–alkali lignin composite RBBR 111.11 This work
492 V. Nair et al. / Chemical Engineering Journal 254 (2014) 491–502
3. from Sisco Research Laboratories, India. Alkali lignin (CAS No.
8068051) was obtained from Sigma Aldrich. Orange G (C.I.
116230; C16H10N2Na2O7S2; MW 452.37 g molÀ1
) and Malachite
Green (C.I. 42000; C52H54N4O12; MW 927.02 g molÀ1
) were pur-
chased from S.D. Fine Chem., and Thermo Fisher Scientific, India,
respectively. Rhodamine B (C.I. 45170; C28H31CIN2O3; MW
479.02 g molÀ1
) and Alizarin Red S (C.I. 58005; C14H7NaO7S; MW
342.26 g molÀ1
) were obtained from HiMedia Laboratories, India.
Potassium dichromate (K2Cr2O7) was procured from Ranbaxy Fine
Chemicals, India. All the chemicals were used as received. All solu-
tions were prepared using double distilled water.
2.2. Preparation of chitosan–alkali lignin composites
A known concentration of alkali lignin was added to 100 mL of
double distilled water and stirred well. An aqueous solution of
chitosan was prepared in 100 mL of aqueous acetic acid (2% v/v)
and stirred well to form a homogeneous solution. The alkali lignin
solution was then added to the dissolved chitosan solution, and
stirred at 300 rpm for 3 h. The chitosan–alkali lignin mixture was
then filtered and dried at room temperature for 48 h. The compos-
ite was powdered and then washed with double distilled water.
The composite was then vacuum filtered using 0.45 lm nylon
membrane and finally dried at 100 °C for 3 h. Different concentra-
tions of chitosan:alkali lignin composites, viz., 5:95 wt.% (hence-
forth denoted as 5ChAL), 10:90 wt.% (10ChAL), 25:75 wt.%
(25ChAL), 50:50 wt.% (50ChAL) were prepared according to the
above procedure. Preparation of the composite using any further
higher concentration of chitosan resulted in the formation of a jelly
mass owing to high crosslinking. Importantly, the main aim of the
work is to utilize significant amounts of alkali lignin in the com-
posite to replace the costly chitosan, and hence, composites up to
50ChAL were subjected to further investigation.
2.3. Characterization of ChAL composites
The FT-IR spectra of the composites, chitosan and alkali lignin
were recorded in Agilent Cary 660 FT-IR spectrometer in the range
of 4000–400 cmÀ1
in transmittance mode with 16 scans, and a res-
olution of 4 cmÀ1
. The samples were analyzed in the form of KBr
pellets. Thermogravimetric analyses (TGA) of the composites,
chitosan, alkali lignin and physical mixtures were performed in
SDT Q 600 TGA (T.A. instruments) under nitrogen atmosphere
(100 mL minÀ1
) from 25 °C to 900 °C at a heating rate of
20 °C minÀ1
. In order to evaluate the apparent activation energy
of decomposition, 50ChAL, chitosan and alkali lignin were sub-
jected to TGA at multiple heating rates from 5 to 30 °C minÀ1
.
The surface morphology of the composites was characterized using
a Hitachi S-4800 High Resolution SEM. The specific surface area
and pore size of the materials were obtained by nitrogen adsorp-
tion–desorption isotherm at 77 K using Micromeritics ASAP 2020
porosimeter. Specific surface area and pore sizes were evaluated
using Brunauer Emmett Teller (BET) and Barrett Joyner Halenda
(BJH) methods, respectively. Energy dispersive X-ray analyses
(EDS) of the composites and Cr(VI)-adsorbed composite were per-
formed using JEOL JSM-7610F Field Emission SEM.
2.4. Batch experiments for dye and metal ion adsorption
A stock solution of 500 mg LÀ1
of RBBR was prepared and was
further diluted to obtain different concentrations from 10 mg LÀ1
to 300 mg LÀ1
. The adsorption experiments were carried out at
ambient temperature (27 ± 2 °C) using 50 mL of the dye solution
and 0.1 g of the adsorbent and continuously stirred at 250 rpm.
The natural pH of the dye solution was 5.9 ± 0.1. Aqueous solutions
of Cr(VI) of different concentrations were prepared by diluting
500 mg LÀ1
of K2Cr2O7 stock solution. The volume of metal ion
solution and the concentration of the adsorbent used were similar
to the experiments of dye adsorption. The adsorption experiments
of Cr(VI) were conducted at a pH of 2, as the percentage adsorption
of Cr(VI) for various chitosan composites was reported to be max-
imum at low acidic pH, while high alkaline pH favors the adsorp-
tion of Cr(III) [31,32]. Solution pH was regulated using 0.1 M HCl
and 0.1 M NaOH. Samples were withdrawn at periodic time inter-
vals from the reaction mixture, centrifuged at 3500 rpm and ana-
lyzed to determine the concentration using Shimadzu UV-1800
UV–Vis spectrophotometer. RBBR concentration was measured
by noting the decrease in absorbance of the peak at 595 nm, while
the concentration of Cr(VI) was measured similarly at 540 nm
using 1,5-diphenyl carbazide as the complexing agent [10]. The
experiments were repeated thrice and the uncertainty in concen-
tration at the end of adsorption was less than 5%. The amount of
dye or metal ion adsorbed, qt (mg gÀ1
), was calculated using the
following equation:
qt ¼ ðC0 À CtÞV=W ð1Þ
where C0 and Ct (in mg LÀ1
) denote initial concentration and con-
centration of the adsorbate after time t, W is the weight of the
adsorbent used (g), and V is the volume of the adsorbate solution
(L). The percentage removal of the adsorbate was calculated using
the following equation:
% Removal ¼ ðC0 À CtÞ Â 100=C0 ð2Þ
3. Results and discussion
3.1. Characterization of ChAL composites
3.1.1. FT-IR analysis
The FT-IR spectra of alkali lignin, chitosan and 50ChAL compos-
ite, as shown in Fig. 1, were analyzed to identify the key functional
groups responsible for the binding of alkali lignin and chitosan. A
broad peak at 3453–3362 cmÀ1
corresponding to stretching of phe-
nolic and aliphatic –OH group is observed for alkali lignin. The
peaks at 2939 and 2829 cmÀ1
are attributed to the stretching of
C–H bond present in the aromatic, methoxy and alkyl groups.
The peaks at 1596 and 1515 cmÀ1
are typical of aromatic C@C
stretching in the phenolic group of lignin [33]. The peaks at
1461, 1423 and 1367 cmÀ1
correspond to O–H bending of the
4000 3500 3000 2500 2000 1500 1000 500
-C-H stretching
%Transmittance
Wavenumber(cm-1)
Alkali lignin
Chitosan
50ChAL
-NH2
bending
-OH bending
-NH
bending
-C-Ostretching
-OH,-NH2
stretching
Fig. 1. FT-IR spectra of alkali lignin, chitosan and 50ChAL composite.
V. Nair et al. / Chemical Engineering Journal 254 (2014) 491–502 493
4. phenolic group. The peaks at 1270 and 1213 cmÀ1
are due to
C–O–C stretching in a-O-4 and b-O-4 linkages of alkali lignin,
respectively. The peaks at 1135 and 1085 cmÀ1
are due to C-O-C
stretching in the alkyl substituted ether. The peak at 624 cmÀ1
is
due to the S–C stretching in thioether group.
For chitosan, the presence of a broad peak at 3463–3362 cmÀ1
corresponds to the stretching of O–H and N–H bonds. The peaks
at 2927 and 2857 cmÀ1
are attributed to C–H stretching of the alkyl
group. The peak at 1654 cmÀ1
represents bending of N–H in pri-
mary amine group. Small peaks at 1560 and 1549 cmÀ1
are due
to bending of N–H of secondary amine. A peak at 1380 cmÀ1
corre-
sponds to C–H bending of alkyl group. The peaks at 1157 and
1084 cmÀ1
are related to C–O stretching in the b-1,4-glycosidic
linkage present in chitosan [30]. The peak at 669 cmÀ1
is due to
the out-of-plane bending of the O–H group. The FT-IR spectrum
of the 50ChAL composite had all the key features of alkali lignin
and chitosan with minor shifts and changes in peak intensities cor-
responding to the weak interaction between the two components
as shown in Table 2. The disappearance of peak at 1560–
1549 cmÀ1
present in chitosan and the change in intensity of the
peak of aromatic ring at 1596 cmÀ1
are due to the interactions
between aromatic ring of alkali lignin and the secondary amine
group of chitosan. There are shifts observed in the peaks
corresponding to C–O stretching from 1157 cmÀ1
to 1145 cmÀ1
of
b-1,4-glycosidic linkage in the chitosan, and 1085 cmÀ1
to
1074 cmÀ1
[29,34] of alkyl substituted ether of the alkali lignin.
These signify the interactions due to hydrogen bonding between
the hydroxyl of alkali lignin with b-1,4-glycosidic linkage of chito-
san, and the interaction of the alkyl substituted ether of alkali lig-
nin with hydroxyl group of chitosan. There was no significant
change in the peaks of primary amine, confirming no interaction
of primary amine groups of chitosan in the formation of the
composite.
Scheme 1 depicts the interactions present in chitosan–alkali lig-
nin composites as ascertained from FT-IR characterization. All the
interactions between chitosan and alkali lignin are likely due to
the formation of weak hydrogen bonds. The hydroxyl group pres-
ent in the phenolic ring of alkali lignin can interact with (a)
b-1,4-glycosidic oxygen (shown as dashed line 1 in Scheme 1)
and (b) hydroxyl group of chitosan (dashed line 3). A weak bond
is also formed between hydroxyl group of chitosan and methoxy
group of alkali lignin (dashed line 2). Finally, a weak interaction
between aromatic ring of alkali lignin and secondary amino group
of chitosan is also observed (dashed line 4).
3.1.2. Thermogravimetric analysis
Thermogravimetric weight loss curves of chitosan, alkali lignin,
composites and 50:50 physical mixture of chitosan and lignin
(50:50 Ch:AL(phys)) are depicted in Fig. 2(a). Initial weight loss
around 100 °C observed for chitosan, 50ChAL and the physical mix-
ture can be ascribed to the removal of physisorbed moisture from
the samples. Final weight losses observed for various samples at
900 °C follows the order: chitosan (78%) 50:50 Ch:AL (phys)
(67%) 5ChAL (64%) 50ChAL (63%) 10ChAL (62%) % 25ChAL
(62%) alkali lignin (59%). It is clear that lower extent of decompo-
sition occurs in the composites owing to the presence of lignin that
leads to the formation of a crosslinked and condensed matrix of
aromatic structures at high temperatures. In order to ascertain
the temperature range of decomposition of these materials, differ-
ential weight loss profiles were plotted as depicted in Fig. SI 1 (in
Supplementary data). It is clear that chitosan exhibits a single-step,
sharp decomposition in the temperature range of 210–410 °C
while alkali lignin and 50ChAL decompose in a wide temperature
range of 140–600 °C. The composite also exhibits a higher percent
degradation in the temperature range of 200–330 °C compared to
alkali lignin. Interestingly, the physical mixture decomposes in
the range of 150–500 °C, with a sharp peak at 305 °C. This temper-
ature corresponds to the maximum weight loss rate, as observed in
the differential weight loss profile. A similar peak was also
observed for chitosan at 308 °C. However, there is no sharp transi-
tion for alkali lignin and 50ChAL composite. This shows that in the
physical mixture the decomposition of individual components
shows an additive effect owing to the physically separated phases
of chitosan and alkali lignin. Nevertheless, the composite is homo-
geneous in terms of binding of chitosan and lignin via weak hydro-
gen bonds, and hence decomposes gradually without any signature
peak of chitosan. This also stands as evidence alongside FT-IR char-
acterization to prove that the synthesized composite contains
chemically integrated domains of chitosan and lignin. The differen-
tial weight loss profiles of chitosan and alkali lignin reported in this
work are in line with earlier reports [35,36].
In order to quantify the thermal stability of the composite with
respect to its constituents, chitosan and lignin, variation of appar-
ent activation energy of decomposition with conversion was eval-
uated using the integral isoconversional method of Kissinger–
Akahira–Sunose (KAS). The functional form of KAS method is given
by [37]:
ln
b
T2
a
!
¼ ln
Aa Á R
Ea Á ln½ð1 À aÞÀ1
Š
!
À
Ea
R Á Ta
ð3Þ
where b denotes sample heating rate, Ta, Ea and Aa denote temper-
ature, apparent activation energy and pre-exponential factor at a
fixed value of conversion, a, respectively. This equation corresponds
to first order decomposition of the material in the conversion range
of 20–50% [37]. This method involves determining the temperature
at various chosen values of conversion at different heating rates,
and plotting ln(b/Ta
2
) versus 1/Ta. The slopes of the curves at differ-
ent conversion levels yield Ea. Fig. SI 2(a–c) (see Supplementary
data) depict the KAS plots for alkali lignin, chitosan and 50ChAL
composite. Fig. 2(b) depicts the variation of Ea with conversion for
the above three materials. It is clear that in the conversion range
of 30–45%, alkali lignin is thermally more stable than chitosan
and 50ChAL owing to higher Ea of 170–273 kJ molÀ1
. In the conver-
sion range of 30–40%, Ea of 50ChAL varies in the range of
140–165 kJ molÀ1
, while that of chitosan varies in the range of
152–169 kJ molÀ1
. Such low differences in apparent activation
Table 2
Key changes in FT-IR peaks of 50ChAL composite and their significance.
Wavenumber, cmÀ1
Functional group Interaction in 50ChAL
Peaks corresponding to chitosan in the composite
1654 Bending of N–H of primary amine Presence of peak
1560–1549 Bending of N–H of secondary amine Absence of peak
1157 C–O stretching in the b-1,4-glycosidic linkage Decrease in wavenumber by 12 cmÀ1
Peaks corresponding to alkali lignin in the composite
1596 Aromatic C@C stretching in the phenolic group Decrease in intensity of peak by 50%
1461, 1423, 1367 Bending of O–H of the phenolic group Decrease in wavenumber by 6, 5, 9 cmÀ1
1085 C–O–C stretching in the alkyl substituted ether Decrease in wavenumber by 11 cmÀ1
494 V. Nair et al. / Chemical Engineering Journal 254 (2014) 491–502
5. energy of c.a. 10 kJ molÀ1
(i.e. c.a. 2 kcal molÀ1
) is within the exper-
imental uncertainty involved in these calculations, and hence, it can
be concluded that 50ChAL composite and chitosan exhibit similar
thermal stability, while alkali lignin is more stable than the two.
Interestingly, chitosan–lignin composites reported by Chen et al.
[34] with low lignin content (30%) also exhibited a similar stability
to that of chitosan based on a qualitative analysis of differential
weight loss profiles.
3.1.3. Surface morphology and specific surface area analysis
The surface morphologies of chitosan, alkali lignin, 25ChAL and
50ChAL composites, studied using SEM, are shown in Fig. 3. It is
observed that the surface of chitosan is non-uniform and rough
with short fibrous structures, while the alkali lignin particles are
larger in size with sharp edges and lesser surface roughness. From
the SEM images of 25ChAL and 50ChAL composites (Fig. 3(c) and
(d)), the interfacial adhesion that binds the chitosan flakes on lig-
nin surface is very clear. The formation of chitosan agglomerates
on alkali lignin surface is clear at certain regions of the 50ChAL
composite. EDS analysis of 50ChAL composite (Fig. SI 3 in Supple-
mentary data) clearly shows the presence of various elements like
Na, Mg, Al, Si, S, K and Ca in trace quantities that originate predom-
inantly from alkali lignin.
Porosimetry was done to determine the specific surface area
and pore size distribution of chitosan, alkali lignin and 50ChAL
composite. Fig. SI 4 (in Supplementary data) depicts the adsorp-
tion–desorption isotherm of 50ChAL composite. From Table 3, it
can be observed that the surface area was 2.44 m2
gÀ1
for 50ChAL
composite, which is higher than that of both chitosan (2.1 m2
gÀ1
)
and alkali lignin (0.24 m2
gÀ1
). The specific surface area of chitosan
evaluated in this work matches well with the literature [25]. This
increase in surface area of the composite is primarily due to the
disintegration and transformation of the fibrous structure of chito-
san to a flaky structure during the preparation of the composite, as
confirmed by the SEM image of the 50ChAL composite. The average
pore diameter of 50ChAL composite is significantly lesser than that
of alkali lignin and comparable with that of chitosan. However the
+
O
OH
NH2
O
O
OH
OH
NH
O
O
O
OH
NH2
O
OH
CH3
n
O
OH
NH2
O
O
OH
OH
NH
O
O
O
OH
NH2
O
OH
CH3
n
Chitosan/Alkali Lignin Composite
Alkali lignin stirred in aqueous medium
Chitosan dissolved in 2% acetic acid solution
Stirred for 3 hours and dried at room temperature
OH
O
OH
O
OH
O
O
O
CH3
CH3
CH3
SHOH
H
O
O CH3
OH
CH3
OH
O
OH
O
OH
O
O
O
CH3
CH3
CH3
SHOH
H
O
O CH3
OH
CH3
OH
O
OH
O
OH
O
O
O
CH3
CH3
SHOH
H
O
O CH3
OH
CH3
CH3
Hydrogen bonding
1
2
3
4
Scheme 1. Preparation of chitosan–alkali lignin composite. The dashed lines show
the possible weak bonding between chitosan and alkali lignin.
100 200 300 400 500 600 700 800 900
20
40
60
80
100
20 25 30 35 40 45 50
50
100
150
200
250
300
50:50 Ch:AL(phys)
50ChAL
(b)
Alkali lignin
Samplemass(%)
Temperature(
o
C)
50ChAL
25ChAL
10ChAL
5ChAL
Chitosan
(a)
20 o
C/min
Apparentactivationenergy,
Ea(kJmol
-1
)
Conversion (mass%)
Alkali Lignin
Chitosan
50ChAL
Fig. 2. (a) Thermogravimetric curves of chitosan, lignin, ChAL composites and 50:50 physical mixture of chitosan and lignin (50:50 Ch:AL(phys)) at a heating rate of
20 °C minÀ1
. (b) Variation of apparent activation energy of decomposition of lignin, chitosan and 50ChAL with conversion evaluated by isoconversional KAS method.
V. Nair et al. / Chemical Engineering Journal 254 (2014) 491–502 495
6. average pore volume of 50ChAL composite is significantly higher
than that of alkali lignin and similar to chitosan. These changes
in pore dimensions may be attributed to the presence of crosslinks
between chitosan and alkali lignin in the composite. Importantly,
large pore volume enhances the adsorption of organic compounds,
as interactions between the key functional groups that are respon-
sible for adsorption will be better if the active site inside the pore is
well accessible to the organic compound.
3.2. Adsorption of dyes
3.2.1. Effect of chitosan composition
Fig. 4 depicts the percentage removal of 100 mg LÀ1
of RBBR
using seven different adsorbents namely chitosan, alkali lignin,
5ChAL, 10ChAL, 25ChAL, 50ChAL and 50:50 physical mixture of
chitosan and alkali lignin. The adsorption experiments were car-
ried out for a period of 3 h, corresponding to the attainment of
equilibrium at the natural pH of the solutions. It is clear that per-
centage removal of RBBR was more for 50ChAL composite when
compared to chitosan, alkali lignin and other ChAL composites.
The equilibrium adsorption capacity for chitosan, alkali lignin,
5ChAL, 10ChAL, 25ChAL and 50ChAL composites were,
41.31 mg gÀ1
, 16.23 mg gÀ1
, 17.55 mg gÀ1
, 20.9 mg gÀ1
,
46.2 mg gÀ1
and 47.49 mg gÀ1
, respectively. Adsorption of RBBR
using the 50:50 physical mixture of chitosan: alkali lignin was also
studied. It is observed that only 71% of the dye was adsorbed at the
end of 3 h, as against 95% of adsorption achieved in the case of
50ChAL composite. This confirms that the high percentage removal
of the dye in presence of 50ChAL composite is due to the presence
of weak hydrogen bonding interactions between chitosan and
alkali lignin, and it is not essentially an additive effect of the pres-
ence of chitosan and alkali lignin. Additionally, it can be concluded
from the specific surface area analysis that high concentration of
surface active centers in 50ChAL composite compared to chitosan
and alkali lignin is responsible for the observed effect. Further
adsorption studies using all the ChAL composites, chitosan and
alkali lignin were performed for different dye concentrations and
it was observed that in all the experiments, 50ChAL composite
exhibited superior percent removal when compared to all other
adsorbents (Fig. SI 5 in Supplementary data). It is observed that
25ChAL composite also exhibits good percentage removal of RBBR
at equilibrium. However, the percentage removal decreases for ini-
tial dye concentrations greater than 100 mg LÀ1
. Therefore, further
experiments were conducted using 50ChAL composite to evaluate
the effect of solution pH, adsorbent dosage and kinetics of
adsorption.
3.2.2. Effect of initial solution pH and adsorbent dosage
Solution pH is an important parameter that affects the adsorp-
tion of dyes. Solution pH determines the level of electrostatic or
molecular interaction between the adsorbent surface and the
adsorbate owing to charge distribution on the material. The surface
charge of alkali lignin, chitosan and 50ChAL composite was quan-
tified by zero point charge or isoelectric point (pHzpc) determined
by pH drift method [38]. From Fig. 5 (inset) it is clear that the pHzpc
of alkali lignin, chitosan and 50ChAL composite are 6.8 ± 0.2,
(c) 25ChAL composite (d) 50ChAL composite
chitosan
Alkali lignin
chitosan
Alkali lignin
(a) Chitosan (b) Alkali lignin
Fig. 3. SEM images of (a) chitosan (b) alkali lignin (c) 25ChAL (d) 50ChAL composite.
Table 3
Specific surface area, average pore size, average pore volume and isoelectric pH of the
adsorbents.
Adsorbent Specific surface
area (m2
gÀ1
)
Average pore
diameter (Å)
Average pore
volume
(cm3
gÀ1
)
Isoelectric
pH (pHzpc)
Alkali
lignin
0.2430 809.835 0.00082 8.4 ± 0.2
Chitosan 2.1039 415.854 0.01977 6.8 ± 0.2
50ChAL 2.4403 303.975 0.01464 2.4 ± 0.2
496 V. Nair et al. / Chemical Engineering Journal 254 (2014) 491–502
7. 8.4 ± 0.2 and 2.4 ± 0.2, respectively. This shows that at pH lesser
than 2.4, the surface of 50ChAL composite is positively charged
owing to protonation of amine and hydroxyl groups by the protons
in solution. Fig. 5 depicts the adsorption profiles of RBBR
on 50ChAL (2 g LÀ1
) at various pH. It is clear that under highly
acidic regime (pH = 2), the percentage removal was 98%
(qt = 24.65 mg gÀ1
), while in the alkaline regime (pH 7) the per-
centage removal was only 87% (qt = 21.9 mg gÀ1
). This shows that
under acidic conditions, the interaction between the protonated
amine and hydroxyl groups of the composite, and the anionic site
of the dye eventually leads to enhanced chemisorption of the dyes
onto the composite. At a pH of 8, which is higher than pHzpc, the
net surface charge becomes negative, and this results in repulsive
force between the dye and the composite. As the amino groups
of the composite are deprotonated, there is a net reduction in
the electrostatic interaction between the dye anion and the
composite, which also limits the chemical interaction between
the composite surface and the anionic site of the dye. At solution
pH of 4 and 5.9, the percentage removal of RBBR was same as that
under highly acidic conditions, i.e. c.a. 97% (qt = 24.23 mg gÀ1
).
Therefore, the natural pH of the solution, viz., 5.9, was chosen for
further kinetic studies.
Different amounts of 50ChAL composite from 1 g LÀ1
to 4 g LÀ1
were used to study the removal of 50 mg LÀ1
of RBBR. Fig. SI 6 (see
Supplementary data) shows that the percentage removal of RBBR
increased from 89% to 98% with an increase in adsorbent dosage
from 1 g LÀ1
to 4 g LÀ1
. The adsorption capacities, qt, for 1 g LÀ1
,
2 g LÀ1
and 4 g LÀ1
were evaluated to be 22.44 mg gÀ1
,
24.23 mg gÀ1
and 24.5 mg gÀ1
, respectively. It is well known that
an increase in adsorbent dosage increases the availability of
adsorption sites for the interaction of the dye with the composite
surface. As adsorption capacities for 2 g LÀ1
and 4 g LÀ1
dosages
of the composite were comparable, 2 g LÀ1
was chosen as the opti-
mum adsorbent dosage for further experiments.
3.2.3. Adsorption kinetics
The kinetics of adsorption of RBBR on the composite was eval-
uated by utilizing kinetic models that provide insights on the
mechanism and the rate limiting steps involved, i.e., whether
the adsorption is mass transfer controlled or reaction controlled.
The most commonly used kinetic models for studying solid–liquid
interactions are pseudo first order and pseudo second order mod-
els which are based on adsorption capacity. In pseudo first order
kinetic model, adsorption is controlled by diffusion and mass
transfer of the adsorbate to the adsorption site, whereas in pseudo
second order kinetic model, chemisorption is the rate limiting step
[24]. The adsorption kinetics of RBBR on chitosan and 50ChAL com-
posite was evaluated using pseudo first order and pseudo second
order models. The rate equations are given as follows [39]:
First order kinetic model :
dqt
dt
¼ k1ðqe À qtÞ ð4Þ
Second order kinetic model :
dqt
dt
¼ k2ðqe À qtÞ2
ð5Þ
where qe (mg gÀ1
) is the amount adsorbed corresponding to equilib-
rium, and k1 (hÀ1
) and k2 (g mgÀ1
hÀ1
) are pseudo first order and
pseudo second order rate constants of adsorption. The linearized
forms of the above rate equations are given by [40]:
First order kinetic model : logðqe À qtÞ ¼ log qe À k1t=2:303
ð6Þ
Second order kinetic model :
t
qt
¼
1
k2q2
e
þ
t
qe
ð7Þ
The kinetic parameters in the above models were determined
by plotting log (qe À qt) versus t and t/qt versus t, respectively.
The model values of qe were compared with the experimental val-
ues to confirm the validity of the model. From Fig. 6 it is observed
that the kinetics of RBBR adsorption for different initial concentra-
tions is best described by the pseudo second order kinetic model.
The determination coefficients for pseudo first order model were
as low as 0.7 for various initial concentrations, while it was more
than 0.99 for the pseudo second order model for all the initial con-
centrations of RBBR. From Table 4 it is clear that the model qe,cal
matches well with the experimental qe,exp. This supports that RBBR
adsorption on 50ChAL composite is due to chemisorption. Adsorp-
tion experiments were also performed at different temperatures to
verify if the mechanism is indeed chemisorption. Complete adsorp-
tion of 50 mg LÀ1
of RBBR on 2 g LÀ1
of 50ChAL composite was
achieved within 15, 5 and 2 min when the reaction temperatures
were 25 °C, 40 °C and 60 °C, respectively. It is also clear from
Table 4 that the rate constant, k2, decreases with increase in initial
dye concentration, which indicates that the driving force for RBBR
adsorption on 50ChAL composite shifts from chemisorption to a
mass transfer controlled regime at concentrations greater than
0.0 0.5 1.0 1.5 2.0 2.5 3.0
0
20
40
60
80
100
%Removal%Removal
Time (h)Time (h)
ChitosanChitosan
Alkali LigninAlkali Lignin
5ChAL5ChAL
10ChAL10ChAL
25ChAL25ChAL
50ChAL50ChAL
50:50 ChAL50:50 ChAL
Fig. 4. Percentage removal of RBBR using different adsorbents (dye
conc. = 100 mg LÀ1
; adsorbent dosage = 2 g LÀ1
).
8 pH8 pH
5.9 pH5.9 pH
2 pH2 pH
4 pH4 pH
0.0 0.5 1.0 1.5 2.0 2.5 3.0
0
20
40
60
80
100
0 2 4 6 8 10 12
0
2
4
6
8
10
12
FinalpHFinalpH
Initial pHInitial pH
ChitosanChitosan
Alkali LigninAlkali Lignin
50 ChAL50 ChAL
pH Drift MethodpH Drift Method
8.4pH8.4pHzpczpc
6.8pH6.8pHzpczpc
2.4 pH2.4 pHzpczpc
%Removal%Removal
Time (h)Time (h)
Fig. 5. Effect of initial solution pH on RBBR removal (dye conc. = 50 mg LÀ1
;
adsorbent dosage = 2 g LÀ1
) (Inset: pH drift plots of (a) chitosan (b) alkali lignin (c)
50ChAL composite).
V. Nair et al. / Chemical Engineering Journal 254 (2014) 491–502 497
8. 300 mg LÀ1
. Importantly, the rate constants for the adsorption of
RBBR of different initial concentrations on chitosan were signifi-
cantly lesser than that on 50ChAL composite. This quantifies the
higher efficiency of 50ChAL composite for the adsorption of RBBR
than chitosan. Second order kinetics of adsorption of dyes was also
evidenced earlier for different biosorbents like green algae Scene-
desmus quadricauda [20], polyaniline/chitosan composite [29],
and activated carbon from industrial fruit juice waste [40].
3.2.4. Adsorption isotherms
The equilibrium isotherm model is used to describe the interac-
tions between the adsorbate and adsorbent. The adsorption of
RBBR on chitosan and 50ChAL composite was studied using Lang-
muir and Freundlich isotherms. The Langmuir adsorption isotherm
is based on a monolayer surface coverage of the dye on the com-
posite that contains a finite number of adsorption sites of uniform
adsorption energies, whereas the Freundlich isotherm is utilized to
understand adsorption on heterogeneous surfaces and multiple
adsorption layers. Langmuir and Freundlich isotherms are
expressed by the following equations [41]:
Langmuir isotherm : qe ¼
KLqmaxCe
1 þ KLCe
ð8Þ
Freundlich isotherm : qe ¼ Kf C1=n
e ð9Þ
where Ce is the equilibrium concentration of adsorbate in the solu-
tion (mg LÀ1
), KL (L mgÀ1
) is the Langmuir constant related to max-
imum adsorption capacity and energy of adsorption, qmax (mg gÀ1
)
is the maximum adsorption capacity for monolayer formation, Kf
((mg gÀ1
) (L mgÀ1
)1/n
) is the Freundlich adsorption capacity and
nÀ1
is the adsorption intensity. The Langmuir and Freundlich
parameters can be determined using the following linearized form
of equations [41].
Langmuir isotherm :
1
qe
¼
1
qmax
þ
1
KLqmaxCe
ð10Þ
Freundlich isotherm : log qe ¼ log Kf þ ð1=nÞ log Ce ð11Þ
Kumar [41] evaluated various linear and non-linear forms of
equilibrium models to understand the adsorption of malachite
green onto lemon peel and found that the model parameters, KL
and qmax, obtained by using the linear form of the Langmuir model
as shown in Eq. (10) matched well with the parameters obtained
by non-linear fitting using Eq. (8). The Langmuir adsorption param-
eters were evaluated by plotting 1/qe vs 1/Ce. Fig. 7 depicts the
Langmuir plot of qe vs Ce for 50ChAL composite and it is clear that
the model matches well with the experimental data with a deter-
mination coefficient greater than 0.99. Moreover, the fit of the Fre-
undlich model with experimental data was poor with a low
determination coefficient (0.8). This confirms that adsorption
indeed follows monolayer surface coverage model of Langmuir.
The maximum adsorption capacity of RBBR on 50ChAL composite
was 111.11 mg gÀ1
while it was 76.92 mg gÀ1
for chitosan, which
shows that the composite exhibits 33% enhancement in the maxi-
mum adsorption capacity for monolayer formation. Moreover, the
Langmuir constant, KL, that signifies that the energy of adsorption
is higher (0.169 L mgÀ1
) for the adsorption of RBBR on 50ChAL than
that on chitosan (0.080 L mgÀ1
). This signifies the existence of
stronger bonds between RBBR and 50ChAL, and revalidates that
one of the dominant modes of adsorption is chemisorption. The
above observations prove that the surface of the composite is more
homogeneous than chitosan for adsorption of RBBR. Table 1 pro-
vides a list of biosorbents used for adsorption of different classes
of dyes and metal ions. It can be observed that the adsorption
capacity of 50ChAL composite for RBBR is superior to that of many
biosorbents reported in the literature.
Fig. 8 shows the adsorption of different dyes like Rhodamine B
(RB – xanthene fluorescence dye), Malachite Green (MG – triphe-
nylmethane dye), Orange G (OG – mono azo dye), Alizarin Red
(AZ.R – anthraquinonic dye) and RBBR on 50ChAL composite. It
can be observed that the percentage removal of anthraquinonic
dyes on the composite was more compared to other dyes. The per-
centage removal of RBBR and AZ.R were around 97% and 88%,
respectively, and this is mainly due to strong electrostatic and
chemical interaction of the anionic and ketonic groups present in
the anthraquinonic dyes with the amine and hydroxyl groups pres-
ent in 50ChAL composite. Importantly, c.a. 78% of MG (cationic)
and OG (anionic) were also adsorbed onto the composite, which
demonstrates that the composite can be utilized for the adsorption
of many other dyes. The adsorption of different class of dyes on the
composite is attributed mainly due to electrostatic interaction of
the dye with the different moieties present in the composite.
3.3. Adsorption of chromium(VI)
The adsorption efficiency of the composite towards metal ion
removal was evaluated using Cr(VI) as the model metal ion. From
0.5 1.0 1.5 2.0 2.5 3.0
0.00
0.05
0.10
0.15
0.20
0.25
25 mg L25 mg L
-1-1
50 mg L50 mg L
-1-1
100 mg L100 mg L
-1-1
200 mg L200 mg L-1-1
300 mg L300 mg L
-1-1
t/qt/qt
(hgmg(hgmg-1-1
)
Time (h)Time (h)
50ChAL50ChAL- RBBR- RBBR R2
0.990.99
Fig. 6. Pseudo second order adsorption kinetic model for 50ChAL composite
(adsorbent dosage = 2 g LÀ1
).
Table 4
Pseudo second order kinetic parameters for the adsorption of RBBR on 50ChAL
composite and chitosan, and Cr(VI) on 50ChAL.
Initial conc. (mg LÀ1
) qe,exp (mg gÀ1
) k2 (g mgÀ1
hÀ1
) qe,cal (mg gÀ1
)
RBBR on 50ChAL
25 12.13 2.45 12.28
50 24.23 0.48 24.71
100 47.49 0.10 50.12
200 74.87 0.08 77.58
300 95.93 0.12 98.32
RBBR on chitosan
25 10.29 1.38 12.71
50 23.07 0.09 25.36
100 41.31 0.064 44.76
200 67.83 0.066 69.93
300 85.74 0.115 88.73
Cr(VI) on 50ChAL
20 9.430 0.105 10.80
40 14.76 0.13 15.97
50 17.80 0.15 19.19
498 V. Nair et al. / Chemical Engineering Journal 254 (2014) 491–502
9. literature, it is clear that the adsorption of Cr(VI) is affected by the
pH of the reaction medium. Cr(VI) exists in the form of HCrO4
À
ions
in aqueous solution below a pH of 4, while at a pH above 4, it exists
as CrO4
2À
and Cr2O7
2À
anions [26]. It has been observed that the
adsorption of Cr(VI) is maximum at a pH less than 4. At a pH of
2, the composite is fully protonated, which results in a net positive
charge on the surface. This leads to electrostatic interaction
between the composite and HCrO4
À
ions. The percent removal of
Cr(VI) in presence of chitosan, alkali lignin and various ChAL com-
posites are shown in Fig. 9. The experiments were carried out with
20 mg LÀ1
of Cr(VI) for 6 h at a pH of 2. The percentage removal of
Cr(VI) was 95% for 50ChAL composite, while it was 73% for chito-
san and nil for lignin. From Fig. SI 7 (see Supplementary data), it
is clear that the percentage removal of 10 mg LÀ1
of Cr(VI) on
2 g LÀ1
of 50ChAL composite at pH of 2, 3.3 and 5 were 100%,
96% and 14%, respectively. Interestingly, it is observed that the
composites with less than 50% chitosan, viz., 5ChAL, 10ChAL and
25ChAL do not adsorb Cr(VI) even until 3 h. The maximum removal
of Cr(VI) at low pH was also observed in the case of different adsor-
bents like polyaniline–chitosan [31] and Fe-crosslinked chitosan
complex [42].
The adsorption profile of Cr(VI) on chitosan was erratic without
any trend, and this is attributed to an observation that is reported
to be unique for chitosan at highly acidic pH. It is reported that
chitosan dissolves in acidic medium, especially at a pH of 2 [26].
The dissolution of chitosan was visually observed in our experi-
ments, and after 6 h, the solution was homogeneous and chitosan
was not recovered in the solid form. It is well known that cellulose,
a polysaccharide with repeating glucose units, solubilizes at high
acid concentrations (pH $ 1–2) and results in the formation of glu-
cose at ambient temperature [43]. This is attributed to the hydro-
lytic cleavage of the glycosidic bonds present at the ends of the
chain under high H+
concentration. A similar reaction via unimo-
lecular nucleophilic substitution (SN1) also occurs in chitosan
under acidic conditions, where the glucosamine and acetyl gluco-
samine units are separated by the cleavage of the glycosidic bonds
[44]. Owing to depolymerization of chitosan, the low molecular
weight oligomers easily dissolve in the aqueous medium. Addition-
ally, Cr(VI) ion present in aqueous solution complexes with the
monomers and oligomers of chitosan. It was earlier shown that
chromium ions can complex with glucose in presence of ionic liq-
uids and catalyze glucose dehydration reactions [45]. It can hence
be discerned that the observed removal or reduction in concentra-
tion of Cr(VI) in presence of chitosan at a pH of 2 in Fig. 9 is not
because of adsorption of Cr(VI) onto the solid matrix of chitosan,
but complexation with monomers and oligomeric fragments of
chitosan in the aqueous phase. This validates the erratic variation
of Cr(VI) concentration.
Nonetheless, in the presence of 50ChAL composite, complete
recovery of the solid composite was achieved at the end of 6 h
reaction period at a pH of 2. This elucidates the chemical stability
of the composite over chitosan under harsh, acidic conditions.
Zhang et al. [46] also demonstrated a similar phenomenon,
wherein zirconium cross-linked chitosan composite was insoluble
in acidic solution, while chitosan dissolved completely. Fig. 10
depicts the EDS analysis of Cr(VI) adsorbed composite, which
0 20 40 60 80 100
0
20
40
60
80
100
qe
(mgg-1
)
Ce(mgL-1
)
Langmuir
Experimental
0.0 0.4 0.8 1.2 1.6
0.00
0.05
0.10
0.15
0.20
0.25
Chitosan
50ChAL
1/qe
(gmg-1
)
1/Ce(Lmg
-1
)
R
2
0.99
Adsorbent q
max
(mgg
-1
) K
L
(Lmg
-1
)
Chitosan 76.92 0.080
50ChAL 111.11 0.169
Fig. 7. Langmiur isotherm for adsorption of RBBR on chitosan and 50ChAL
composite (adsorbent dosage = 2 g LÀ1
; t = 3 h) (Inset: Linear Langmiur plot of
chitosan and 50ChAL composite).
0.0 0.5 1.0 1.5 2.0 2.5 3.0
0
20
40
60
80
100
%Removal
Time (h)
R.B (Xanthene fluorescence)
M.G (Triphenylmethane)
O.G (Mono azo)
AZ.R (Anthraquinone)
RBBR (Anthraquinone)
Fig. 8. Percentage removal of different dyes using 50ChAL composite (dye
conc. = 50 mg LÀ1
; adsorbent dosage = 2 g LÀ1
).
0 1 2 3 4 5 6
0
20
40
60
80
100
%Removal
Time(h)
Chitosan
Alkali Lignin
5ChAL
10ChAL
25ChAL
50ChAL
1 2 3 4 5 6
0.0
0.1
0.2
0.3
0.4
0.5
0.6
0.7
t/q
t
(hgmg
-1
)
Time(h)
20 mg L
-1
40 mg L
-1
50 mg L
-1
50ChAL
Cr(VI) conc. -20 mg L-1
Fig. 9. Adsorption of Cr(VI) on different adsorbents (Cr(VI) conc. = 20 mg LÀ1
;
adsorbent dosage = 2 g LÀ1
; pH = 2) (Inset: Pseudo second order kinetic model for
adsorption of Cr(VI) on 50ChAL composite).
V. Nair et al. / Chemical Engineering Journal 254 (2014) 491–502 499
10. confirms the presence of Cr(VI) that is partially localized on the
surface of chitosan in the composite. This clearly shows the role
of chitosan in the composite towards Cr(VI) adsorption. Fig. SI 8
(in Supplementary data) depicts the FT-IR of Cr(VI)-adsorbed
50ChAL composite collected at the end of 6 h period. All the key
peaks corresponding to lignin, chitosan and the interactions are
clearly observed. Hence, it can be concluded that the stability of
chitosan in the composite is improved owing to the weak bonding
with lignin as depicted in Scheme 1.
3.3.1. Adsorption kinetics
The kinetics of adsorption of Cr(VI) on 50ChAL composite was
studied using pseudo first order and pseudo second order kinetic
models that were used for RBBR. As shown in Fig. 9 (inset), Cr(VI)
adsorption on 50ChAL composite is best described by pseudo sec-
ond order kinetic model for different initial concentrations of 20,
40 and 50 mg LÀ1
with a determination coefficient greater than
0.98. The determination coefficient was as low as 0.75 for the first
order kinetic model. As shown in Table 4, model and experimental
adsorption capacities match well confirming that adsorption is
indeed pseudo second order. Our observations are in line with
previous reports of Cr(VI) adsorption on chitosan [19] and chitosan
coated with poly(3-methyl thiophene) [11] that also showed a
higher determination coefficient for pseudo second order kinetic
model.
3.4. Adsorption mechanism
FT-IR spectra of RBBR-adsorbed and Cr(VI)-adsorbed compos-
ites were analyzed to probe the mechanism of adsorption and pos-
sible active sites of the composite onto which dye and Cr(VI) are
adsorbed. It is evident from Fig. SI 8 (see Supplementary data)
and Table 5, that RBBR and Cr(VI) adsorbed composites exhibit
shifts in the peaks at 3453–3362, 1656, and 669 cmÀ1
, which cor-
respond to primary amine and hydroxyl groups in the 50ChAL
composite. These changes are due to interaction of the above
functional groups with the anion and carbonyl groups of the dye.
From the results of the equilibrium adsorption studies and FT-IR
spectra, the following specific reactions are proposed.
Electrostatic interaction of protonated amine and hydroxyl
groups of the composite with anion (SO3
À
) of the dye [29]
ð50ChALÞ-NH2 þ H3Oþ
À! ð50ChALÞ-NHþ
3 þ H2O ð12Þ
ð50ChALÞ-NHþ
3 þ Dye-SOÀ
3 À! ð50ChALÞ-NHþ
3 Á Á Á Á Á Á Á Á Á Á OÀ
3 S-Dye
ð13Þ
ð50ChALÞ-OH þ H3Oþ
À! ð50ChALÞ-OHþ
2 þ H2O ð14Þ
ð50ChALÞ-OHþ
2 þ Dye-SOÀ
3 À! ð50ChALÞ-OHþ
2 Á Á Á Á Á Á Á Á Á OÀ
3 S-Dye
ð15Þ
In the pH range of 6 and below, the following reaction between
carbonyl group of the dye with active amine of the 50ChAL com-
posite is possible. Chemical interaction of amine and carbonyl
Fig. 10. EDS analysis of Cr(VI) adsorbed 50ChAL composite (Inset: EDS Mapping of Cr(VI) on 50ChAL composite).
Table 5
Key changes in FT-IR peaks of RBBR-adsorbed and Cr(VI)-adsorbed 50ChAL.
Wavenumber,
cmÀ1
Interacting functional
groups
RBBR-
adsorbed
50ChAL
Cr(VI)-
adsorbed
50ChAL
3453–3362 Stretching of O–H, N–H
group of phenolic group,
primary amine
Increase in
wavenumber
by 30 cmÀ1
Increase in
wavenumber
by 20 cmÀ1
1654 Bending of N–H in
primary amine group
Absence of
peak
Decrease in
wavenumber
by 8 cmÀ1
669 Out-of-plane bending of
O–H
Absence of
peak
Absence of
peak
500 V. Nair et al. / Chemical Engineering Journal 254 (2014) 491–502
11. group in presence of H+
results in the formation of imine com-
pounds [47]. This is also supported by the absence of N–H bending
vibration in the FT-IR spectra.
ð50ChALÞ-NH2 þ O@C-ðDyeÞ À! ð50ChALÞ-N@C-ðDyeÞ ð16Þ
Furthermore, under acidic conditions, the interaction of hydro-
xyl groups of the composite with carbonyl groups of the dye can
result in the formation of cyclic hemiketals according to the fol-
lowing reaction [48].
ðDyeÞ-C@O þ HO-ð50ChALÞ À! ðDyeÞ-COðOHÞ-ð50ChALÞ ð17Þ
Cr(VI) adsorption occurs primarily due to electrostatic interac-
tion of the protonated amine and hydroxyl groups present in the
composite with the HCrO4
À
anion.
ð50ChALÞ-NHþ
3 þ HCrOÀ
4 À! ð50ChALÞ-NHþ
3 Á Á Á Á Á Á Á OÀ
4 CrH ð18Þ
ð50ChALÞ-OHþ
2 þ HCrOÀ
4 À! ð50ChALÞ-OHþ
2 Á Á Á Á Á Á Á ÁOÀ
4 CrH ð19Þ
The mechanism of adsorption of RBBR and Cr(VI) on 50ChAL
composite is depicted in Scheme 2 wherein the active sites are
shown by asterisk (⁄
). Thus it is clear that protonated amino and
hydroxyl groups serve as electrostatic interaction sites for the
dye and HCrO4
À
anion, while chemical interactions between amino
and hydroxyl groups of the composite with carbonyl moieties of
the dyes also play a significant role in dye adsorption. An ensemble
of the above investigations suggests that chitosan–alkali lignin
composite is a promising material for the adsorption of toxic
organic compounds and metal ions. Further enhancement in the
rates of adsorption is certainly possible by utilizing lignin from dif-
ferent biomass sources and extracted via different processes. It is
also important to probe the mechanism and kinetics of desorption
of the chemisorbed dyes and metal ions from this composite,
which will be addressed in our future works.
4. Conclusions
The development of cheap, bio-based materials that exhibit
superior adsorption of toxic organic compounds and metal ions is
necessary to alleviate the ever increasing pollution of water bodies
caused by the discharge of industrial effluents. In this work, novel
chitosan–alkali lignin composites were prepared with different
compositions of chitosan and alkali lignin. The weak interactions
between b-1,4-glycosidic linkage, amide and hydroxyl groups of
chitosan, and ether, aromatic ring and hydroxyl groups of alkali lig-
nin, impart enhanced surface and chemical properties to the com-
posite than chitosan and alkali lignin. The composite with 50:50
chitosan:alkali lignin exhibited maximum adsorption of RBBR
and Cr(VI) compared to chitosan, alkali lignin and other compos-
ites. Adsorption of RBBR followed Langmuir isotherm model, and
pseudo second order kinetic model matched well with the experi-
mental data of both RBBR and Cr(VI) adsorption onto the compos-
ite. The adsorption efficiency of 50ChAL composite was also
demonstrated for a variety of dyes belonging to anthraquinone,
mono azoic, and triphenylmethane families. The mechanism of
adsorption was unravelled by carrying out a detailed surface char-
acterization of the composite. The active adsorption sites were
found to be the amine and hydroxyl groups of the composite,
and the adsorption mechanism was due to electrostatic interaction
of protonated amino and hydroxyl groups with anion of the dye
and Cr(VI). Chemical interactions were also observed between
amino and hydroxyl groups of the composite and carbonyl groups
of the dye. This work shows that by incorporating 50% by mass of
lignin in the chitosan–lignin composite, better adsorption efficien-
cies can be achieved for a range of dyes and Cr(VI). Owing to the
fact that lignin is a common waste by-product from paper and cel-
lulosic bioethanol industries, and the simple preparation method
described in this work, the overall cost of the composite adsorbent
can be significantly reduced compared to that of chitosan.
Acknowledgements
R.V. thanks Department of Science and Technology (DST), India,
for project funding and Indian Institute of Technology Madras for
New Faculty Seed Grant. The National Center for Combustion
Research and Development is sponsored by DST, India. The authors
thank JEOL Asia Private Ltd. for EDS analysis.
Appendix A. Supplementary data
Supplementary data associated with this article can be found, in
the online version, at http://dx.doi.org/10.1016/j.cej.2014.05.045.
References
[1] J. Zakzeski, P.C.A. Bruijnincx, A.L. Jongerius, B.M. Weckhuysen, The catalytic
valorization of lignin for the production of renewable chemicals, Chem. Rev.
110 (2010) 3552–3599.
[2] R. Garcia Valls, T.A. Hatton, Metal ion complexation with lignin derivatives,
Chem. Eng. J. 94 (2003) 99–105.
[3] X. Guo, S. Zhang, X. Shan, Adsorption of metal ions on lignin, J. Hazard. Mater.
151 (2008) 134–142.
[4] Y. Wu, S. Zhang, X. Guo, H. Huang, Adsorption of chromium(III) on lignin,
Bioresour. Technol. 99 (2008) 7709–7715.
[5] H. Yang, R. Yan, H. Chen, D.H. Lee, C. Zheng, Characteristics of hemicellulose,
cellulose and lignin pyrolysis, Fuel 86 (2007) 1781–1788.
[6] Suhas, P.J.M. Carrott, M.M.L. Ribeiro Carrott, Lignin-from natural adsorbent to
activated carbon: a review, Bioresour. Technol. 98 (2007) 2301–2312.
[7] M.A.M. Salleh, D.K. Mahmoud, W.A.W.A. Karim, A. Idris, Cationic and anionic
dye adsorption by agricultural solid wastes: a comprehensive review,
Desalination 280 (2011) 1–13.
[8] T. Mechichi, N. Mhiri, S. Sayadi, Remazol Brilliant Blue R decolourization by the
laccase from Trametes trogii, Chemosphere 64 (2006) 998–1005.
[9] R.B. Garcia-Reyes, J.R. Rangel-Mendez, Adsorption kinetics of chromium(III)
ions on agro-waste materials, Bioresour. Technol. 101 (2010) 8099–8108.
O
OH
N
O
O
OH
OH
NH
O
O
O
OH
N
+
O
OH
HH
H
H
H
n
O O
N
H
H
NH
SO O
O
O3
-
S
O3
-
S
O
O
N HH
NH S
O
O
O
SO3
-
SO3
-
RBBR
RBBR
HCrO 4
-
Cr(VI) Anion
O O
NH
H
NH
SO O
O
O3
-
S
O3
-
S
OH
O
CH3
O
OH
H
SH OH
O
OH
O
O
O
CH3
CH3
OH
O CH3
O
OH2
+
SH
O
OH
H
OH
O CH3
O
O
O
CH3
OH2
+
CH3
RBBR
HCrO 4
-
Cr(VI) Anion
∗
∗
∗
∗
∗
∗
Activesites
∗
∗
∗
∗
∗
∗
∗
∗
Chemical interaction
Electrostatic interaction
Scheme 2. Mechanism of RBBR and Cr(VI) adsorption on 50ChAL composite.
Asterisks (⁄
) denote possible adsorption sites.
V. Nair et al. / Chemical Engineering Journal 254 (2014) 491–502 501
12. [10] C. Jung, J. Heo, J. Han, N. Her, S.J. Lee, J. Oh, Hexavalent chromium removal by
various adsorbents: powdered activated carbon, chitosan, and single/multi-
walled carbon nanotubes, Sep. Purif. Technol. 106 (2013) 63–71.
[11] S. Hena, Removal of chromium hexavalent ion from aqueous solutions using
biopolymer chitosan coated with poly(3-methyl thiophene) polymer, J.
Hazard. Mater. 181 (2010) 474–479.
[12] G.H. Sonawane, V.S. Shrivastava, Kinetics of decolourization of malachite green
from aqueous medium by maize cob (zea maize): an agricultural solid waste,
Desalination 247 (2009) 430–441.
[13] G. Sreelatha, V. Ageetha, J. Parmar, P. Padmaja, Equilibrium and kinetic studies
on reactive dye adsorption using palm shell powder (an agrowaste) and
chitosan, J. Chem. Eng. Data 56 (2011) 35–42.
[14] A. Roy, S. Chakraborty, S.P. Kundu, B. Adhikari, S.B. Majumder, Adsorption of
anionic-azo dye from aqueous solution by lignocellulose-biomass jute fiber:
equilibrium, kinetics, and thermodynamics study, Ind. Eng. Chem. Res. 51
(2012) 12095–12106.
[15] B. Ramaraju, P. Manoj, K. Reddy, C. Subrahmanyam, Low cost adsorbents from
agricultural waste for removal of dyes, Environ. Prog. Sustain. Energy 33
(2014) 38–46.
[16] P.S. Kumar, M. Palaniyappan, M. Priyadharshini, A.M. Vignesh, A. Thanjiappan,
Adsorption of basic dye onto raw and surface-modified agricultural waste,
Environ. Prog. Sustain. Energy 33 (2014) 87–98.
[17] A. Kriaa, N. Hamdi, E. Srasra, Adsorption studies of methylene blue dye on
tunisian activated lignin, Russ. J. Phys. Chem. A 85 (2011) 279–287.
[18] N.C. Filho, E.C. Venancio, M.F. Barriquello, A.A.W. Hechenleitner, E.A.G. Pineda,
Methylene blue adsorption onto modified lignin from sugarcane bagasse,
Ecletica Quim. 32 (2007) 63–70.
[19] Y.A. Aydin, N.D. Aksoy, Adsorption of chromium on chitosan: optimization,
kinetics and thermodynamics, Chem. Eng. J. 151 (2009) 188–194.
[20] A. Ergene, K. Ada, S. Tan, H. Katırcıoglu, Removal of Remazol Brilliant Blue R
dye from aqueous solutions by adsorption onto immobilized Scenedesmus
quadricauda: equilibrium and kinetic modeling studies, Desalination 249
(2009) 1308–1314.
[21] M.A. Hossain, H.H. Ngo, W.S. Guo, T. Setiadi, Adsorption and desorption of
copper(II) ions onto garden grass, Bioresour. Technol. 121 (2012) 386–395.
[22] S. Peng, H. Meng, Y. Ouyang, J. Chang, Nanoporous magnetic
celluloseÀchitosan composite microspheres: preparation, characterization,
and application for Cu(II) adsorption, Ind. Eng. Chem. Res. 53 (6) (2014) 2106–
2113.
[23] H. Harmita, K.G. Karthikeyan, X. Pan, Copper and cadmium sorption onto kraft
and organosolv lignins, Bioresour. Technol. 100 (2009) 6183–6191.
[24] G. Crini, P.M. Badot, Application of chitosan, a natural aminopolysaccharide,
for dye removal from aqueous solutions by adsorption processes using batch
studies: a review of recent literature, Prog. Polym. Sci. 33 (2008) 399–447.
[25] S. Jagtap, D. Thakre, S. Wanjari, S. Kamble, N. Labhsetwar, S. Rayalu, New
modified chitosan-based adsorbent for defluoridation of water, J. Coll.
Interface Sci. 332 (2009) 280–290.
[26] X. Hu, J. Wang, Y. Liu, X. Li, G. Zeng, Z. Bao, Adsorption of chromium(VI) by
ethylenediamine-modified cross-linked magnetic chitosan resin: isotherms,
kinetics and thermodynamics, J. Hazard. Mater. 185 (2011) 306–314.
[27] A.A. Perez-Fonseca, C. Gomez, H. Davila, R.G. Nunez, J.R.R. Ortiz, M.O.V. Lepe,
Chitosan supported onto agave fiber-postconsumer HDPE composites for
Cr(VI) adsorption, Ind. Eng. Chem. Res. 51 (2012) 5939–5946.
[28] A.C.L. Batista, E.R. Villanueva, R.V.S. Amorim, M.T. Tavares, G.M.C. Takaki,
Chromium(VI) ion adsorption features of chitosan film and its chitosan/zeolite
conjugate 13X film, Molecules 16 (2011) 3569–3579.
[29] V. Janaki, B.T. Oh, K. Shanthi, K.J. Lee, A.K. Ramasamy, S.K. Kannan, Polyaniline/
chitosan composite: an eco-friendly polymer for enhanced removal of dyes
from aqueous solution, Synth. Met. 162 (2012) 974–980.
[30] N.A. Travlou, G.Z. Kyzas, N.K. Lazaridis, E.A. Deliyanni, Functionalization of
graphite oxide with magnetic chitosan for the preparation of a nanocomposite
dye adsorbent, Langmuir 29 (2013) 1657–1668.
[31] A.G. Yavuz, E.D. Atalay, A. Uygun, F. Gode, E. Aslan, A comparison study of
adsorption of Cr(VI) from aqueous solutions onto alkyl-substituted
polyaniline/chitosan composites, Desalination 279 (2011) 325–331.
[32] J. Dai, F. Ren, C.Y. Tao, Adsorption of Cr(VI) and speciation of Cr(VI) and Cr(III)
in aqueous solutions using chemically modified chitosan, Int. J. Environ. Res.
Public Health 9 (2012) 1757–1770.
[33] Q.-F. Lü, Z.-K. Huang, B. Liu, X. Cheng, Preparation and heavy metal ions
biosorption of graft copolymers from enzymatic hydrolysis lignin and amino
acids, Bioresour. Technol. 104 (2012) 111–118.
[34] L. Chen, C. Tang, N. Ning, C. Wang, Q. Fu, Q. Zhang, Preparation and properties
of chitosan/lignin composite films, Chinese J. Polym. Sci. 27 (2009) 739–746.
[35] V.A. Spinelli, M.C.M. Laranjeira, V.T. Favere, Preparation and characterization
of quaternary chitosan salt: adsorption equilibrium of chromium(VI) ion,
React. Funct. Polym. 61 (2004) 347–352.
[36] E.L. Mansouri, Q. Yaun, F. Huang, Characterization of alkaline lignins for use in
phenol-formaldehyde and epoxy resins, Bioresources 6 (2011) 2647–2662.
[37] N. Sbirrazzuoli, L. Vincent, A. Mija, N. Guigo, Integral, differential and advanced
isoconversional methods. Complex mechanisms and isothermal predicted
conversion-time curves, Chemom. Intell. Lab. Syst. 96 (2009) 219–226.
[38] S. Nethaji, A. Sivasamy, G. Thennarasu, S. Saravanan, Adsorption of malachite
green dye onto activated carbon derived from Borassus aethiopum flower
biomass, J. Hazard. Mater. 181 (2010) 271–280.
[39] G. Annadurai, L.Y. Ling, J.F. Lee, Adsorption of reactive dye from an aqueous
solution by chitosan: isotherm, kinetic and thermodynamic analysis, J. Hazard.
Mater. 152 (2008) 337–346.
[40] D. Angin, Utilization of activated carbon produced from fruit juice industry
solid waste for the adsorption of Yellow 18 from aqueous solution, Bioresour.
Technol. (2014), http://dx.doi.org/10.1016/j.biortech.2014.02.100.
[41] K.V. Kumar, Optimum sorption isotherm by linear and non-linear methods for
malachite green onto lemon peel, Dyes Pigments 74 (2007) 595–597.
[42] A.C. Zimmermann, A. Mecabo, T. Fagundes, C.A. Rodrigues, Adsorption of Cr(VI)
using Fe-crosslinked chitosan complex (Ch-Fe), J. Hazard. Mater. 179 (2010)
192–196.
[43] F. Camacho, P. Gonzalez-Tello, E. Jurado, A. Robles, Microcrystalline-cellulose
hydrolysis with concentrated sulphuric acid, J. Chem. Technol. Biotechnol. 67
(1996) 350–356.
[44] A. Zamani, M.J. Taherzadeh, Production of low molecular weight chitosan by
hot dilute sulfuric acid, Bioresources 5 (2010) 1554–1564.
[45] Y. Zhang, E.A. Pidko, E.J.M. Hensen, Molecular aspects of glucose dehydration
by chromium chlorides, Chem. Eur. J. 17 (2011) 5281–5288.
[46] L. Zhang, W. Xia, B. Teng, X. Liu, W. Zhang, Zirconium cross-linked chitosan
composite: preparation, characterization and application in adsorption of
Cr(VI), Chem. Eng. J. 229 (2013) 1–8.
[47] R.T. Morrison, R.N. Boyd, Organic Chemistry, 2, Pearson Education Pvt. Ltd.,
2002.
[48] O.H. Wheeler, Structure and properties of cyclic compounds. IX. Hemiketal
formation of cyclic ketones, J. Am. Chem. Soc. 79 (1957) 4191–4194.
502 V. Nair et al. / Chemical Engineering Journal 254 (2014) 491–502

![1. Introduction
Lignin, an amorphous, crosslinked and aromatic polymer, is nat-
urally found in biomasses, and is also a major non-sugar compo-
nent of wood [1]. Lignin is well known as a waste by-product
from pulp and paper industries. However, it is also a major reject
from the present day biorefineries that produce cellulosic ethanol
after the separation of cellulose and hemicellulose in the pretreat-
ment step. Lignin is composed of propyl-phenolic subunits
containing phenolic, hydroxyl, carbonyl, methoxy and aldehyde
groups that serve as potential active sites for adsorption of dyes
and metal ions [2–4]. The composition and structural units of lig-
nin differ depending on the source of biomass from which lignin
is extracted. In paper industries, depending upon the pulping pro-
cess, different types of lignins are obtained as waste by-products.
The waste alkali lignin produced from kraft pulping process is inert
and is usually burnt for power [1,5], eventhough its rich chemical
functionality can be utilized in a better way to produce composites
and value added chemicals. Reuse of lignin will not only reduce the
amount of the biowaste, but also provide additional revenue to the
industries [1]. Recently, lignin has found applications in the form of
adhesives, tanning agents and as a precursor for producing acti-
vated carbon, which is a well known adsorbent [6]. This work aims
at modifying lignin for use as an adsorbent for waste water
decontamination.
Wastewater discharge from dye, paint, paper, textile and elec-
troplating industries contain harmful chemicals like dyes and
metal ions, which pollute the water bodies. The presence of very
low concentrations of even 10 ppm of dyes in water imparts a
color, making it undesirable for use [7]. The reactive dyes that
are discharged into the water bodies are not biodegradable, and
hence, are toxic to aquatic life. Remazol Brilliant Blue R (RBBR) is
an anthraquinonic dye used widely in paints, inks, chemical indica-
tors, dyeing of cottons, silk and as a starting material in the produc-
tion of polymeric dyes [8]. Similarly, hexavalent chromium, Cr(VI),
is mostly generated by chemical processes like electroplating,
leather tanning, pigment manufacturing and mining [9]. Chro-
mium metal ion exists in two valence states, viz., Cr(III) and Cr(VI),
of which the latter is highly toxic and carcinogenic [10].
Adsorption is one of the superior physicochemical methods for
wastewater detoxification compared to other methods like coagu-
lation, ion exchange, oxidation, chemical precipitation, electrode-
position and membrane separation, owing to high removal
efficiency for different types of effluents, ease of operation, avail-
ability of a variety of cheap adsorbents, and the absence of sludge
and harmful by-product formation [11]. Recent investigations on
the removal of effluents by adsorption are focused on utilizing
readily available and cheap bio-based materials like maize [12],
agricultural waste [13], jute fiber [14], rice husk [15] and mango
seed [16]. Table 1 [4,13,15,17–22] presents a summary of adsorp-
tion capacities of various bio-based materials for the removal of
dyes and metal ions. Researchers have utilized lignins extracted
by organosolv and kraft pulping processes for adsorption of dyes
and metal ions [4,17,18,23]. Typically, non-sulphonated lignins like
alkali lignin can be used as adsorbents owing to their insolubility in
water and high resistance to chemical reactions. However, the
structure of lignin varies based on the type of biomass (e.g. soft-
wood, hardwood, grassy), and hence, it is imperative that surface
modified lignins and lignin-based composites are developed as
potential adsorbent materials.
Chitosan, a copolymer obtained by deacetylation of chitin [24],
is a well known biosorbent used for the removal of various types of
pollutants like fluorides, dyes, heavy metal ions and organic com-
pounds found in waste water [19,25]. Chitosan is a copolymer of
2-glucosamine and N-acetyl-2-glucosamine units, wherein the
former constitutes a major fraction of the biopolymer chain. The
adsorption characteristics of chitosan are due to the large number
of hydroxyl (–OH) and primary amine (–NH2) groups that act as
highly active adsorption sites [26]. In acidic condition, the amine
groups are protonated and thereby aids in the adsorption of dye/
metal ion by electrostatic attraction. However, chitosan, as an
adsorbent, has some disadvantages such as dissolution in highly
acidic solution, low surface area, high cost, poor thermal and
mechanical properties [27]. Physical or chemical modification of
chitosan using different materials has been studied to improve
its properties and adsorption capacity. Chitosan composites such
as chitosan–cellulose [22], chitosan–zeolite [28], chitosan–polyan-
iline [29], and graphite oxide–magnetic chitosan [30] have been
developed that exhibit better adsorption together with enhance-
ment in other physical and chemical properties. The development
of chitosan-based biocomposites will bring down the overall cost
of the adsorbent owing to decrease in the use of expensive chito-
san, and provide an opportunity for utilizing the renewable by-
products produced in industries.
Development of biodegradable chitosan–alkali lignin compos-
ites for dye and metal ion adsorption is a new area of application
of alkali lignin. To the best of our knowledge, this is the first work
to report the removal of effluents from wastewater using chitosan–
alkali lignin composites with enhanced physicochemical proper-
ties. In this work, novel chitosan–alkali lignin composites were
prepared, and characterized using various techniques like Fourier
transform infrared spectroscopy (FT-IR), thermogravimetric analy-
sis (TGA), scanning electron microscopy (SEM) and porosimetry to
establish the molecular structure, thermal stability, surface mor-
phology and specific surface area of the composites, respectively.
The adsorption of RBBR and Cr(VI) ion on chitosan, alkali lignin
and chitosan–alkali lignin composites was evaluated. Adsorption
conditions such as chitosan content in the composite, solution
pH and adsorbent concentration were optimized. Equilibrium
adsorption isotherms and adsorption kinetics were evaluated.
The dye and metal ion adsorbed composites were characterized
and the mechanism of adsorption of RBBR and Cr(VI) on the com-
posite active sites was proposed.
2. Experimental section
2.1. Materials
Chitosan (95% deacetylated) and Remazol Brilliant Blue R (C.I.
61200; C22H16N2Na2O11S3; MW 626.54 g molÀ1
) were purchased
Table 1
List of different biosorbents and their sorption capacity for adsorption of dyes and
metal ions as reported in literature.
Biosorbent Dye/metal
ion
Biosorption
capacity
(mg gÀ1
)
References
Lignin Cr(III) 17.97 [4]
Palm shell powder Reactive
Blue 21
24.86 [13]
Peroxide treated rice husk Malachite
Green
26.6 [15]
Tunisian activated lignin Methylene
Blue
147 [17]
Lignin from sugarcane bagasse Methylene
Blue
34.20 [18]
Chitosan Cr(VI) 7.94 [19]
Immobilized green algae
Scenedesmus quadricauda
RBBR 68 [20]
Garden Grass Cu(II) 58.34 [21]
Cellulose–chitosan composite Cu(II) 75.82 [22]
Chitosan–alkali lignin composite RBBR 111.11 This work
492 V. Nair et al. / Chemical Engineering Journal 254 (2014) 491–502](data:image/gif;base64,R0lGODlhAQABAIAAAAAAAP///yH5BAEAAAAALAAAAAABAAEAAAIBRAA7)