1. 1 INTRODUCTION AND BACKGROUND
The Deilmann Tailings Management Facility (DTMF) at the Key Lake uranium mill in northern
Saskatchewan is a former open pit mine that has been the receptor for tailings since 1996. Ap-
proximately 70m of outwash sand overlying sandstone bedrock is exposed in the west wall of the
west cell in the DTMF. Tailings were first deposited in the east cell of the DTMF in January 1996.
Sub-aerial deposition was used in the east cell between January 1996 and December 1998. The
first tailings in the west cell of the DTMF were sub-aerially deposited in April 1999. In mid-2000
a new pit crest tailings distribution system was commissioned, the old in-pit tailings distribution
system was decommissioned, and flooding of the DTMF commenced. The objectives in flooding
of the pit included preventing the freezing of deposited tailings, reduction of dewatering volumes
and stabilization of the pit walls under a deep water cover. Flooding was achieved by pumping all
Deilmann dewatering flow into the pit, as well as by allowing horizontal drain flow to report
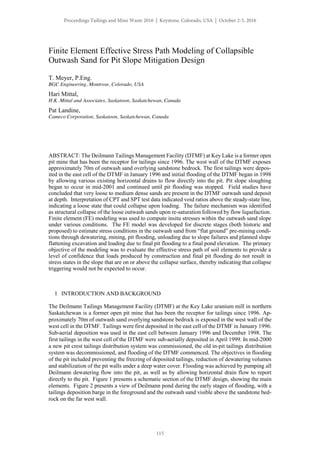
directly to the pit. Figure 1 presents a schematic section of the DTMF design, showing the main
elements. Figure 2 presents a view of Deilmann pond during the early stages of flooding, with a
tailings deposition barge in the foreground and the outwash sand visible above the sandstone bed-
rock on the far west wall.
Finite Element Effective Stress Path Modeling of Collapsible
Outwash Sand for Pit Slope Mitigation Design
T. Meyer, P.Eng.
BGC Engineering, Montrose, Colorado, USA
Hari Mittal,
H.K. Mittal and Associates, Saskatoon, Saskatchewan, Canada
Pat Landine,
Cameco Corporation, Saskatoon, Saskatchewan, Canada
ABSTRACT: The Deilmann Tailings Management Facility (DTMF) at Key Lake is a former open
pit mine that has been the receptor for tailings since 1996. The west wall of the DTMF exposes
approximately 70m of outwash sand overlying sandstone bedrock. The first tailings were depos-
ited in the east cell of the DTMF in January 1996 and initial flooding of the DTMF began in 1998
by allowing various existing horizontal drains to flow directly into the pit. Pit slope sloughing
began to occur in mid-2001 and continued until pit flooding was stopped. Field studies have
concluded that very loose to medium dense sands are present in the DTMF outwash sand deposit
at depth. Interpretation of CPT and SPT test data indicated void ratios above the steady-state line,
indicating a loose state that could collapse upon loading. The failure mechanism was identified
as structural collapse of the loose outwash sands upon re-saturation followed by flow liquefaction.
Finite element (FE) modeling was used to compute insitu stresses within the outwash sand slope
under various conditions. The FE model was developed for discrete stages (both historic and
proposed) to estimate stress conditions in the outwash sand from “flat ground” pre-mining condi-
tions through dewatering, mining, pit flooding, unloading due to slope failures and planned slope
flattening excavation and loading due to final pit flooding to a final pond elevation. The primary
objective of the modeling was to evaluate the effective stress path of soil elements to provide a
level of confidence that loads produced by construction and final pit flooding do not result in
stress states in the slope that are on or above the collapse surface, thereby indicating that collapse
triggering would not be expected to occur.
Proceedings Tailings and Mine Waste 2016 | Keystone, Colorado, USA | October 2-5, 2016
115
2. Figure 1. DTMF Schematic Section
Figure 2. DTMF Initial Pit Flooding
In August 2001, as the water level rose above the toe of the lowermost sand overburden slopes in
the west cell above approximately elevation 465 m, some pit sloughing began to occur. By the
time water levels reached an elevation of about 475 m in October, 2001, the rate and extent of
sloughing in this area and others was well beyond original expectations and threatened some of
the infrastructure near the pit crest.
Geotechnical Considerations
116
3. There were two significant slope failures: one in February 2002; and a second one in February
2003. By August 2003, the slope crest had receded a total of approximately 31 m to 46 m, de-
pending on the location around the pit perimeter. Then on November 11, 2003, a major sloughing
event occurred causing pit crest regressions on the order of 15 m to 21 m in some areas and span-
ning about 1000 m of the perimeter of the DTMF in the West cell.
This unexpected failure, and the magnitude of the failure, forced Cameco to re-evaluate the
strategy of quickly flooding to elevation 510 and prompted a series of actions beginning with
stabilization of the water level at about 497 m Figure 3 presents a photograph of the DTMF out-
wash sand slope in 2009 after water levels had been stabilized and slope sloughing substantially
abated. Figure 4 presents a photograph of the same slope area following remediation which in-
volved excavation of the slope to a stable angle and placement of a rock fill toe buttress.
Figure 3. Original DTMF Pit Slope.
Figure 4. Remediated DTMF Pit Slope.
Proceedings Tailings and Mine Waste 2016 | Keystone, Colorado, USA | October 2-5, 2016
117
4. 1.1 Failure Mechanism
Under saturated conditions loose sands can develop a mobilized peak strength that is less than the
conventional effective friction angle at critical state condition. This is sometimes referred to as a
“collapse mechanism” with an associated mobilized soil strength referred to as a “collapse friction
angle” or “collapse strength”. Research has shown that the sand grain structure can collapse dur-
ing fully drained loading, as well as during undrained loading with a mobilized friction angle well
below the conventional effective friction angle (Sasitharan et al. 1993). Hanzawa (1980) hypoth-
esized a similar mechanism for liquefaction of loose sands.
Laboratory testing of the DTMF outwash sands indicated volumetrically contractive behavior,
which under undrained conditions produces a potential for pore pressure increases and consequent
liquefaction, or void ratio decrease followed by stress redistribution in a drained response. Either
case can lead to slope failure.
It was postulated that the outwash sand pit wall failures occurred as a result of: re-submergence
of the sand slope, resulting in loss of suction strength in the saturated sand; reduction of the ef-
fective stress accompanied by a suppression in shear resistance below the water level; and yielding
of the sand in the toe area when the ground stress approaches or equals the strength of the soil.
This reduced available shear strength (collapse strength) of the sand is less than the peak effective
value. It was postulated that sand grain structure collapse occurs in the re-submerged sand, fol-
lowed by a rapid undrained response and liquefaction leading to flow slide failure.
This failure mechanism was adopted for the detailed geotechnical analyses to support the
remediation design. Methodology for finite element modeling incorporated the collapse surface
related to loose sand collapse behavior.
1.2 Design Criteria and Methodology
Based on a review of industry standards and a project-specific risk evaluation, a minimum factor
of safety (FoS) of 1.3 was selected for establishing safety setbacks during construction as well as
long-term stability of the remediated pit slope.
In addition to limit equilibrium (LE) analyses performed to determine the minimum factors of
safety for the design, the project team considered it desirable to demonstrate the robustness of the
design through finite element (FE) stress path modeling. Given the postulated failure mode of
structural sand grain collapse leading to slope failure, localized areas of stress could develop in
the slope during final pit flooding which may be indicative of localized sloughing of the final
slopes. These localized sloughs have been known to be retrogressive in nature based on project
history. It was recognized that conventional LE analyses may indicate an acceptable FoS against
slope instability, but not account for localized stress conditions. This is an inherent limitation of
LE analyses. The primary goal of the FE modeling was to demonstrate that the onset (triggering)
of collapse stress conditions in the slope, would not occur during slope remediation or subsequent
flooding.
It is important to distinguish between the two criteria for long-term reliability of the facility.
A minimum FoS of 1.3 (as calculated by LE analyses) provides an adequate reserve resistance
against overall collapse and can be viewed as a “conventional” factor of safety against slope fail-
ure. For most geotechnical projects evaluating slope stability, this type of criteria is normally
applied. However, the DTMF project was somewhat unique due to the meta-stable nature of the
outwash sand requiring an adequate remedial design with reserve resistance against the trigger of
local collapse, as determined through rigorous finite element modeling of the final slopes during
pit flooding. This was achieved by modeling the loading history beginning with the pre-mining
state and ending with a flooded pit. This analysis determined the stress states in the sand mass,
as well as effective stress paths of elements in the slope. The established design criteria dictated
that the stress states in the outwash sand slope must remain below the collapse surface (defined
by a collapse friction angle) during each step of the remediation process and subsequent flooding.
Geotechnical Considerations
118
5. 1.3 Subsurface Conditions
The overburden deposits in the Key Lake area are dominated by glacially derived materials. Gla-
cial till deposits in the general DTMF area, include both ground moraine and drumlin forms. The
till is typically a poorly sorted, unstratified mixture of sand, gravel, cobbles and boulders with
lesser amounts of silt and clay. Till is generally present in the eastern two thirds of the DTMF. In
contrast, the west wall overburden slope is comprised of outwash deposits, with minimal (if any)
till. Outwash sand deposits would have formed during glacial retreat, as a portion of the till carried
in the glaciers was washed out and deposited adjacent to the retreating ice. This mode of deposi-
tion is known to result in loose deposits. Outwash sand deposits in the project area are up to 70
meters in thickness and generally consist of stratified, poorly to well sorted sand with minor
amounts of gravel. Coarser (gravel to cobble size) deposits are also found in some areas near the
base of the outwash sand above the sandstone contact. These coarser deposits were encountered
in boreholes completed in the western portion of the project area in the thickest sand sections.
The geotechnical conditions encountered in the 2010 geotechnical exploration program were
fairly consistent across the site and indicative of the glacial outwash geology of the area. The
outwash material encountered consisted mainly of interlayered clean sands of various sizes with
some silty layers. The major types of material can be grouped in four categories: 1) clean fine
sand, 2) clean fine to medium sand, 3) fine to coarse sand with trace fine gravel, and 4) silty fine
sand / sand with silt. The moisture content of the sand above the water table was typically low,
indicating a fairly well drained condition. A zone of variable thickness consisting of gravel and
cobble sized material, typically mixed with sand or in a sand matrix, was encountered just above
the outwash/sandstone contact. A zone of weathered sandstone was typically encountered below
the contact.
2 GEOTECHNICAL ANALYSES
2.1 General
The analyses included evaluation of multiple study sections spaced at regular intervals around the
west cell of the DTMF. The work involved the following primary elements:
Development of study sections around the project area.
Evaluation of field and laboratory physical data to determine appropriate material param-
eters for the analyses.
Back-analysis of the November 2003 slope failure event to verify geotechnical parame-
ters.
Geotechnical sensitivity analysis of a typical mining bench and current outwash sand
slopes for verification of back-calculated parameters.
Finite element modeling of insitu conditions at various slope configurations and water
table elevations to evaluate the effective stress path of points within the outwash sand
behind the slope.
Geotechnical limit equilibrium analyses to establish initial construction safety setback
distances at each study section for current conditions.
Calculation of long-term (following slope flattening and pit flooding to elevation 510m)
factors of safety against slope failure.
Establishment of an excavation line for slope flattening around the entire project area
based on results of geotechnical analyses.
2.2 Material Properties
The average critical state friction angle of the outwash sand, was estimated to be about 33 degrees
with a range of 32 to 35 degrees based on triaxial compression testing. The mobilized (collapse)
friction angle at onset of instability during undrained tests was found to range from about 20 to
27 degrees, with a majority of the values in range of 22 to 24 degrees. Conventional triaxial
drained testing indicated a peak shear strength of about 31 to 35 for the sand.
Proceedings Tailings and Mine Waste 2016 | Keystone, Colorado, USA | October 2-5, 2016
119
6. Back-analyses were also conducted on cross-sections of the pit wall with data from well docu-
mented failure events to estimate the field-scale shear strength of the sand. The results of this
analysis revealed a fairly good agreement with the laboratory derived data mentioned above.
Based on the laboratory testing and back-analysis results, the selected outwash sand engineering
parameters for final detailed slope remediation design are presented in Table 1. Rockfill proper-
ties were taken from literature values (Leps 1970). Leps’ empirical strength model of the weakest
type of rockfill was conservatively adapted for stability analyses.
Table 1 - Material Properties for Detailed Design Analyses
Material Name
Unit Weight
(kN/m3
)
Cohesion (kPa)
Phi
(Degrees)
Upper Sand 16.5 6 32
Lower Sand 19.7 0 24
Rockfill 22.0 0 38
Bedrock No potential for slope instability
2.3 Determination of Safety Setbacks
Slope stability analyses were performed at nineteen study sections in the project area to establish
safety setbacks around the west wall crest behind which slope remediation work could be safely
performed. The study sections evaluated the following:
Existing conditions (existing ground surface with water level at 497m) to calculate cur-
rent FoS and required safety setback based on the design criteria (FoS > 1.3).
Proposed final slope conditions based on safety setback criteria plus 20m (work zone
width behind safety setback line) or as needed to provide a final FoS > 1.3 with the wa-
ter level at 510m.
The resulting average calculated safety setback was about 42 meters.
2.4 Slope Remediation Design
Each section was also evaluated for long-term factor of safety for the final (post-remediation)
slope configuration with the water table elevation at 510m. The final slope configuration was
based on the calculated safety setback plus 20m and the “bench and slice” construction method-
ology for two final slope configuration cases:
1. Configuration based solely on LE analyses with a bottom bench elevation of 505m and a
thin riprap rock layer for wave protection (see Figure 5)
2. Configuration based on FE analysis with a constructed lower rock zone to prevent trig-
gering of sand collapse upon re-saturation (see Figure 6).
Geotechnical Considerations
120
7. Figure 5 – Final Slope Configuration Without Rock Zone
Figure 6 – Final Slope Configuration with Rock Zone
3 FINITE ELEMENT MODELING
3.1 General
Finite element (FE) modeling was used to compute insitu stresses within the outwash sand slope
under various conditions. FE modeling was conducted using SIGMA/W, a computer program
developed by Geoslope International (Geoslope, 2010b). Stresses were computed at various
stages (eg. pit mining, initial pit re-flooding, loss of mass due to slope failures, slope flattening
excavation, and further pit re-flooding).
The primary objective of the modeling was to evaluate the effective stress path of soil elements
to provide a level of confidence that, loads produced by construction and final pit flooding would
not result in stress states on or above the collapse surface. Although LE analyses results indicated
acceptable factors of safety against slope instability for the remediated and flooded slope config-
uration, these analyses only considered average conditions along evaluated slip surfaces and did
not consider localized stress zones that could develop within the sand mass due to loading.
The pit slope sloughing history suggests that localized sloughing can lead to retrogressive slope
failure. Since the failure mechanism has been identified as: structural collapse of the loose sands
upon re-saturation followed by flow liquefaction, the triggering of collapse must be avoided to
provide a reliable design.
Proceedings Tailings and Mine Waste 2016 | Keystone, Colorado, USA | October 2-5, 2016
121
8. 3.2 Methodology and Parameters
The FE model was developed for discrete stages (both historic and proposed) to estimate stress
conditions in the outwash sand from “flat ground” pre-mining conditions through dewatering,
mining, pit flooding, unloading due to slope failures and planned slope flattening excavation and
loading due to final pit flooding to 510 m elevation.
The generalized “collapse surface” concept proposed by Sladen, D’Hollander and Krahn
(1985) was utilized by Geoslope in previous studies and was adopted for the purposes of this
study. When deviator stress (q) is plotted with mean effective stress (p’) in an undrained triaxial
test, the collapse surface can be determined from a straight line through the maximum deviator
stress points for each test.
A collapse surface angle of ranging from 22 to 24 degrees was used for the analysis based on
the results of laboratory testing back analyses. The intersection point of the collapse surface with
the critical state line is referred to as the steady state strength (Css) and its value is estimated to be
approximately 10 kPa from field observations of the flow failure runout angles (about 5 to 15
degrees).
3.3 Model Configuration
The model geometry is based on ground survey data at various states as shown on Figure 6. The
mesh consists of 3-meter quadrilateral and triangular elements with secondary nodes. Boundary
conditions (BC’s) include fixed stress/strain along the model border. A fluid load BC was estab-
lished on the slope to account for free water pool loading, where applicable. Figure 6 presents the
model configuration at proposed final remediated slope conditions. This configuration is referred
to as the “Base Case” and represents a possible remediated slope configuration based solely on
LE analyses results. Figure 7 presents the finite element mesh and boundary conditions used. A
one-meter thick zone of rockfill (riprap) has been added to the final slope from elevation 498m to
511m for protection of the slope against wave action. Five selected mesh nodes are shown as
points A through E, which were used to track effective stresses in the outwash sand mass at these
areas of interest.
Figure 7 – Finite Element Model Mesh and Boundary Conditions
The outwash sand materials were modeled as elastic, perfectly plastic with values of the initial
tangent modulus determined from consolidated-drained (CD) triaxial testing (Mittal 2007).
3.4 Physical Modeling Sequence
The FE modeling steps were developed to simulate fourteen distinct configurations of the slope
from pre-mining conditions (step 1a) through dewatering (step 1b), pit development (step 2a),
Geotechnical Considerations
122
9. tailings infill and reflooding (step 2b through 2d), slope failures (steps 3a and 3b), pond water
level changes (steps 4a and 4b) and future highwall configurations (5a to 5d). The modeling steps
were linked within SIGMA/W resulting in staged analyses where results of a new stage depend
on the solution of the previous stage. Stress conditions are carried through the model allowing
capture of the stress history from flat ground conditions to current conditions, accounting for water
level changes and loss of soil mass due to slope failures based on field information provided by
Cameco. The final (proposed) slope configuration was then created by removing the excavated
material and raising the pond level in several stages.
3.5 Results
Initial results indicated development of overstressed areas near the slope face between elevation
497m and 511m. The stress conditions predicted in the model indicate unstable conditions which
could lead to progressive slope sloughing. This condition did not meet the stated design criteria
of preventing the onset of collapse conditions in the slope. Rock fill was then added to the lower
slope area until the model indicated safe conditions.
Figure 8 presents the rock zone configuration established through iterative FE modeling. Con-
struction of the rock zone involves excavation of outwash sands to create a minimum 10m wide
bench at elevation 497.5m. Following sand excavation, the rockfill is placed uncompacted to the
dimensions shown. The rock zone improves the performance of the remediation by providing
mass for “containment” of stresses near the slope face thereby preventing the onset (triggering)
of collapse stress conditions. The effective stress paths for the rock replacement scenario are
shown on Figures 9 through 13. The rock zone mass provides effective stress confinement result-
ing in the stress paths remaining below the collapse line during the final flooding stages. This
provides confirmation that the proposed rock replacement meets the stated design criteria.
Figure 8 – Rock Zone Configuration
Proceedings Tailings and Mine Waste 2016 | Keystone, Colorado, USA | October 2-5, 2016
123
10. Figure 9 – Rock Replacement FE Model Stress Path – Point A
Figure 10 – Rock Replacement FE Model Stress Path – Point B
0
100
200
300
400
500
600
0 100 200 300 400 500 600
DeviatorStress-q
Mean Effective Stress - p'
CSL
Collapse
PointA
3a
2a
5a
1b
3b
4b
1a5d
0
100
200
300
400
500
600
0 100 200 300 400 500 600
DeviatorStress-q
Mean Effective Stress - p'
CSL
Collapse
PointB
5a
3a
2a
5d
1b
3b
4a
1a
Geotechnical Considerations
124
11. Figure 11 – Rock Replacement FE Model Stress Path – Point C
Figure 12 – Rock Replacement FE Model Stress Path – Point D
0
50
100
150
200
250
300
350
400
450
500
0 50 100 150 200 250 300 350 400 450 500
DeviatorStress-q
Mean Effective Stress - p'
CSL
Collapse
PointD
5d
3a
5a
1b
3b
1a
0
50
100
150
200
250
300
350
400
450
500
0 50 100 150 200 250 300 350 400 450 500
DeviatorStress-q
Mean Effective Stress - p'
CSL
Collapse
PointC
3a 2a
5a
1b
4a
1a
5d
Proceedings Tailings and Mine Waste 2016 | Keystone, Colorado, USA | October 2-5, 2016
125
12. Figure 13 – Rock Replacement FE Model Stress Path – Point E
4 CONCLUSION
Finite Element (FE) stress analyses were performed to evaluate the effective stress path of soil
elements within the slope under excavation unloading and pit flooding conditions to further vali-
date the final design parameters and demonstrate a margin of safety against the onset of sand
collapse conditions. FE modeling results indicated collapse stress conditions developing near the
slope face during final pit flooding for the Base Case slope configuration established through LE
analyses. In order to improve the slope remediation design to meet the design criteria, rock re-
placement of overstress sand near the slope face creating a rockfill zone along the lower slope was
evaluated. Iterative FE analyses were utilized to obtain a rock replacement design providing suf-
ficient confinement of the sand in the lower slope to provide a robust design. A margin of safety
(calculated by the Strength Reduction Factor technique) of over 1.6 was calculated for the final
configuration with rock replacement and a final pond water elevation of 510m.
0
50
100
150
200
250
300
350
400
450
500
0 50 100 150 200 250 300 350 400 450 500
DeviatorStress-q
Mean Effective Stress - p'
CSL
Collapse
PointE
5a
3a
5d
1b
4a
1a
Geotechnical Considerations
126