1. Ferris State Student Research
This report is published for educational purposes only by
students competing in the CFA Institute Research
Challenge.
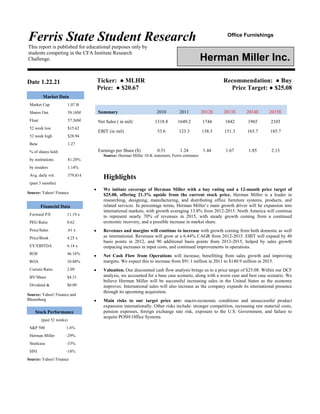
Ticker: ● MLHR Recommendation: ● Buy
Price: ● $20.67 Price Target: ● $25.08
Summary 2010 2011 2012E 2013E 2014E 2015E
Net Sales ( in mil) 1318.8 1649.2 1744 1842 1965 2103
EBIT (in mil) 53.6 123.3 138.3 151.3 165.7 185.7
Earnings per Share ($) 0.51 1.24 1.44 1.67 1.85 2.13
Source: Herman Miller 10-K statement, Ferris estimates
Highlights
We initiate coverage of Herman Miller with a buy rating and a 12-month price target of
$25.08, offering 21.3% upside from the current stock price. Herman Miller is a leader in
researching, designing, manufacturing, and distributing office furniture systems, products, and
related services. In percentage terms, Herman Miller’s main growth driver will be expansion into
international markets, with growth averaging 13.8% from 2012-2015. North America will continue
to represent nearly 70% of revenues in 2015, with steady growth coming from a continued
economic recovery, and a possible increase in market share.
Revenues and margins will continue to increase with growth coming from both domestic as well
as international. Revenues will grow at a 6.44% CAGR from 2012-2015. EBIT will expand by 40
basis points in 2012, and 90 additional basis points from 2013-2015, helped by sales growth
outpacing increases in input costs, and continued improvements in operations.
Net Cash Flow from Operations will increase, benefitting from sales growth and improving
margins. We expect this to increase from $91.1 million in 2011 to $140.9 million in 2015.
Valuation. Our discounted cash flow analysis brings us to a price target of $25.08. Within our DCF
analysis, we accounted for a base case scenario, along with a worst case and best case scenario. We
believe Herman Miller will be successful increasing sales in the United States as the economy
improves. International sales will also increase as the company expands its international presence
through its upcoming acquisition.
Main risks to our target price are: macro-economic conditions and unsuccessful product
expansion internationally. Other risks include: stronger competition, increasing raw material costs,
pension expenses, foreign exchange rate risk, exposure to the U.S. Government, and failure to
acquire POSH Office Systems.
Herman Miller Inc.
Date 1.22.21
Market Data
Market Cap 1.07 B
Shares Out. 58.16M
Float 57.36M
52 week low $15.62
52 week high $28.94
Beta 1.27
% of shares held:
by institutions 81.20%
by insiders 1.14%
Avg. daily vol. 379,814
(past 3 months)
Source: Yahoo! Finance
Financial Data
Forward P/E 11.19 x
PEG Ratio 0.62
Price/Sales .61 x
Price/Book 4.25 x
EV/EBITDA 6.14 x
ROE 46.16%
ROA 10.88%
Current Ratio 2.09
BV/Share $4.31
Dividend & $0.09
Source: Yahoo! Finance and
Bloomberg
Stock Performance
(past 52 weeks)
S&P 500 1.6%
Herman Miller -29%
Steelcase -33%
HNI -18%
Source: Yahoo! Finance
Office Furnishings
2. CFA Institute Research Challenge 1.22.12
2
Source: Yahoo! Finance
Business Description
Herman Miller was founded in 1905 and is based in Zeeland, Michigan. In the 1990’s Herman Miller focused
on manufacturing efficiency and sustainability, along with expanding their product offering. Nowadays, they
are one of the leading manufacturers of office furniture and furniture systems in the United States. Since
1986, they have been ranked in the top ten in Fortune magazine’s annual top ten list of the 500 most admired
companies. Their main strengths are brand recognition, operational excellence, and their commitment to
innovation through research and design. The company maintains operations in 35 countries and has
customers in over 100 countries. A majority of the products they sell are marketed through independent
dealers, the rest of sales come from their own sales staff, dealer network, and online website. A majority of
their revenue comes from the United States, but they have increased their exposure to international markets in
the past decade. The company maintained profitably during what was arguably the greatest economic crash in
the U.S. since the Great Depression, helped by a lean manufacturing strategy that limits fixed production
costs. In 2011, Herman Miller underperformed the market, along with the rest of the furniture industry given
the volatility and uncertainty of the macro environment. However, Herman Miller saw net sales increase by
25% in 2011 as the global economy did recover. They also saw a huge EBIT improvement up 340 basis
points from 2010, primarily driven by leverage.
Product Segments: Herman Miller’s products are made up of the following categories:
-Seating: Herman Miller’s second biggest product segment, accounted for 24% of revenues in 2011. Trends
for seating have been improving as 32% of U.S. office furniture production now comes from seating, when in
2002, it accounted for only 26%. Seating categories include work, multipurpose, public, dining, patient,
outdoor, classic, stacking, and office chairs. Main brands are: Embody, Aeron, Setu, Ergon, and SAYL
seating.
-Systems: The biggest product segment that accounted for 26% of revenues in 2011. Systems include: office,
full-height wall, and healthcare systems. Annual U.S. production of systems has declined in the past decade,
but we expect Herman Miller to capture additional market share, specifically in the healthcare space with
their award winning Compass System. Also, their recent acquisition of Brandrud and Nemschoff gives them
the industry’s most complete healthcare offering. Herman Miller’s main systems include: Canvas Office
Landscape, EthoSpace System, and My Studio Environments.
-Freestanding and Storage: Accounted for 19% of revenues in 2011. Main products include: office storage
cabinets, healthcare carts, home office desks and storage, and tables used in many different settings. Top
brands are: Abak, Intent, Envelope, Meridian, and Tu.
-International: Representing 16% of revenues in 2001, it has grown to account for 23% in 2011. We expect
this trend to continue as Herman Miller is focused on increasing its international presence. The company has
determined that disclosure of individual country information within its international operations is not
practical. The change in accounting information has made it difficult to analyze foreign countries sales.
Figure 1: Revenue base
FY 2011
Int'l 23%
Health,
Home &
Edu. 24%
US Office &
Gov 53%
Source: Herman Miller’s 10-K
statement
Figure 2: Product mix
Source: Herman Miller’s 10-K
statement
3. CFA Institute Research Challenge 1.22.12
3
-Other: This product segment is made up of miscellaneous product sales and service sales that are not
categorized. This is the smallest segment of Herman Miller’s revenues, making up only 8%.
Operating Segments: Herman Miller reports three operating segments described below.
-North American Furniture Solutions: This includes the operations associated with the design,
manufacture, and sale of furniture products for work-related settings, including office, education, and
healthcare environments, throughout the United States and Canada. This segment accounted for 74% of the
company’s revenue in 2011.
-Non-North American Furniture Solutions: This includes the operations associated with the design,
manufacture, and sale of furniture products, primarily for work-related settings, for Mexico and outside of
North America. This segment accounted for 18% of revenues in 2011.
-Specialty and Consumer: This includes the operations associated with the design, manufacture, and sale of
high-end furniture products including Geiger wood products, Herman Miller Collection products, and their
North American consumer retail business. This segment was introduced by the company in the first quarter
of their 2012 fiscal year. The company re-stated its financial statements for 2011 to include this segment,
where it accounted for 8% of revenues.
Company strategy going forward: Herman Miller’s biggest growth opportunity will come from Asia
(inclusive of India) and Latin America where they currently have limited exposure. To increase their
exposure and support growth, the company is acquiring POSH Office Systems located in Hong Kong. This
acquisition gives them direct access to the Chinese market. Non-North American sales were 17.6% of the
company’s revenue in 2011, and we expect this to increase to 23.2% by 2015. In the U.S. and Canada,
Herman Miller will look to increase sales by offering superior products and an extensive product pipeline.
North American sales represented 74.3% of revenues in 2011. This is expected to decrease to 68% in 2015.
Industry Overview and Competitive Positioning
In this section, we analyze the three main markets where Herman Miller will operate in the immediate future:
United States, China, and Latin America.
United States: a volatile market. Herman Miller, like the rest of the office furniture industry, is greatly
dependent on U.S. commercial activity and the conditions of the economy. The United States market in the
past five years has seen an incredible amount of volatility, due to the financial crisis of 2008. Consequently,
the office furniture manufacturing industry has suffered tough conditions during those five years. Low
business sentiment and high unemployment following the recession have created little impetus for office
furniture demand since 2006. Meanwhile, rising import penetration from China has further hurt sales, since
the country is able to produce goods at much lower costs. Fortunately, demand conditions are slowly
improving, as the U.S. economy recovers from the recession and businesses expand operations. As the
number of businesses increases and companies hire more employees, total industry revenue is expected to
increase.
The leading economic indicators most highly correlated to Herman Miller’s sales from 2002-2011 were CEO
sentiment, the Architectural Billings Index (ABI), and corporate profit levels. Current CEO sentiment can be
characterized as cautiously optimistic with most survey levels near 2 year highs. ABI readings continue to
improve from 2009, indicating growth in non-residential construction activity. Corporate profitably is strong
and companies have a lot of cash on their balance sheets. (Please see Appendix #5 for detailed results)
As economic conditions improve, the number of businesses and white-collar jobs are projected to rise
through 2016, leading to more industry sales. However, BIFMA projects that total production for the U.S.
office furniture market will decrease by 1.7% in 2012 from 2011. Given this challenging environment,
Herman Miller’s future sales will partly come from taking market share from their competitors. Additionally,
sales should benefit from the small growth in the office furniture market of the United States in the long term.
We estimate Herman Miller’s current market share to be around 12.5% in the U.S. in 2010 and 14% in 2011.
We expect this trend to continue as Herman Miller expands its product portfolio. Herman Millers top U.S.
competitors are Knoll, Steelcase, HNI and privately owned Haworth. Their main competitor is Knoll as both
companies compete in the high end price segment. Herman Miller also must pay close attention to Steelcase
who competes in the lower end segment, and has the highest market share in the U.S. at 21% in 2011.
Figure 3: Sales by segment
Source: Herman Miller 10-K report
Figure 4: Estimated market share
Source: Ferris estimates based on
BIFMA statistics
Figure 5: Annual % change in U.S.
office furniture production
Source: BIFMA
Figure 6: U.S. unemployment rate
Source: tradingeconomics.com
09 10 11
4. CFA Institute Research Challenge 1.22.12
4
China: high growth market. The overall Chinese furniture market has seen rapid growth over the past
decade, helped by increased living standards and a thriving real estate market. To put it into perspective, the
annual output of China’s furniture industry in 1978 was 1.3 billion Yuan. In 2006, it had exploded to over
400 billion Yuan (According to the National China Furniture Association). Obviously, this is not all office
furniture, but the growth of China’s overall furniture market is undeniable. Each year, China completes
infrastructure area of 1.2 billion square meters. This increase in infrastructure will drive demand for office,
healthcare, and educational furniture, among other products.
The biggest markets in China for office furniture are in the cities of Shanghai, Hong Kong, and Beijing.
These cities act as platforms for companies to expand into other areas of the country because of their good
distribution channels. Herman Miller currently has a manufacturing facility and design center near Shanghai.
Their acquisition of Hong Kong based POSH Office Systems will be crucial for them to expand their
international sales. With an expanded product offering in China, they can then look to expand into other
markets where they are currently absent. There is considerable Chinese competition, however. Many of
Herman Miller’s U.S. competitors have already acquired Chinese office furniture companies. Overall, the
Chinese furniture market is scattered, with room for companies to grow as overall growth remains high.
Latin America: great potential. Brazil is the largest producer and consumer of office furniture in Latin
America, followed by Argentina, Venezuela, and Colombia. Furniture companies in Brazil are very
fragmented, and a majority of the companies have less than 50 employees.
Herman Miller currently operates in Brazil, but would like to expand its sales not just in Brazil, but to other
countries in Latin America as well. An acquisition would allow Herman Miller easy access to these markets.
However, Herman Miller has not stated what their plans are for Latin America in particular. For now, their
exposure remains relatively small.
Additionally, emerging countries are seeing white collar growth. In India, white collar growth is coming
from both the urbanization of the country as well as outsourcing. White collar growth will increase the
demand for office furniture as more offices and staff are needed to keep up with the rising demand. The
Indian market presents a big opportunity for office furniture manufacturers. In fact, the Indian furniture
industry was recently estimated at around 350 billion Indian Rupees, or 6.8 billion U.S. Dollars.
Herman Miller’s competitive positioning.
Globally positioned manufacturing operations: In the United States, Herman Miller has manufacturing
facilities in four different states; Michigan, Georgia, Iowa, and Wisconsin. In Europe, they have a
manufacturing presence in the U.K. In Asia, they have a manufacturing plant in Ningbo, China (near
Shanghai). These locations give Herman Miller access to the global market.
Lean manufacturing: In 2009, Herman Miller underwent a restructuring in order to reduce their operating
expenses, which also improved efficiency and profitably. This restructuring included moving from five
manufacturing plants with three shifts to one manufacturing plant with one shift. Several years ago, Herman
Miller also began to change their operations. On the plant floor, assembly lines are constantly reviewed in an
effort to improve operations. Also, Herman Miller has an established relationship with Toyota Supplier
Support Centers that has helped them implement their world class, lean manufacturing processes that as a
whole are known as the Herman Miller Performance Systems. This lean production allows for reduced
inventories and space while at the same time increasing throughput.
Brand recognition: Herman Miller’s name is recognized as a leader in design and sustainability. Designing
solutions to meet customer needs is at the forefront of their strategy. Once the acquisition of POSH Office
Systems is completed, the company will look to leverage their brand name into China and eventually other
countries.
Innovation: Herman Miller is an innovator of furniture design, and has a unique commitment to employee
relations and the environment. Research and design is at the heart of this innovation.
Figure 7: Forecasted GDP per capita %
change
Source: IMF forecast
Figure 8: U.S. furniture imports by
country
Source: worldfurnitureonline.com
Figure 9: 10 year stock price
Source: Yahoo! Finance
Figure 10: Net Operating Cash Flow
(In USD millions)
Source: Ferris estimates
5. CFA Institute Research Challenge 1.22.12
5
Investment Summary
We initiate coverage of Herman Miller with a buy rating and a 12-month price target of $25.08, offering
21.3% upside from the current stock price. Herman Miller is a leader in researching, designing,
manufacturing, and distributing office furniture systems, products, and related services. The stock is currently
up 130% from its 10 year low on March 6, 2009.
Herman Miller’s management team is looking to increase sales in Asia and Latin America. They see plenty of
opportunity in these international markets. This is supported by their acquisition of POSH Office Systems in
Asia that is expected to close in the spring of 2012. Also, Herman Miller has made a recent push into the
healthcare furniture industry. Over the past ten years, they have gone from 9% to 24% of sales coming from
the health, home and education sector. As a result, we believe total revenues will grow at a 6.44% CAGR.
Also, EBIT will expand by 90 basis points from 2012-2015 as sales growth outpaces input costs.
Due to sales growth and improving margins, we expect Net Cash Flows from Operations to increase from
$91.1 million in 2011 to $140.9 million in 2015.
Our 12 month price target of $25.08 is based on a Discounted Cash Flow approach using a scenario analysis.
We used a base case, best case, and worst case analysis. We then weighted each outcome based on the future
economic outlook. This captures the benefits and risks apparent to the firm in our valuation.
The main risks associated with Herman Miller are: the conditions of the macro economy and inability to
expand into foreign countries. Herman Miller is very cyclical with the overall condition of the economy. If
there is another recession, they would see large drops in sales due to lack of new jobs and office creation.
Also, if Herman Miller is not able to expand into foreign markets as expected, their sales levels would
increase at much slower rates than currently forecasted.
Figure 1: Herman Miller news flow for past 12 months.
S
o
u
r
c
e
:
Y
Yahoo! Finance
Herman Miller
announces
agreement to
acquire POSH
Office Systems
Raymond
James cuts
price target
Europe woes bring down entire market
Fiscal Year
2011 net sales
up 25.1% YoY
2012 Q2 sales
miss estimates
Figure 15: Sales and EBIT ($ mil)
Source: Herman Miller 10-K
statement, Ferris estimates
Figure 17: EBIT and NOP margin
Source: Herman Miller 10-K
6. CFA Institute Research Challenge 1.22.12
6
Valuation
Our valuation is done by applying the Discounted Cash Flow approach to Herman Miller. The company does
not give out individual country information for its international business because none of the foreign
countries in which they operate are considered material enough to disclose based on quantitative and
qualitative factors. Therefore, we value Herman Miller’s assets as a whole. Valuations are made according to
the following assumptions.
Sales: will reach over $2 billion in 2015, growing at a 6.44% CAGR as the economy continues to recover. By
2015, Herman Miller will become more diversified across operating segments as Non-North American sales
increase from 18% to 23.2% of total revenue. Conversely, North American sales will decrease from 74.3% of
sales to 68% in 2015.
Capex: will continue to be important going forward. We estimate capital expenditures to be around 2.1% of
sales annually through 2012-2015.
Discounted cash flow analysis:
Our DCF analysis puts Herman Miller’s 12-month price target at $25.08. Within our DCF analysis, we
accounted for a base case scenario, along with a worst case and best case. For each scenario, FCF amounts
for 2012-2015, as well as terminal FCF are changed to appropriately reflect each scenario. We then assigned
a probability to each scenario and came up with our weighted average price. The three scenarios and their
assumptions are described below.
Base Case Scenario:
Our base case scenario values Herman Miller at $25.88. This scenario is the price we get under normal
conditions. Normal conditions meaning nothing major happening that would impact the company’s business,
GDP growth rates, or other economic factors. This would be our price target under a normal DCF analysis.
However, we feel that we need to capture risks and opportunities that are not present under the base case
conditions. This brings us to our worst and best case scenarios.
Worst Case Scenario:
Our worst case scenario values Herman Miller at $15.76. This scenario captures the risk of a global recession,
which we feel is very possible given the current situation of the global economic environment, particularly in
Europe. Under this case, companies would significantly cut back their spending on office furniture products.
The following assumptions are made regarding the worst case scenario.
We assume Herman Millers sale will decline at a -10% CAGR from 2012 to 2015, with sales bottoming out
near $1.15 billion, keeping them above recession levels of 09/10. We kept sales above the recent recession
levels because it was arguably the most severe collapse since the Great Depression. In addition, companies
have learned from this and are much leaner now. For terminal FCF, we assume this to be 25% lower than the
10 year historical average of $86.1 million.
Best Case Scenario:
Our best case scenario values Herman Miller at $34.53. This scenario captures the added sales Herman Miller
would see, given stronger than expected growth in the United States and the rest of the world. The following
assumptions are made regarding the best case scenario.
Herman Miller sales will rise at a 14.8% CAGR from 2013-2015, just as they did from 1977-2000. Terminal
FCF is assumed to be 30% higher than the $96.9 million FCF obtained under the base case scenario in 2015.
In the best and worst case scenarios, revenue amounts and free cash flows are changed to better reflect
valuations under each scenario. Other parts of the income statement and balance sheet we assume remain
unchanged (in percentage to sales).
Our three scenarios give us three very different price targets. To capture all three, we assigned probabilities to
each to come up with a weighted average price. We assign a 55% probability to the base case, a 25%
probability to the worst case, and a 20% probability to the best case scenario. These probabilities stem from
current economic forecasts, but have been adjusted to reflect what we feel is appropriate.
FCF and terminal value amounts, as well as WACC assumptions are summarized in Appendix #4.
Figure 13: Valuation
Price Target 25.08$
Base Case 25.88$
Worst Case 15.76$
Best Case 34.53$
Source: Ferris estimates
Figure 14: Probabilities assigned to
each scenario
Probabilities
Base Case 55%
Worst Case 25%
Best Case 20%
Source: Ferris estimates
Figure 11
DCF characteristics
2012-2015 FCF +
Perpetuity
Source: Ferris estimates
Figure 12
Perpetuity characteristics
WACC 7.04%
growth rate 1.075%
Source: Ferris estimates
Figure 16: Long-term debt ($ mil)
Source: Herman Miller 10-K
7. CFA Institute Research Challenge 1.22.12
7
Financial Analysis
Revenue and EBIT: In North America, fiscal 2011 net sales totaled $1.65 billion, a 25.1% increase from
2010. All sectors of the North American business saw growth in sales. EBIT was $123.3 million (7.5% of
sales) in 2011, representing a huge 130% increase from just a year ago as the economy recovered. We expect
Herman Miller net sales to grow to $1.74 billion, and EBIT to reach $138.2 million in fiscal year 2012.
Margins will improve slightly due to sales growth outpacing input costs. We expect the cost of direct
materials to grow at a rate below the 6.44% CAGR sales growth, with added benefit coming from continued
operational efficiencies in direct labor, and overhead costs benefitting from increased leverage from higher
sales volume (Direct materials price forecasts are provided in Appendix #7). We assume SG&A expenses to
be around 22% of sales going forward. Accordingly, EBIT margin of 7.5% in 2011 will increase to 8.8% in
2015.
EPS: Diluted EPS was $1.06 for fiscal year 2011. We expect this to increase by 36% to $1.44 for 2012, and
to $2.13 by 2015.
Cash Flow: net operating cash flow will increase from sales growth and margins. In 2011, net operating cash
flow was $91.1 million, and we predict this will reach $140.9 million in 2015. In percentage terms,
OCF/Sales will increase to 6.7% in 2015. This increase in cash flow will be used to help finance capital
expenditures totaling $159 from 2012-2015. We also expect Herman Miller to continue with acquisitions to
help grow their business. We expect acquisitions to total $90 million from 2012-2015.
Balance Sheet & Financing: The balance sheet is expected to improve as the company looks to de-risk its
balance sheet by funding future pension obligations. Also, Herman Miller has reduced their long term debt.
They had $375 million in long term debt in 2008. They currently have $250 million worth of debt, with the
next payment not due until 2015.
Changes in operating segment mix: Herman Miller will further diversify its geographic mix as its growth
from overseas will outpace its growth from North America. Non-North America will increase to 23.2% in
2015. Additionally, the Specialty and Consumer segment will increase to 8.8% in 2015 with higher sales
coming from the Herman Miller Collection.
Corporate Governance and Sustainability
It is our opinion that corporate governance and sustainability is the cornerstone of all moral and ethical
business practices. Firms with strong corporate governance and sustainability enhance their business
relationships and practices, enabling the firm to grow and prosper within their respective business sectors.
Corporate Governance
Herman Miller believes “a proper structure, appropriate policies and procedures, and reflective cultural
factors provide the cornerstone to good governance”1
. Accordingly, they believe their reputation is a
priceless asset. To secure the safety of their reputation and proper governance, Herman Miller strives to
“consistently operate at the highest standards of business.”2
To ensure compliance, Herman Miller publishes
their governance by-laws on the corporation’s website and they are reviewed on an annual basis by the
Nominating and Governance Committee of the Board of Directors of the company; a report of findings and
recommendations is presented to the Board. The internal governance of the firm has earned Herman Miller a
conservative accounting and governance risk (AGR) rating in the 92nd
percentile and an equity risk factor of
4. Results are reported in Appendix #6.
Sustainability
Environmental Sustainability is a key issue in the office furniture manufacturing sector. And within the
sector, Herman Miller is seen as one of the leaders in sustainability. Since 1991, Herman Miller has been
recognized for their environmental conscious practices. Herman Miller is dedicated to reducing its carbon
footprint. Presently, they strive for economic, environmental, and social equity through their “Perfect Vision”
initiative outlined in their Better World Report. The main goals of the initiative are to reduce landfill,
hazardous waste, air emissions, and process water use to zero by the year 2020.
Herman Miller’s efforts for a better world have earned them a wide variety of recognitions: ranked #1 in
FORTUNE’s “Most Admired” companies survey, eight consecutive listings in the Dow Jones Sustainability
Index, Social Innovation Award for “Best Sustainability Performance”, EPA WasteWise Award for Green
1
http://www.hermanmiller.com/MarketFacingTech/hmc/about_us/Investors/shared_assets/HMI_2011_PROXY_STATEMENT.pdf
2
http://www.hermanmiller.com/About-Us/For-Our-Investors/Corporate-Governance
Figure 18: Earnings per share ($)
Source: Herman Miller 10-K, Ferris
estimates
Figure 19: Segment revenues ($)
Source: Ferris estimates
Figure 20
Environment 0 lbs ofwaste by 2020
88% overall footprint
reduction
100% green energy usage
Community 3 yr goal of45,000 hours
ofcommunity service
437,225 miles saved by
car/bike pooling
Social Programs Spring fashion show for
local womens center
Distribute school supplies
to West Michigan children
CG and Sustainability
Source: Herman Miller website
Figure 21: Aluminum spot price in US
Dollars per metric ton (monthly)
0.00
1,000.00
2,000.00
3,000.00
4,000.00
Source: indexmundi.com
8. CFA Institute Research Challenge 1.22.12
8
Purchasing, a “Sector Leader” and “Sector Mover” in Sustainable Asset Management (SAM) “Sustainability
Yearbook 2011”, and a perfect score for the four straight year in the Human Rights Campaign’s Corporate
Equality Index.
Investment Risks
Failure to penetrate growth markets of Asia and Latin America. Herman Miller sees its biggest growth
opportunities in the next five years coming from Asia and Latin America. If they are unsuccessful in
executing their international strategy, this would have an adverse effect on top line growth.
Macro-economic conditions: Much of Herman Miller’s sales are dependent on U.S. commercial activity.
CEO sentiment, the Architectural Billings Index, and corporate profit levels are the most highly correlated to
Herman Miller’s sales, according to our correlation analysis. Given the cyclical nature of Herman Miller’s
business, a slowdown in commercial activity would severely hurt sales. Their manufacturing strategy does
help to control costs, and gives them the ability to maintain profitability in bad times. On the other hand, a
stronger economy would improve revenue and margins.
Increase in raw material costs: Steel, plastic, textiles, wood particleboard, crude oil and aluminum make up
Herman Miller’s raw material costs. They do not hedge these costs. Steel is the biggest raw material cost for
Herman Miller. Spot aluminum prices are near two year lows and steel prices are near three year lows.
However, these raw material costs will almost certainly increase given a stronger economy. Sometimes to
offset rises in these costs, Herman Miller will implement price increases, as they did this past year.
The U.S. Government: Accounting for 14% of Herman Miller’s net sales in fiscal year 2011, Herman Miller
sells to the U.S. government both through a GSA Multiple Award Schedule Contract and through competitive
bids. There is some risk of Herman Miller losing sales from either changing laws or changes in government
budgets. The company maintains that whoever wins the 2012 election would not impact any material
renegotiation of contracts.
Stronger competition: Herman Miller operates in a competitive business environment. Should competition
take market share from Herman Miller, they may need to increase marketing or reduce prices, either of which
would impact margins. However, we believe this risk is partially mitigated as Herman Miller has strong
brand recognition. Internationally, competition is strong both from Herman Millers’ U.S. competitors who
have already established themselves in China, and from domestic Chinese companies.
Employee health benefits and pension expenses: Future funding obligations could be impacted by changes
in interest rates, equity securities held under employee benefit plans, and changes in laws and regulations.
Pension expense non-current liabilities have averaged 78.3 million the past two years. Herman Miller plans to
use cash to increase its funding to its pension obligations in the future, so they can reduce the risk of their
balance sheet. In 2011, other liabilities were $87.2 million, down from $176.3 million in 2010.
Foreign exchange rate risk: 77% of Herman Miller’s revenue came from North America and 23% came
from internationally in 2011. The 23% international and a portion of the North American revenue coming
from Canada expose them to exchange rate risk. The currency having the most effect on earnings in recent
years has been the Canadian Dollar. Other currencies that could affect operating earnings are the U.S. Dollar
paired against the: Australian Dollar, British Pound, Euro, Mexican Peso, Japanese Yen, and Chinese Yuan.
To help minimize this risk, Herman Miller buys forward contracts to control P&L, and their manufacturing
strategy gives them protection by acting as a natural hedge. Nevertheless, margins could be impacted in the
future.
Failure to acquire POSH Office Systems: If Herman Miller does not successfully acquire POSH, it would
make it more difficult for them to increase their international presence as POSH offers them direct access to
the Chinese market. However, they do have a manufacturing plant currently in China. Even though the deal is
taking longer to go through then initially thought, it has allowed Herman Miller to make adjustments that will
better position them for long term success in the country. Herman Miller expects the deal to close in the
spring of 2012 and sees little risk at this point.
Figure 22: Global steel prices in US
Dollars per ton (past 3 years)
0
500
1000
1500
2000
2500
3000
3500
4000
4500
Mar-09
Jul-09
Nov-09
Mar-10
Jul-10
Nov-10
Mar-11
Jul-11
Nov-11
Global Composite Stainless Steel
Global Composite Carbon Steel
Source: worldsteelprices.com
Figure 23: CEO confidence on
global economy
Source: PwC Global CEO confidence
survey
9. CFA Institute Research Challenge 1.22.12
9
Appendix 1: Income Statement (in millions except EPS)
company's fiscal year 2010 2011* 2012E 2013E 2014E 2015E
Net Sales 1318.8 1649.2 1744 1842 1965 2103
% growth -19.1% 25.1% 5.7% 5.6% 6.7% 7.0%
By Operating Segment
North American 1096.1 1224.8 1263 1312 1368 1430
% growth 3.1% 3.9% 4.3% 4.5%
Non-North American 222.7 290.4 327 372 425 488
% growth 12.60% 13.76% 14.25% 14.82%
Specialty and Consumer - 134 146 158 172 185
% growth 9.0% 8.2% 8.9% 7.6%
Cost of sales 890.3 1111.1 1168 1232 1312 1400
% sales 67.5% 67.4% 67.0% 66.9% 66.8% 66.6%
Gross Margin 428.5 538.1 576.0 610 653 703
% of sales 32.5% 32.6% 33.0% 33.1% 33.2% 33.4%
Selling, general, and admin. 334.4 369 388.9 407.1 432.3 458.5
% sales 25.4% 22.4% 22.3% 22.1% 22.0% 21.8%
Design and research 40.5 45.8 48.8 51.6 55.0 58.9
% sales 3.1% 2.8% 2.8% 2.8% 2.8% 2.8%
Operating Earnings 53.6 123.3 138.3 151.3 165.7 185.7
% of sales 4.1% 7.5% 7.9% 8.2% 8.4% 8.8%
Interest expense 21.7 19.9 18.7 15 17 18
Interest/investment income (4.6) (1.5) (0.7) 0.5 (0.1) (0.2)
Other, net 1.7 2.4 1.9 1.8 1.7 1.7
Earnings before taxes 34.8 102.5 118.4 134.0 147.1 166.2
% of sales 2.6% 6.2% 6.8% 7.3% 7.5% 7.9%
Income Tax Expense 6.5 31.7 34.9 36.8 39.3 42.1
Net Earnings 28.3 70.8 83.5 97.2 107.8 124.1
Net Profit Margin 2.1% 4.3% 4.8% 5.3% 5.5% 5.9%
Earnings Per Share -Basic 0.51 1.06 1.44 1.67 1.85 2.13
*As of Q1 12, Herman Miller changed the way it reports its operating segments. The company only revised
its numbers one year back. Therefore, 2010 numbers are only comprised of N.A. and non N.A. since exact
amounts are not known for Specialty and Consumer.
10. CFA Institute Research Challenge 1.22.12
10
Appendix 2: Balance Sheet (in millions $)
2010 2011 2012E 2013E 2014E 2015E
Cash and equivalents 134.8 148.6 156.2 158.1 169.8 184.6
Marketable securities 12.1 11.0 11.6 11.7 12.6 13.7
Accounts receivable, net 144.7 193.1 191.8 202.6 216.2 231.3
Inventories, net 57.9 66.2 69.3 72.5 75.8 79.3
Prepaid expenses and other 46.4 59.2 58.0 59.2 60.4 61.6
Total Current Assets 395.9 478.1 486.9 504.1 534.7 570.5
Fixed Assets 175.2 169.1 173.1 175 178 182
Goodwill 132.6 133.6 134.7 135.7 136.8 137.9
Other amortizable intangibles, net 25 24.3 28.0 28.6 29.1 29.7
Other assets 41.9 9.3 25.6 25.9 26.1 26.4
Total Assets 770.6 814.4 848.3 869.2 904.8 946.5
Unfunded checks 4.3 6.4 5.4 5.4 5.5 5.5
Current maturities of LT debt 101.2 - - - - 50
Accounts payable 96.3 112.7 122.1 128.9 137.6 147.2
Accrued liabilities 112.4 153.1 172.3 180.9 190.0 199.5
Total Current Liabilities 314.2 272.2 299.7 315.3 333.0 352.2
Long term debt 200 250 250 225 225 200
Other liabilities 176.3 87.2 86.8 79.3 70.1 67.0
Total Liabilities 690.5 609.4 636.6 619.5 628.0 619.2
Common stock (.2 par value) 11.4 11.6 11.6 11.7 11.7 11.8
Additional paid-in capital 55.9 82 69.0 55.2 55.2 55.2
Retained earnings 152.4 218.2 242.2 292.8 318.9 368.3
Accumulated other comprehensive loss (136.2) (104.2) (108.0) (106.9) (105.9) (104.8)
Key executive deferred compensation (3.4) (2.6) (3.0) (3.1) (3.1) (3.2)
Total Shareholders Equity 80.1 205 211.8 249.7 276.8 327.3
Total Liabilities and SE 770.6 814.4 848.3 869.2 904.8 946.5
11. CFA Institute Research Challenge 1.22.12
11
Appendix 3: Statement of Cash Flows (in millions $)
2010 2011 2012E 2013E 2014E 2015E
Net Income 28.3 70.8 83.5 97.2 107.8 124.1
Depreciation, Depletion, Amortization 42.6 39.1 38.2 37 35.4 32
Deferred income taxes (1.5) 24.2 11.4 11.3 11.2 11.1
Total other cash flow 24.9 (29.5) (17.6) (10.5) (7.6) (6.8)
Funds From Operations 94.3 104.6 115.5 135.0 146.8 160.4
Receivables 9 (48.5) 0.7 (7.1) (12.7) (16.5)
Inventories (7.1) (8.3) (3.1) (3.3) (3.3) (3.5)
Accounts payable 13.9 16.4 9.7 3.6 8.1 10.5
Other accurals (34.6) 41.4 (19.2) (8.6) (9.1) (9.5)
Oher assets/liabilities 23.6 (14.5) 6 (6.4) (2.1) (0.5)
Funds from/for other Operating Activities 4.8 (13.5) (5.9) (21.8) (19.1) (19.5)
Net Cash Flow- Operating Activities 99.1 91.1 109.6 113.2 127.7 140.9
Increase in investments (16.3) (3.1) (7.9) (9.1) (5.5) (5.3)
Decrease in investments 16.4 4.4 8.7 10.9 4.4 3.4
CAPEX (22.3) (30.5) (36.0) (38.0) (41.0) (44.0)
Disposal of fixed assets 0.7 1 0 0 0 0
Net Assets from acquisitions (46.1) 0 (30.0) (25.0) (20.0) (15.0)
Other sources (uses)-investing (10.0) (3.2) (5.0) (2.0) (1.0) (1.0)
Net Cash Flow - Investing Acitivities (77.6) (31.4) (70.2) (63.2) (63.1) (61.9)
Long term borrowings 0 50 0 0 0 0
Reduction in long term debt (75.0) (100.0) (25.0) 0 0 (50.0)
Net proceeds from sale/issue of stock 2.5 8.6 5.6 5.8 5.8 5.8
Stock redeemed, retired, converted,etc. (0.8) (1.0) (2.0) (14.1) (14.1) (14.1)
Cash dividends paid (4.9) (5.0) (5.0) (5.0) (5.0) (5.0)
Other sources (uses)-financing (0.7) (2.8) (1.7) (2.0) (2.4) (2.4)
Net Cash Flow - Financing Activities (78.9) (50.2) (28.1) (15.3) (15.7) (65.7)
Effect of exchange rate on cash (0.70) 4.30 2.50 1.50 1.50 1.50
Increase/Decrease in Cash and equilvalents (58.1) 13.8 13.8 36.2 50.3 14.7
12. CFA Institute Research Challenge 1.22.12
12
Appendix 4: DCF Assumptions
Terminal Value: We calculated FCF’s up until year 2015. After that, we resort to terminal values to compete our analysis. The terminal
values are based on different assumptions from our worst, best, and base case scenarios. Our terminal growth rate is set at 1.075%. We
found this by taking a weighted average between the average U.S. GDP percent growth rate of .82% for the past five years and the fifteen
year annualized return of the S&P 500 of 1.33%. Any terminal growth rate higher than market returns assumes that Herman Miller’s cash
flows would outpace the economy which we do not feel is appropriate in the long run.
Weight Average Cost of Capital.
Description:
WACC 7.08%
Cost of Debt 6.24% Average cost of outstanding debt (after tax cost of debt used in wacc formula)
Series Asenior notes (due Jan. of 2015) 5.94% 20% of debt
Series B senior notes (due Jan. of 2018) 6.42% 60% of debt
Debt securities (due March of 2021) 6.00% 20% of debt
Tax Rate 33% Tax rate taken from Herman Miller's 10-Q report
Cost of Equity 10.24% CAPM Model
Risk free rate 1.92% Yield on 10 yr U.S. Treasury Note as of 1/13/12
Market risk premium 6.04% Implied equity risk premium on 1/1/12 (Source:http://pages.stern.nyu.edu/~adamodar/)
Beta 1.27 As of 1/13/12 (Source: Yahoo! Finance)
Country risk premiums 0.005 country's default spread * relative market volatility for that country (Source: Damodoran)
Gearing Ratio (Total D/E) 1.09 Source: advfn.com
Weight of Debt 52.2%
Weight of Equity 47.8%
Country risk premium =(avg Europe risk premium*3% of MLHR revenues) + (avg premium of China, India, Brazil, Japan, and Mexico*20% of MLHR rev)
A detailed analysis of our worst, best, and base case scenarios is shown below.
(in millions, except per share data) 2010 2011 2012E 2013E 2014E 2015E
Cash FlowFrom Operations 99.1 91.1 109.6 113.2 127.7 140.9
CAPEX 22.3 30.5 36 38 41 44
% of sales 1.7% 1.8% 2.1% 2.1% 2.1% 2.1%
FCF 76.8 60.6 73.6 75.2 86.7 96.9
PVPerpetuity 1327.9 1630.4
PVof 2012-2015 278.6
PV of FCF's 1606
plus Cash 148.6
minus Debt 250
Equity Value 1505.1
divide shares outstanding 58.16
Fair Value/share 25.88$
Base Case Scenario
Free Cash Flow Formula = (terminal FCF* perpetuity growth rate) / (wacc-perpetuity growth rate)
13. CFA Institute Research Challenge 1.22.12
13
(in millions, except per share data) 2010 2011 2012E 2013E 2014E 2015E
Cash FlowFrom Operations 99.1 91.1 85.0 75.6 53.0 51.0
CAPEX 22.3 30.5 36 25 25 25
FCF 76.8 60.6 49.0 50.6 28.0 26.0
PVPerpetuity 885.3 1087.0
PVof 2012-2015 132.5
PV of FCF's 1018
plus Cash 148.6
minus Debt 250
Equity Value 916.4
divide shares outstanding 58.16
Fair Value/share 15.76$
Worst Case Scenario
(in millions, except per share data) 2010 2011 2012E 2013E 2014E 2015E
Cash FlowFrom Operations 99.1 91.1 125.4 153.0 145.3 193.8
CAPEX 22.3 30.5 36 38 41 44
FCF 76.8 60.6 89.4 115.0 104.3 149.8
PVPerpetuity 1726.9 2120.3
PVof 2012-2015 382.7
PV of FCF's 2110
plus Cash 148.6
minus Debt 250
Equity Value 2008.2
divide shares outstanding 58.16
Fair Value/share 34.53$
Best Case Scenario
14. CFA Institute Research Challenge 1.22.12
14
Appendix 5: Economic Indicators
Some of the leading economic indicators that are thought to influence the office furniture industry are compared against Herman Miller’s
year over year sales changes from 2002-2011 to see how much correlation, if any, each indicator has Herman Miller’s sales.
Herman Miller CEO unemployment office Architectural corporate profits
Year sales % change confidence rate vacancy rates Billings Index (% change YoY) (% change YoY)
2002 -9.0% 26% 6.0% 14.5% -6.7% 4.6%
2003 0.1% 31% 5.7% 16.5% 9.5% 12.1%
2004 13.2% 41% 5.4% 16.3% 8.7% 32.2%
2005 14.6% 45% 4.9% 15.3% -4.0% 29.0%
2006 10.5% 52% 4.4% 13.8% 6.3% 10.5%
2007 4.9% 50% 5.0% 12.8% 11.8% -6.6%
2008 -19.0% 21% 7.3% 12.8% -12.3% -9.4%
2009 -19.1% 31% 10.0% 15.0% -32.0% 6.9%
2010 25.1% 48% 9.4% 17.2% 26.5% 13.7%
2011 5.7% 40% 8.5% 17.4% 32.3% n/a
Correlation 0.82 -0.25 0.49 0.74 0.61
Sources: Herman Miller stock price - Yahoo! Finance Strong Correlation .7 and above
CEO confidence - PwC Global CEO cofidence survey Moderate Correlation .3 through .7
unemployment rate- tradingeconomics.com Weak Correlation 0 through .3
office vacancy rates - calculatedriskblog.com
ABI - calculatedriskblog.com
corporate profits (after-tax) - Ycharts.com
Appendix 6: Corporate Governance and Sustainability
The following charts shows how Herman Miller stacks up against its peers in the Accounting and Governance Risk (AGR) Rating. Like
most of its peers, it has received a conservative rating, ranking it in the top 8 percentile.
Company
GMI AGR
Rating
Percentile
Equity Risk
Factor
Valuation
Herman
Miller
[MLHR]
Conservative 92nd
4 Out-perform
HNI Corp
[HNI]
Conservative 87
th
5 Best
Knoll
[KNL]
Average 50th
3 Average
Kimball
Intl.
[KBALB]
Conservative 99th 5 Best
SteelCase
[SCS]
Conservative 90
th
4 Out-perform
Source: Governance Metrics International (GMI)
15. CFA Institute Research Challenge 1.22.12
15
Appendix 6:
2011 2012E 2013E 2014E 2015E
North America 74.3% 72.4% 71.2% 69.6% 68.0%
Non-North America 17.6% 18.8% 20.2% 21.6% 23.2%
Specialty & Consumer 8.1% 8.4% 8.6% 8.8% 8.8%
More diversified revenue stream
Source: Herman Miller 10-K Statement, Ferris estimates
Appendix 7: Direct materials prices and forecasts
Steel Futures Aluminum Futures (per ton) Lumber ICEBrent Crude
Price as of 1-21-12 550 2180.5 253 109.8
Forecasted 2012price 509 2408 265 115
Forecasted 2013price 565 2508 290 121.25
CAGR 1.35% 7.25% 7.06% 5.08%
Total avg CAGR 5.19%
Source: London Metals Exchange London Metals Exchange BMO Capital JP Morgan
Steel futures are expected to increase only slightly as a major component of steel, iron ore, is projected to remain low for the next few
years. Aluminum is currently expecting a 7.25% CAGR for prices in the next 2 years in the futures market, which is consistent with the
aluminum forecast from Goldman Sachs. Lumber is also expected to increase as the housing market appears to have bottomed and be on
the rebound. Almost all investment firms researched see ICE Brent Crude increasing in the future. We used JP Morgan’s forecast of 5.08%
CAGR.
We found the total average CAGR for Herman Millers direct material costs to be 5.19%. This is below our sales growth forecast of 5.7% in
years 2012 and 2013. We did not include forecasts for 2014 or 2015 simply because there are very few forecasts that extend that far and
they are more likely to be inaccurate.
Appendix 8:
Significant Financial Ratios
2010 2011 2012E 2013E 2014E 2015E
Profitability Ratios
EBIT Margin 4.1% 7.5% 7.9% 8.2% 8.4% 8.8%
Return on Sales 2.1% 4.3% 4.8% 5.3% 5.5% 5.9%
Return on Worth 35.3% 34.5% 40.8% 42.3% 40.5% 39.2%
Gearing Ratio
Total Debt to Equity 2.5x 1.22x 1.18x .98x .81x .61x
Cash Flow Ratios
OCF over Sales 7.5% 5.5% 6.3% 6.2% 6.5% 6.7%
OCF over Earnings 3.5% 1.3% 1.5% 1.2% 1.2% 1.1%
Market Ratios
EPS $0.51 $1.24 $1.44 $1.67 $1.85 $2.13
16. CFA Institute Research Challenge 1.22.12
16
Appendix 9: Main competitors and price segments in which they operate
U.S. market share 12.4% 10.9% 20.9% 17.9%
High
Mid-high
Mid-low
Budget
PriceRange
Source: Ferris estimates based on BIFMA, Knoll Investor Presentation 2009
Appendix 10:
25.88 $90.00 $92.00 $94.00 $96.00 $98.00 $100.00
7.3% $23.42 $23.90 $24.38 $24.86 $25.34 $25.83
7.2% $23.76 $24.24 $24.73 $25.22 $25.71 $26.20
7.1% $24.10 $24.60 $25.09 $25.59 $26.08 $26.58
7.0% $24.46 $24.96 $25.47 $25.97 $26.47 $26.98
6.9% $24.83 $25.34 $25.85 $26.36 $26.87 $27.39
6.8% $25.21 $25.73 $26.25 $26.77 $27.29 $27.81
6.7% $25.60 $26.13 $26.66 $27.19 $27.72 $28.25
DCF sensitivity analysis (WACC , Terminal FCF)
Disclosures:
Ownership and material conflicts of interest:
The author(s), or a member of their household, of this report [holds/does not hold] a financial interest in the securities of this company.
The author(s), or a member of their household, of this report [knows/does not know] of the existence of any conflicts of interest that might bias the content or
publication of this report. [The conflict of interest is…]
Receipt of compensation:
Compensation of the author(s) of this report is not based on investment banking revenue.
Position as a officer or director:
The author(s), or a member of their household, does [not] serves as an officer, director or advisory board member of the subject company.
Market making:
The author(s) does [not] act as a market maker in the subject company’s securities.
Ratings guide:
Banks rate companies as either a BUY, HOLD or SELL. A BUY rating is given when the security is expected to deliver absolute returns of 15% or greater
over the next twelve month period, and recommends that investors take a position above the security’s weight in the S&P 500, or any other relevant index.
A SELL rating is given when the security is expected to deliver negative returns over the next twelve months, while a HOLD rating implies flat returns over
the next twelve months.
Disclaimer:
The information set forth herein has been obtained or derived from sources generally available to the public and believed by the author(s) to be reliable, but
the author(s) does not make any representation or warranty, express or implied, as to its accuracy or completeness. The information is not intended to be used
as the basis of any investment decisions by any person or entity. This information does not constitute investment advice, nor is it an offer or a solicitation of
an offer to buy or sell any security. This report should not be considered to be a recommendation by any individual affiliated with [Society Name], CFA
Institute or the CFA Institute Research Challenge with regard to this company’s stock.