
Recommended
Recommended
More Related Content
Similar to Core 1 Presentation CQ1
Similar to Core 1 Presentation CQ1 (20)
Recently uploaded
Recently uploaded (20)
Core 1 Presentation CQ1
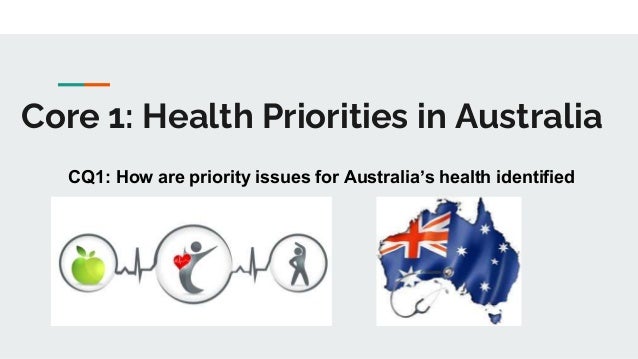
- 1. Core 1: Health Priorities in Australia CQ1: How are priority issues for Australia’s health identified
- 2. The stuff you need to know…. The context in which we apply it...
- 3. BOOKMARK THIS WEBSITE AND DOWNLOAD THE PDF Australia’s health 2020: in brief (Full publication;23July2020Edition)(AIHW)
- 4. Measuring Health Status Role of epidemiology Measures of epidemiology (mortality, infant mortality,morbidity, life expectancy)
- 5. Role of Epidemiology EPIDEMIOLOGY: The study of disease in groups or populations through the collection of data and information, to identify patterns and cause. PREVALENCE: The number of cases of disease that exists in a defined population at a point in time INCIDENCE: The number of new cases of disease occurring in a defined population over a period of time. Epidemiology is used by Governments and health-related organisations to obtain a picture of the health status of a population.
- 6. What does it epidemiology do? WHAT CAN IT TELLS US? Considers patterns to determine: WHO USES THESE MEASURES…. Helps researchers and health authorities: SOME OF THE MEASURES... Looks at data such as Prevalence Incidence Distribution (the extent of the issue) The apparent causes (either determinants or indicators for disease) Describe and compare the patterns of health of groups, communities and populations Identify health needs and allocate health resources Evaluate health behaviours and strategies to control and prevent disease Identify and promote behaviours to improve health (e.g. lower sugar intake) Governments, NGOs, health department, medical practitioners etc... -Births -Deaths -Disease incidence -Disease prevalence -Contact with health-care providers -Hospital use -Injury incidence -Work days lost -Money spent on health care
- 7. Limitations Whilst epidemiology has been a proven method of measuring health status, there are limitations. These include; - Largely objective data, therefore some subjective measures can be difficult to gauge e.g. life expectancy provides valuable statistical information, but quality of life measures, however, are far more subjective and often rely on self reporting tools which can be less reliable. - Does not explain the why for health inequities. - Numerous sources of information - Varying levels of reliability - Imprecise methods of data collection - No standardisation of instruments, defintions and classifications
- 8. MEASURES OF EPIDEMIOLOGY (mortality, infant mortality, morbidity, life expectancy) MORTALITY: A measure of the number of deaths in a given population over a period of time (most commonly a year). Usually represented per 100,000 of the population. Decreasing INFANT MORTALITY: A measure of infant deaths in the first year of life (0-1yrs old), per 1000 live births. Decreasing MORBIDITY: The incidence or level of illness, disease or injury in a given population. Decreasing for most major health conditions (or at least occurring later in people’s lives) - Survival rates increasing unfortunately so is the incidence of diabetes and mental health problems. LIFE EXPECTANCY: The average number of years a person can expect to live if the existing mortality patterns continue. Increasing
- 9. Mortality In 2020, there were 161,300 deaths in Australia (52.4%M, 47.6% F). These deaths had a wide range of causes but some were more common than others. The leading causes of death in Australia (according to ‘Australia’s Health in Brief remember the link at the start of the unit that you bookmarked and downloaded the PDF) are: Although Coronary Heart Disease is number 1, in 2016 Cancer (all types combined) took over as the leading cause of death. Coronary Heart Disease remains, however, the leading single cause. Potentially avoidable death rate fell by 41% between 199 and 2019 What is the order? Make sure the order is correct in your notes
- 10. Important to understand Tables & Graphs Based on the table ● What is the combined leading cause of death? ● What is the leading cause death for males? ● What is the leading cause of death for females? ● What is responsible for more deaths – lung cancer or Cerebrovascular disease? ● Which is responsible for more deaths in the given area: Males – COPD or Females – Lung cancer
- 12. Mortality In 2020: ● The leading cause of death was ischaemic heart diseases (IHD). ● Dementia, including Alzheimer's disease was the second leading cause of death. People who died from dementia had a high median age at death of 89.1. ● Cerebrovascular diseases, lung cancer and chronic lower respiratory diseases rounded out the top five leading causes. ● Deaths from the five leading causes all decreased from 2019. ● There were 55 deaths due to influenza. Influenza and pneumonia dropped to the 17th leading cause of death (down from the 9th leading cause in 2019). The ranking of influenza and pneumonia is influenced by the severity of the flu season. ● Suicide was the 15th leading cause of death. People who died from suicide had median age at death of 43.5. ● COVID-19 was the 38th leading cause of death, with 898 deaths recorded through the civil registration system. ● From 2011 to 2020: ● Deaths due to Ischaemic heart diseases and Cerebrovascular diseases decreased by 22.9% and 15.8% respectively. ● Deaths due to Dementia, including Alzheimer's disease increased by 47.8% (4,711 deaths).
- 13. MORTALITY TREND = DECREASING
- 15. Males
- 16. Females
- 17. Summary The 10 leading causes of death in 2018 were generally the same as in 2008, albeit with different rankings (Figure 3). • For males, coronary heart disease was the leading cause of death in both these years, accounting for 17% of deaths in 2008 and 13% in 2018. However, the death rate from coronary heart disease has decreased over the decade. The largest change in leading causes of death for males from 2008 to 2018 was the rise of dementia including Alzheimer’s disease, from seventh to third place. • For females, coronary heart disease, cerebrovascular disease, breast cancer and colorectal cancer fell in rank from 2008 to 2018. On the other hand, there were notable increases—for dementia including Alzheimer’s disease (from third to first place) and for COPD (from seventh to fifth place).
- 18. Infant Mortality This measure is considered to be the most important indicator of the health status of a nation and can also predict life expectancy. It is divided into; - neonatal (deaths in first 28 days of life) = influenced by maternal and neonatal care - post-neonatal (day 29-1 yr) Infant mortality rate was 3.3 deaths per 1000 live births in 2017
- 19. INFANT MORTALITY TREND = DECREASING Regional and remote areas accounted for 38% of premature deaths Mortality rates are between 1.2 and 3.8 times as high in regional and remote areas than in major cities More premature deaths are males (62% vs 38%) Has improved due to: - Improved medical diagnosis - Improved public sanitation - Health education - Improved support services
- 20. Morbidity Illness, disease and injury are all conditions that reduce our quality of life. Information about the prevalence and incidence of these conditions gives us a better perspective of the Nations health.
- 21. MORBIDITY TREND = DECREASING WITH SURVIVAL RATES INCREASING. DIABETES AND MENTAL HEALTH ISSUES INCREASING Morbidity measures: - Hospital Use - Doctor visits and Medicare statistics - Medicare is Australia’s public-funded universal health care system. Providing free or low cost medical, optometric and hospital care. Federal Government funding. - Health surveys and reports - Disability and handicap statistics *DALY - Disability-adjusted life years (think of 1 DALY as 1 year of healthy life lost)
- 22. Life Expectancy = INCREASING Life expectancy is continually increasing. A child born between 2016-18 can expect to live to 84.9 (females – ½ a year more than previous report) or 80.7 (males – a 1/3 a year more than previous report). This is attributed to: - Lower infant mortality - Declining death rates from CVD - Declining overall death rates from cancer - Fall in deaths from traffic accidents
- 25. The burden of illness and the potential to reduce this burden is the greatest significant consideration of the Government when prioritising health funding.
- 30. Identifying priority health issues Principles of Social Justice Priority Populations Groups Prevalence of condition Potential for prevention and early intervention Costs to the individual and community
- 31. Identifying Priority Health Issues P - Principles of Social Justice (Remember SEED??) P - Priority Populations Groups P - Prevalence of Condition P - Potential for Prevention and Early Intervention C - Cost to the Individual and Community Priority groups are identified on; - Their contribution to the burden of illness in the community - The potential for the reduction of this burden Priority groups include; - ATSI - Low SES - Rural and Remote - People born overseas - Elderly - People with disabilities
- 32. SEED - The Social Justice Principles Supportive Environments: All Australians have the right to be healthy. Environments need to be structured so that they are supportive of this. Examples include: Provision of health services/products at affordable or no cost, products/services are located in metropolitan, rural and remote locations and providing products/services that help people overcome difficulties associated with disabilities. Give 2 examples Equity: Ensuring that resources are allocated fairly so that all Australians have the opportunity to be healthy. This may mean resources are allocated to some groups/communities in greater amounts. Give 2 examples Diversity: Australia has a diverse population with diverse health needs. Each group’s issues must be met. E.g. Greater volume of services and facilities for our aging population, Medicare demonstrate diversity with translation services, community initiatives making citizens born overseas aware of the available health services. Give 2 examples
- 33. Some Examples Medicare: provides essential medical care at an affordable cost, or at no cost, so that socioeconomic factors should not restrict a person’s capacity to receive the treatment they need. Federally Funded Pharmaceutical Benefits Scheme (PBS): Subsidises (reduces) the cost of selected drug treatments deemed to be life-saving or adding significantly to quality of life. Several costly drug therapies for cardiovascular disease, cancer and other chronic diseases are included on the subsidised list under the PBS. Federally Funded Medicare Safety Net: Identifies a threshold over which basic medical costs incurred in any one year are further subsidised by the government. -------------------
- 34. Priority Population Groups If a specific population group is experiencing health disadvantages, it could be argued that their right to be healthy is being impinged. Epidemiology has informed us that some population groups do experience health inequalities and that these disadvantages need to be addressed. This identification helps authorities: - determine the disadvantages of certain groups - better understand social determinants - prevalence of disease and injury in specific groups - determine the needs of groups in relation to the SJP Examples include: - Royal Flying Doctors Service (RDFS), providing aeromedical emergency health services and clinics in remote sites - Incentive programs for medical practitioners and dentists to practice in rural or remote areas - Allocating more funding to Indigenous health services than non-Indigenous - Developing NSW Multicultural Health Communication Service (supporting culturally and linguistically diverse communities)
- 35. Prevalence of Condition Refers to how common the condition is within the community. We obtain this through epidemiological data. It relates primarily to high levels of preventable chronic disease, injury and mental health problems. High prevalence rates indicate the health and economic burden that the disease or condition places on the community. Looks to reduce the burden of disease (remember the table 5 slides ago?)
- 36. Potential for Prevention and Early Intervention The majority of disease and illnesses suffered by Australians result from poor lifestyle behaviours. Unfortunately simply changing people’s behaviours is easier said than done. Many people’s choices are a reflection on their environment. SES, access to info and health services, employment, housing, support networks and environmental infrastructure (water, roads, power grids etc..) are increasingly being viewed as determinants of health inequities. Individual and environmental determinants must both be met. Support in addressing the modifiable risk factors is important. E.g. Quitting smoking, breast screening etc...
- 37. Cost to the Individual and Community INDIVIDUAL: Refers to the economic and health burden placed onto an individual. Measured in terms of financial loss, loss of productivity, diminished quality of life and emotional stress. Financial and productivity costs = costs associated with treatment or impaired ability e.g. hospital charges, rehabilitation, medical fees, drugs therapies, travel costs and loss of income. Non-financial = pain and suffering experienced and the reduction in quality of life. E.g. not being able to participate in activities they once did and enjoyed, lifestyle changes for carers of injured or disabled. Emotional trauma is also a non- financial cost to an individual. COMMUNITY: These can be DIRECT or INDIRECT costs. DIRECT: Money spent on diagnosing, treating and caring for the sick, plus the money for prevention. E.g. Research, screenings, hospital admissions, pharmaceutical prescriptions and education. INDIRECT: The value of output lost when people become too ill to work or die prematurely. E.g. forgone earnings, absenteeism and the retaining of replacement workers.
- 38. Just to put it in perspective…..
- 39. Questions - HSC Past Questions
Editor's Notes
- 14 = b 10 = b