This document summarizes the performance of the North American Balanced Portfolio Composite versus a benchmark index from 2004 to 2016. It shows that the portfolio outperformed the index on a 3-year, 5-year and 10-year basis but underperformed on a 1-year and year-to-date basis. Specifically, the portfolio had 8.8% return over 3 years compared to 6.7% for the index.
Great Expectations: A Guide to Satisfying Clients through Accurate Valuation ...Armstrong Teasdale
Valuation is critical in a business acquisition. The acquisition agreement needs to support valuation assumptions and appropriately allocate risks between the parties with respect to these calculations. Professionals framing these agreements need to communicate or the risk allocation for key valuation assumptions may not comply with the parties’ expectations. This presentation will be a guide for fostering that collaboration.
For the first quarter of 2011, the markets brought some fancy footwork. In late January, the Middle East erupted in protest and violence, oil was surely going back to $200 a barrel, and consumer spending would subsequently slow.
For the first quarter of 2011, the markets brought some fancy footwork. In late January, the Middle East erupted in protest and violence, oil was surely going back to $200 a barrel, and consumer spending would subsequently slow.
Financial Ratios Chart
Financial Ratios Chart
Liquidity
2011
2012
2013
Industry average
Current ratio
2.4
Cash ratio
0.9
Asset Management
Inventory turnover in days
57
A/R turnover in days
14
A/P turnover in days
25
Cash conversion cycle
46
Fixed asset turnover ration
3.4
Total asset turnover ration
2.03
Long-Term Debt-Paying Ability
Long-term debt to total capitalization
21%
Effective interest rate
7.3%
Profitability
Gross profit margin
27%
Operating profit margin
5.8%
Net profit margin
2.6%
ROA
6.5%
ROE
17.1%
Financial Ratio Formulas
Liquidity
Formula
Current ratio
Current assets / current liabilities
Cash ratio
(Cash + marketable securities) / current liabilities
Asset Management
Inventory turnover ratio
Cost of goods sold / inventories (average)
Inventory turnover in days
365 / inventory turnover ratio
A/R turnover in days
365 / AR turnover
[AR turnover = net credit sales / average AR]
A/P turnover in days
365 / AP turnover
[AP turnover = cost of goods sold / Average AP]
Cash conversion cycle
Inventory turnover in days – AP turnover in days + AR turnover in days
Fixed asset turnover ratio
Net sales / average fixed (capital) assets
Total asset turnover ratio
Net sales / average total assets
Long-Term Debt Paying Ability
Long-Term debt to total capitalization
Long-term debt / (long-term debt + common/preferred shares)
Effective interest rate
Interest expense / total long-term debt
Profitability
Gross profit margin
Gross Profits / Net Sales
Operating profit margin
Operating income (EBIT) / Net Sales
Net profit margin
Net income / net sales
ROA (return on assets)
Net income / total assets
ROE (return on equity)
Net income / shareholders’ equity
[shareholders' equity = share capital + retained earnings]
1
JC PENNEY CO INC (JCP)
INCOME STATEMENTS
All amounts in USD millions.
Calendar Year 2011 2012 2013
Revenue $ 17,260 $ 12,985 $ 11,859
Cost of revenue (cost of goods sold) $ 11,042 $ 8,919 $ 8,367
Gross profit $ 6,218 $ 4,066 $ 3,492
Operating expenses No data No data No data
Sales, General and administrative $ 5,251 $ 4,535 $ 4,096
Other operating expenses $ 969 $ 841 $ 816
Total operating expenses $ 6,220 $ 5,376 $ 4,912
Operating income $ (2) $ (1,310) $ (1,420)
Interest Expense $ 227 $ 226 No data
Other income (expense) No data No data $ (466)
Income before income taxes $ (229) $ (1,536) $ 1,886)
Provision for income taxes $ (77) $ (551) $ (498)
Net income from continuing operations $ (152) $ (985) $ (1,388)
Net income from discontinuing ops No data No data No data
Net income $ (152) $ (985) $ (1,388)
Net income available to common shareholders $ (152) $ (985).
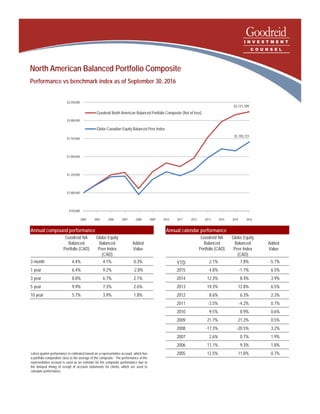
1. North American Balanced Portfolio Composite
Performance vs benchmark index as of September 30, 2016
Latest quarter performance is estimated based on a representative account, which has
a portfolio composition close to the average of the composite. The performance of the
representative account is used as an estimate for the composite performance due to
the delayed timing of receipt of account statements for clients, which are used to
calculate performance.
$2,121,109
$1,703,721
$750,000
$1,000,000
$1,250,000
$1,500,000
$1,750,000
$2,000,000
$2,250,000
2004 2005 2006 2007 2008 2009 2010 2011 2012 2013 2014 2015 2016
Goodreid North American Balanced Portfolio Composite (Net of fees)
Globe Canadian Equity Balanced Peer Index
Annual compound performance
Goodreid NA
Balanced
Portfolio (CAD)
Globe Equity
Balanced
Peer Index
(CAD)
Added
Value
3 month 4.4% 4.1% 0.3%
1 year 6.4% 9.2% -2.8%
3 year 8.8% 6.7% 2.1%
5 year 9.9% 7.3% 2.6%
10 year 5.7% 3.9% 1.8%
Annual calendar performance
Goodreid NA
Balanced
Portfolio (CAD)
Globe Equity
Balanced
Peer Index
(CAD)
Added
Value
YTD 2.1% 7.8% -5.7%
2015 4.8% -1.7% 6.5%
2014 12.3% 8.4% 3.9%
2013 19.3% 12.8% 6.5%
2012 8.6% 6.3% 2.3%
2011 -3.5% -4.2% 0.7%
2010 9.5% 8.9% 0.6%
2009 21.7% 21.2% 0.5%
2008 -17.3% -20.5% 3.2%
2007 2.6% 0.7% 1.9%
2006 11.1% 9.3% 1.8%
2005 12.5% 11.8% 0.7%