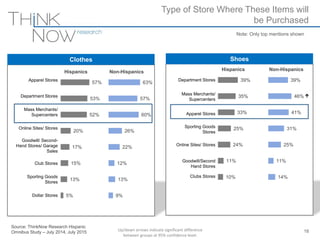
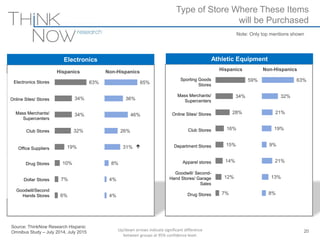
Download as PDF, PPTX
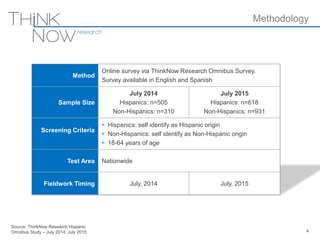
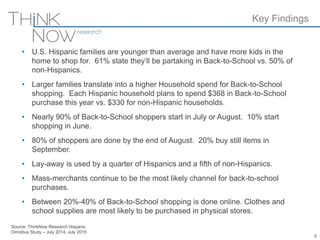
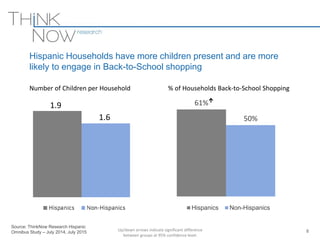
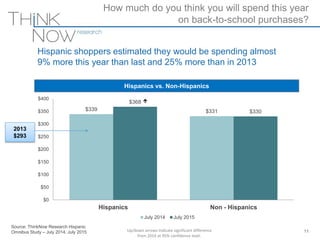
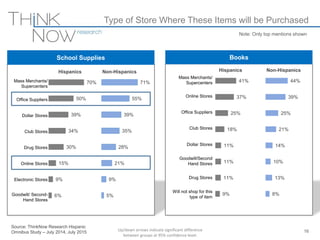
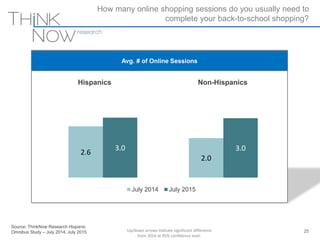

The document analyzes back-to-school shopping behaviors among U.S. Hispanic families, highlighting that 61% participate in this shopping compared to 50% of non-Hispanics. Hispanic households report a higher average spending of $368 compared to $330 by non-Hispanics, with a significant portion starting their shopping in July or August. Mass merchants are the primary retail channel, while both groups still prefer physical stores for purchasing, despite an increasing trend in online shopping.