Best online data science courses
•Download as PPT, PDF•
0 likes•16 views
Excelr offers the most omprehensive course in the singapore. We are established globally in countries like India, malaysia, US, Middleeast. We cover whole life cycle of data science
Report
Share
Report
Share

Recommended
Recommended
More Related Content
More from TejaspathiLV
More from TejaspathiLV (17)
Recently uploaded
Recently uploaded (20)
Food Chain and Food Web (Ecosystem) EVS, B. Pharmacy 1st Year, Sem-II
Food Chain and Food Web (Ecosystem) EVS, B. Pharmacy 1st Year, Sem-II
On National Teacher Day, meet the 2024-25 Kenan Fellows
On National Teacher Day, meet the 2024-25 Kenan Fellows
Web & Social Media Analytics Previous Year Question Paper.pdf
Web & Social Media Analytics Previous Year Question Paper.pdf
Micro-Scholarship, What it is, How can it help me.pdf
Micro-Scholarship, What it is, How can it help me.pdf
Measures of Dispersion and Variability: Range, QD, AD and SD
Measures of Dispersion and Variability: Range, QD, AD and SD
Asian American Pacific Islander Month DDSD 2024.pptx
Asian American Pacific Islander Month DDSD 2024.pptx
Role Of Transgenic Animal In Target Validation-1.pptx
Role Of Transgenic Animal In Target Validation-1.pptx
Unit-IV; Professional Sales Representative (PSR).pptx
Unit-IV; Professional Sales Representative (PSR).pptx
ICT role in 21st century education and it's challenges.
ICT role in 21st century education and it's challenges.
Basic Civil Engineering first year Notes- Chapter 4 Building.pptx
Basic Civil Engineering first year Notes- Chapter 4 Building.pptx
Best online data science courses
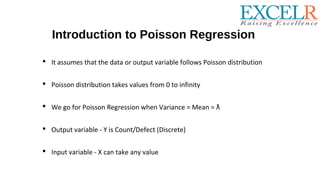
- 1. Introduction to Poisson Regression It assumes that the data or output variable follows Poisson distribution Poisson distribution takes values from 0 to infinity We go for Poisson Regression when Variance = Mean = ƛ Output variable - Y is Count/Defect (Discrete) Input variable - X can take any value
- 3. Examples of Poisson Regression Example 1. The number of persons killed by mule or horse kicks in the Prussian army per year. Ladislaus Bortkiewicz collected data from 20 volumes of Preussischen Statistik. These data were collected on 10 corps of the Prussian army in the late 1800s over the course of 20 years. Example 2. The number of people in line in front of you at the grocery store. Predictors may include the number of items currently offered at a special discounted price and whether a special event (e.g., a holiday, a big sporting event) is three or fewer days away. Example 3. The number of awards earned by students at one high school. Predictors of the number of awards earned include the type of program in which the student was enrolled (e.g., vocational, general or academic) and the score on their final exam in math.
- 4. Description of the data In this example, num_awards is the outcome variable and indicates the number of awards earned by students at a high school in a year, math is a continuous predictor variable and represents students’ scores on their math final exam, and prog is a categorical predictor variable with three levels indicating the type of program in which the students were enrolled. It is coded as 1 = “General”, 2 = “Academic” and 3 = “Vocational”.