SlideShare a Scribd company logo
1 of 7
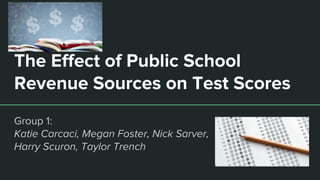
The Effect of Public School
Revenue Sources on Test Scores
Group 1:
Katie Carcaci, Megan Foster, Nick Sarver,
Harry Scuron, Taylor Trench
Scenario
- The issue at hand: average test scores for public schools vary across states
- Central question: How do different sources of revenue affect average test
scores of public schools in the United States?
- Why is this important?
- Education is often used as an indicator for the health of a country
- Government agencies are interested in ways to improve overall quality of education
- Federal, state, and local revenue sources could use this information to determine the
amount of revenue they want to dedicate to public schools
Data
- “U.S. Education Datasets: Unification Project” from Kaggle
- Combines financial and education data from the National Assessment of
Educational Progress (NAEP), the U.S. Census Bureau, and the National Center
for Education Statistics (NCES) for public schools
- Key elements for analysis:
- 2015 data
- State name
- Total revenue
- Federal revenue, state revenue, local revenue
- Reading and math scores (fourth grade marker)
Analysis and Results - Federal Revenue
- % of total revenue that comes
from federal sources was plotted
against average combined
testing scores (math and reading
in fourth grade) per state
- Slope of trendline = -1.07
- Model predicts that for each 1%
increase of the amount of total
revenue that comes from federal
sources, average combined
scores will decrease by 1.07
Analysis and Results - Local Revenue
- % of total revenue that comes
from local sources was plotted
against average combined
testing scores (math and reading
in fourth grade) per state
- Slope of trendline = 0.15
- Model predicts that for each 1%
increase of the amount of total
revenue that comes from local
sources, average combined
scores will increase by 0.15
Conclusions
- As the percentage of total revenue that comes from federal sources increases,
test scores decrease
- Evidence: negative slope of trendline (-1.07) pulled from scatterplot of test scores vs. % of
federal revenue
- As the percentage of total revenue that comes from local sources increases,
test scores also increase
- Evidence: positive slope of trendline (0.15) pulled from scatterplot of test scores vs. % of local
revenue
- What next?
- Public schools could focus more on generating revenue from local sources and less on
generating revenue from federal sources!
References
- “Data & Statistics.” ED.gov, https://www2.ed.gov/rschstat/landing.jhtml?src=ft.
- Garrard, Roy. “U.S. Education Datasets: Unification Project.” Kaggle, 2 Mar. 2019,
https://www.kaggle.com/noriuk/us-education-datasets-unification-project.
- “NAEP and State Assessments.” NAEP State,
https://nces.ed.gov/nationsreportcard/state/state_differences.aspx.

More Related Content

Similar to The Effect of Public School Revenue Sources on Test Scores

Instruments for measuring public satisfaction with the education
Instruments for measuring public satisfaction with the educationInstruments for measuring public satisfaction with the education
Instruments for measuring public satisfaction with the educationEmad Mohammed Sindi
 
1- The data in the following table present revenues and expenditures b.docx
1- The data in the following table present revenues and expenditures b.docx1- The data in the following table present revenues and expenditures b.docx
1- The data in the following table present revenues and expenditures b.docxtoddr5
 
201108 CA School Finance Center User Guide 200304 to 200809
201108 CA School Finance Center User Guide 200304 to 200809201108 CA School Finance Center User Guide 200304 to 200809
201108 CA School Finance Center User Guide 200304 to 200809Vicki Alger
 
Education funding-overview-open sky-policy-institute
Education funding-overview-open sky-policy-instituteEducation funding-overview-open sky-policy-institute
Education funding-overview-open sky-policy-instituteErin Rothman
 
Predictors of University Admissions Yield
Predictors of University Admissions YieldPredictors of University Admissions Yield
Predictors of University Admissions Yieldrisraelkloss
 
Nguyen c researchpowerpoint
Nguyen c researchpowerpointNguyen c researchpowerpoint
Nguyen c researchpowerpointcindylenguyen
 
Nguyen c researchpowerpoint
Nguyen c researchpowerpointNguyen c researchpowerpoint
Nguyen c researchpowerpointcindylenguyen
 
Nguyen c researchpowerpoint
Nguyen c researchpowerpointNguyen c researchpowerpoint
Nguyen c researchpowerpointcindylenguyen
 
Nguyen c researchpowerpoint
Nguyen c researchpowerpointNguyen c researchpowerpoint
Nguyen c researchpowerpointcindylenguyen
 
ELC Exxon Mobile Case Competition Winner Emory University
ELC Exxon Mobile Case Competition Winner Emory UniversityELC Exxon Mobile Case Competition Winner Emory University
ELC Exxon Mobile Case Competition Winner Emory UniversityIesha Scott
 
20100914 CA School Finance Center User Guide 200304 to 200708
20100914 CA School Finance Center User Guide 200304 to 20070820100914 CA School Finance Center User Guide 200304 to 200708
20100914 CA School Finance Center User Guide 200304 to 200708Vicki Alger
 
ANALYSIS OF TUITION GROWTH RATES BASED ON CLUSTERING AND REGRESSION MODELS
ANALYSIS OF TUITION GROWTH RATES BASED ON CLUSTERING AND REGRESSION MODELSANALYSIS OF TUITION GROWTH RATES BASED ON CLUSTERING AND REGRESSION MODELS
ANALYSIS OF TUITION GROWTH RATES BASED ON CLUSTERING AND REGRESSION MODELSIJDKP
 
ANALYSIS OF RISING TUITION RATES IN THE UNITED STATES BASED ON CLUSTERING ANA...
ANALYSIS OF RISING TUITION RATES IN THE UNITED STATES BASED ON CLUSTERING ANA...ANALYSIS OF RISING TUITION RATES IN THE UNITED STATES BASED ON CLUSTERING ANA...
ANALYSIS OF RISING TUITION RATES IN THE UNITED STATES BASED ON CLUSTERING ANA...cscpconf
 
Analysis of Rising Tutition Rates in The United States Based on Clustering An...
Analysis of Rising Tutition Rates in The United States Based on Clustering An...Analysis of Rising Tutition Rates in The United States Based on Clustering An...
Analysis of Rising Tutition Rates in The United States Based on Clustering An...csandit
 

Similar to The Effect of Public School Revenue Sources on Test Scores (20)

European Agency Statistics on Inclusive Education (EASIE) 2020 Presentation
European Agency Statistics on Inclusive Education (EASIE) 2020 PresentationEuropean Agency Statistics on Inclusive Education (EASIE) 2020 Presentation
European Agency Statistics on Inclusive Education (EASIE) 2020 Presentation
 
Educar en el s XXI. UIMP 2013. Central School Exit Exams
Educar en el s XXI. UIMP 2013. Central School Exit ExamsEducar en el s XXI. UIMP 2013. Central School Exit Exams
Educar en el s XXI. UIMP 2013. Central School Exit Exams
 
Instruments for measuring public satisfaction with the education
Instruments for measuring public satisfaction with the educationInstruments for measuring public satisfaction with the education
Instruments for measuring public satisfaction with the education
 
1- The data in the following table present revenues and expenditures b.docx
1- The data in the following table present revenues and expenditures b.docx1- The data in the following table present revenues and expenditures b.docx
1- The data in the following table present revenues and expenditures b.docx
 
201108 CA School Finance Center User Guide 200304 to 200809
201108 CA School Finance Center User Guide 200304 to 200809201108 CA School Finance Center User Guide 200304 to 200809
201108 CA School Finance Center User Guide 200304 to 200809
 
Education funding-overview-open sky-policy-institute
Education funding-overview-open sky-policy-instituteEducation funding-overview-open sky-policy-institute
Education funding-overview-open sky-policy-institute
 
Resource Allocation and the Superintendency
Resource Allocation and the SuperintendencyResource Allocation and the Superintendency
Resource Allocation and the Superintendency
 
Predictors of University Admissions Yield
Predictors of University Admissions YieldPredictors of University Admissions Yield
Predictors of University Admissions Yield
 
Nguyen c researchpowerpoint
Nguyen c researchpowerpointNguyen c researchpowerpoint
Nguyen c researchpowerpoint
 
Nguyen c researchpowerpoint
Nguyen c researchpowerpointNguyen c researchpowerpoint
Nguyen c researchpowerpoint
 
Nguyen c researchpowerpoint
Nguyen c researchpowerpointNguyen c researchpowerpoint
Nguyen c researchpowerpoint
 
Nguyen c researchpowerpoint
Nguyen c researchpowerpointNguyen c researchpowerpoint
Nguyen c researchpowerpoint
 
Superintendent Academy_January 2019
Superintendent Academy_January 2019Superintendent Academy_January 2019
Superintendent Academy_January 2019
 
Superintendent Academy_January 2019 v2
Superintendent Academy_January 2019 v2Superintendent Academy_January 2019 v2
Superintendent Academy_January 2019 v2
 
1663_HSFB
1663_HSFB1663_HSFB
1663_HSFB
 
ELC Exxon Mobile Case Competition Winner Emory University
ELC Exxon Mobile Case Competition Winner Emory UniversityELC Exxon Mobile Case Competition Winner Emory University
ELC Exxon Mobile Case Competition Winner Emory University
 
20100914 CA School Finance Center User Guide 200304 to 200708
20100914 CA School Finance Center User Guide 200304 to 20070820100914 CA School Finance Center User Guide 200304 to 200708
20100914 CA School Finance Center User Guide 200304 to 200708
 
ANALYSIS OF TUITION GROWTH RATES BASED ON CLUSTERING AND REGRESSION MODELS
ANALYSIS OF TUITION GROWTH RATES BASED ON CLUSTERING AND REGRESSION MODELSANALYSIS OF TUITION GROWTH RATES BASED ON CLUSTERING AND REGRESSION MODELS
ANALYSIS OF TUITION GROWTH RATES BASED ON CLUSTERING AND REGRESSION MODELS
 
ANALYSIS OF RISING TUITION RATES IN THE UNITED STATES BASED ON CLUSTERING ANA...
ANALYSIS OF RISING TUITION RATES IN THE UNITED STATES BASED ON CLUSTERING ANA...ANALYSIS OF RISING TUITION RATES IN THE UNITED STATES BASED ON CLUSTERING ANA...
ANALYSIS OF RISING TUITION RATES IN THE UNITED STATES BASED ON CLUSTERING ANA...
 
Analysis of Rising Tutition Rates in The United States Based on Clustering An...
Analysis of Rising Tutition Rates in The United States Based on Clustering An...Analysis of Rising Tutition Rates in The United States Based on Clustering An...
Analysis of Rising Tutition Rates in The United States Based on Clustering An...
 

Recently uploaded

basics of data science with application areas.pdf
basics of data science with application areas.pdfbasics of data science with application areas.pdf
basics of data science with application areas.pdfvyankatesh1
 
Toko Jual Viagra Asli Di Salatiga 081229400522 Obat Kuat Viagra
Toko Jual Viagra Asli Di Salatiga 081229400522 Obat Kuat ViagraToko Jual Viagra Asli Di Salatiga 081229400522 Obat Kuat Viagra
Toko Jual Viagra Asli Di Salatiga 081229400522 Obat Kuat Viagraadet6151
 
一比一原版加利福尼亚大学尔湾分校毕业证成绩单如何办理
一比一原版加利福尼亚大学尔湾分校毕业证成绩单如何办理一比一原版加利福尼亚大学尔湾分校毕业证成绩单如何办理
一比一原版加利福尼亚大学尔湾分校毕业证成绩单如何办理pyhepag
 
2024 Q1 Tableau User Group Leader Quarterly Call
2024 Q1 Tableau User Group Leader Quarterly Call2024 Q1 Tableau User Group Leader Quarterly Call
2024 Q1 Tableau User Group Leader Quarterly Calllward7
 
Aggregations - The Elasticsearch "GROUP BY"
Aggregations - The Elasticsearch "GROUP BY"Aggregations - The Elasticsearch "GROUP BY"
Aggregations - The Elasticsearch "GROUP BY"John Sobanski
 
如何办理哥伦比亚大学毕业证(Columbia毕业证)成绩单原版一比一
如何办理哥伦比亚大学毕业证(Columbia毕业证)成绩单原版一比一如何办理哥伦比亚大学毕业证(Columbia毕业证)成绩单原版一比一
如何办理哥伦比亚大学毕业证(Columbia毕业证)成绩单原版一比一fztigerwe
 
如何办理新加坡国立大学毕业证(NUS毕业证)学位证成绩单原版一比一
如何办理新加坡国立大学毕业证(NUS毕业证)学位证成绩单原版一比一如何办理新加坡国立大学毕业证(NUS毕业证)学位证成绩单原版一比一
如何办理新加坡国立大学毕业证(NUS毕业证)学位证成绩单原版一比一hwhqz6r1y
 
ℂall Girls Balbir Nagar ℂall Now Chhaya ☎ 9899900591 WhatsApp Number 24/7
ℂall Girls Balbir Nagar ℂall Now Chhaya ☎ 9899900591 WhatsApp  Number 24/7ℂall Girls Balbir Nagar ℂall Now Chhaya ☎ 9899900591 WhatsApp  Number 24/7
ℂall Girls Balbir Nagar ℂall Now Chhaya ☎ 9899900591 WhatsApp Number 24/7gragkhusi
 
Generative AI for Trailblazers_ Unlock the Future of AI.pdf
Generative AI for Trailblazers_ Unlock the Future of AI.pdfGenerative AI for Trailblazers_ Unlock the Future of AI.pdf
Generative AI for Trailblazers_ Unlock the Future of AI.pdfEmmanuel Dauda
 
AI Imagen for data-storytelling Infographics.pdf
AI Imagen for data-storytelling Infographics.pdfAI Imagen for data-storytelling Infographics.pdf
AI Imagen for data-storytelling Infographics.pdfMichaelSenkow
 
How I opened a fake bank account and didn't go to prison
How I opened a fake bank account and didn't go to prisonHow I opened a fake bank account and didn't go to prison
How I opened a fake bank account and didn't go to prisonPayment Village
 
NO1 Best Kala Jadu Expert Specialist In Germany Kala Jadu Expert Specialist I...
NO1 Best Kala Jadu Expert Specialist In Germany Kala Jadu Expert Specialist I...NO1 Best Kala Jadu Expert Specialist In Germany Kala Jadu Expert Specialist I...
NO1 Best Kala Jadu Expert Specialist In Germany Kala Jadu Expert Specialist I...Amil baba
 
Data Analytics for Digital Marketing Lecture for Advanced Digital & Social Me...
Data Analytics for Digital Marketing Lecture for Advanced Digital & Social Me...Data Analytics for Digital Marketing Lecture for Advanced Digital & Social Me...
Data Analytics for Digital Marketing Lecture for Advanced Digital & Social Me...Valters Lauzums
 
edited gordis ebook sixth edition david d.pdf
edited gordis ebook sixth edition david d.pdfedited gordis ebook sixth edition david d.pdf
edited gordis ebook sixth edition david d.pdfgreat91
 
Formulas dax para power bI de microsoft.pdf
Formulas dax para power bI de microsoft.pdfFormulas dax para power bI de microsoft.pdf
Formulas dax para power bI de microsoft.pdfRobertoOcampo24
 
一比一原版麦考瑞大学毕业证成绩单如何办理
一比一原版麦考瑞大学毕业证成绩单如何办理一比一原版麦考瑞大学毕业证成绩单如何办理
一比一原版麦考瑞大学毕业证成绩单如何办理cyebo
 
Toko Jual Viagra Asli Di Malang 081229400522 COD Obat Kuat Viagra Malang
Toko Jual Viagra Asli Di Malang 081229400522 COD Obat Kuat Viagra MalangToko Jual Viagra Asli Di Malang 081229400522 COD Obat Kuat Viagra Malang
Toko Jual Viagra Asli Di Malang 081229400522 COD Obat Kuat Viagra Malangadet6151
 
How to Transform Clinical Trial Management with Advanced Data Analytics
How to Transform Clinical Trial Management with Advanced Data AnalyticsHow to Transform Clinical Trial Management with Advanced Data Analytics
How to Transform Clinical Trial Management with Advanced Data AnalyticsBrainSell Technologies
 
Fuzzy Sets decision making under information of uncertainty
Fuzzy Sets decision making under information of uncertaintyFuzzy Sets decision making under information of uncertainty
Fuzzy Sets decision making under information of uncertaintyRafigAliyev2
 
Data Visualization Exploring and Explaining with Data 1st Edition by Camm sol...
Data Visualization Exploring and Explaining with Data 1st Edition by Camm sol...Data Visualization Exploring and Explaining with Data 1st Edition by Camm sol...
Data Visualization Exploring and Explaining with Data 1st Edition by Camm sol...ssuserf63bd7
 

Recently uploaded (20)

basics of data science with application areas.pdf
basics of data science with application areas.pdfbasics of data science with application areas.pdf
basics of data science with application areas.pdf
 
Toko Jual Viagra Asli Di Salatiga 081229400522 Obat Kuat Viagra
Toko Jual Viagra Asli Di Salatiga 081229400522 Obat Kuat ViagraToko Jual Viagra Asli Di Salatiga 081229400522 Obat Kuat Viagra
Toko Jual Viagra Asli Di Salatiga 081229400522 Obat Kuat Viagra
 
一比一原版加利福尼亚大学尔湾分校毕业证成绩单如何办理
一比一原版加利福尼亚大学尔湾分校毕业证成绩单如何办理一比一原版加利福尼亚大学尔湾分校毕业证成绩单如何办理
一比一原版加利福尼亚大学尔湾分校毕业证成绩单如何办理
 
2024 Q1 Tableau User Group Leader Quarterly Call
2024 Q1 Tableau User Group Leader Quarterly Call2024 Q1 Tableau User Group Leader Quarterly Call
2024 Q1 Tableau User Group Leader Quarterly Call
 
Aggregations - The Elasticsearch "GROUP BY"
Aggregations - The Elasticsearch "GROUP BY"Aggregations - The Elasticsearch "GROUP BY"
Aggregations - The Elasticsearch "GROUP BY"
 
如何办理哥伦比亚大学毕业证(Columbia毕业证)成绩单原版一比一
如何办理哥伦比亚大学毕业证(Columbia毕业证)成绩单原版一比一如何办理哥伦比亚大学毕业证(Columbia毕业证)成绩单原版一比一
如何办理哥伦比亚大学毕业证(Columbia毕业证)成绩单原版一比一
 
如何办理新加坡国立大学毕业证(NUS毕业证)学位证成绩单原版一比一
如何办理新加坡国立大学毕业证(NUS毕业证)学位证成绩单原版一比一如何办理新加坡国立大学毕业证(NUS毕业证)学位证成绩单原版一比一
如何办理新加坡国立大学毕业证(NUS毕业证)学位证成绩单原版一比一
 
ℂall Girls Balbir Nagar ℂall Now Chhaya ☎ 9899900591 WhatsApp Number 24/7
ℂall Girls Balbir Nagar ℂall Now Chhaya ☎ 9899900591 WhatsApp  Number 24/7ℂall Girls Balbir Nagar ℂall Now Chhaya ☎ 9899900591 WhatsApp  Number 24/7
ℂall Girls Balbir Nagar ℂall Now Chhaya ☎ 9899900591 WhatsApp Number 24/7
 
Generative AI for Trailblazers_ Unlock the Future of AI.pdf
Generative AI for Trailblazers_ Unlock the Future of AI.pdfGenerative AI for Trailblazers_ Unlock the Future of AI.pdf
Generative AI for Trailblazers_ Unlock the Future of AI.pdf
 
AI Imagen for data-storytelling Infographics.pdf
AI Imagen for data-storytelling Infographics.pdfAI Imagen for data-storytelling Infographics.pdf
AI Imagen for data-storytelling Infographics.pdf
 
How I opened a fake bank account and didn't go to prison
How I opened a fake bank account and didn't go to prisonHow I opened a fake bank account and didn't go to prison
How I opened a fake bank account and didn't go to prison
 
NO1 Best Kala Jadu Expert Specialist In Germany Kala Jadu Expert Specialist I...
NO1 Best Kala Jadu Expert Specialist In Germany Kala Jadu Expert Specialist I...NO1 Best Kala Jadu Expert Specialist In Germany Kala Jadu Expert Specialist I...
NO1 Best Kala Jadu Expert Specialist In Germany Kala Jadu Expert Specialist I...
 
Data Analytics for Digital Marketing Lecture for Advanced Digital & Social Me...
Data Analytics for Digital Marketing Lecture for Advanced Digital & Social Me...Data Analytics for Digital Marketing Lecture for Advanced Digital & Social Me...
Data Analytics for Digital Marketing Lecture for Advanced Digital & Social Me...
 
edited gordis ebook sixth edition david d.pdf
edited gordis ebook sixth edition david d.pdfedited gordis ebook sixth edition david d.pdf
edited gordis ebook sixth edition david d.pdf
 
Formulas dax para power bI de microsoft.pdf
Formulas dax para power bI de microsoft.pdfFormulas dax para power bI de microsoft.pdf
Formulas dax para power bI de microsoft.pdf
 
一比一原版麦考瑞大学毕业证成绩单如何办理
一比一原版麦考瑞大学毕业证成绩单如何办理一比一原版麦考瑞大学毕业证成绩单如何办理
一比一原版麦考瑞大学毕业证成绩单如何办理
 
Toko Jual Viagra Asli Di Malang 081229400522 COD Obat Kuat Viagra Malang
Toko Jual Viagra Asli Di Malang 081229400522 COD Obat Kuat Viagra MalangToko Jual Viagra Asli Di Malang 081229400522 COD Obat Kuat Viagra Malang
Toko Jual Viagra Asli Di Malang 081229400522 COD Obat Kuat Viagra Malang
 
How to Transform Clinical Trial Management with Advanced Data Analytics
How to Transform Clinical Trial Management with Advanced Data AnalyticsHow to Transform Clinical Trial Management with Advanced Data Analytics
How to Transform Clinical Trial Management with Advanced Data Analytics
 
Fuzzy Sets decision making under information of uncertainty
Fuzzy Sets decision making under information of uncertaintyFuzzy Sets decision making under information of uncertainty
Fuzzy Sets decision making under information of uncertainty
 
Data Visualization Exploring and Explaining with Data 1st Edition by Camm sol...
Data Visualization Exploring and Explaining with Data 1st Edition by Camm sol...Data Visualization Exploring and Explaining with Data 1st Edition by Camm sol...
Data Visualization Exploring and Explaining with Data 1st Edition by Camm sol...
 

The Effect of Public School Revenue Sources on Test Scores

  • 1. The Effect of Public School Revenue Sources on Test Scores Group 1: Katie Carcaci, Megan Foster, Nick Sarver, Harry Scuron, Taylor Trench
  • 2. Scenario - The issue at hand: average test scores for public schools vary across states - Central question: How do different sources of revenue affect average test scores of public schools in the United States? - Why is this important? - Education is often used as an indicator for the health of a country - Government agencies are interested in ways to improve overall quality of education - Federal, state, and local revenue sources could use this information to determine the amount of revenue they want to dedicate to public schools
  • 3. Data - “U.S. Education Datasets: Unification Project” from Kaggle - Combines financial and education data from the National Assessment of Educational Progress (NAEP), the U.S. Census Bureau, and the National Center for Education Statistics (NCES) for public schools - Key elements for analysis: - 2015 data - State name - Total revenue - Federal revenue, state revenue, local revenue - Reading and math scores (fourth grade marker)
  • 4. Analysis and Results - Federal Revenue - % of total revenue that comes from federal sources was plotted against average combined testing scores (math and reading in fourth grade) per state - Slope of trendline = -1.07 - Model predicts that for each 1% increase of the amount of total revenue that comes from federal sources, average combined scores will decrease by 1.07
  • 5. Analysis and Results - Local Revenue - % of total revenue that comes from local sources was plotted against average combined testing scores (math and reading in fourth grade) per state - Slope of trendline = 0.15 - Model predicts that for each 1% increase of the amount of total revenue that comes from local sources, average combined scores will increase by 0.15
  • 6. Conclusions - As the percentage of total revenue that comes from federal sources increases, test scores decrease - Evidence: negative slope of trendline (-1.07) pulled from scatterplot of test scores vs. % of federal revenue - As the percentage of total revenue that comes from local sources increases, test scores also increase - Evidence: positive slope of trendline (0.15) pulled from scatterplot of test scores vs. % of local revenue - What next? - Public schools could focus more on generating revenue from local sources and less on generating revenue from federal sources!
  • 7. References - “Data & Statistics.” ED.gov, https://www2.ed.gov/rschstat/landing.jhtml?src=ft. - Garrard, Roy. “U.S. Education Datasets: Unification Project.” Kaggle, 2 Mar. 2019, https://www.kaggle.com/noriuk/us-education-datasets-unification-project. - “NAEP and State Assessments.” NAEP State, https://nces.ed.gov/nationsreportcard/state/state_differences.aspx.

Editor's Notes

  1. Slide 3 will describe the data. What are the key elements and how did you get it?
  2. Slides 4 and 5 will describe the analysis and the results. Make good use of data visualizations.
  3. Slides 4 and 5 will describe the analysis and the results. Make good use of data visualizations.
  4. Slide 6 will describe your conclusions. What did you learn? Support your conclusions using the results of the analysis, citing specific evidence!