SlideShare a Scribd company logo
1 of 7
A GIS for Flood Risk Management in
Flanders
ENV sci 5th (section B)
Taskeen Rubab (2025117079)
1
A GIS for Flood Risk Management in Flanders
Remote Sensing and Geographic Information System
Abstract
In the past decades, Flanders, a region of north Belgium that extends from the coastline inland (in
northwest Europe), has suffered several serious riverine floods that caused substantial property damage.
As Flanders is one of the most densely populated regions in the world, a solid water management policy is
needed in order to mitigate the effects of this type of calamity. In the past, Flemish water managers chose to
drain off river water as quickly as possible by heightening the dikes along the rivers. However, this method
leads to a higher flood probability further downstream. Moreover, water defence infrastructure can always
suffer from technical failures (e.g., breaching) creating even more damage than would have occurred if no
defences were in place. In a search for a better solution to this recurring problem, the Flemish
administration proposed a new approach in the 1990s. This approach focuses on minimizing the
consequences of flooding instead of attempting to prevent floods. To implement this approach, large
amounts of data were gathered for the Flemish Region. Using a Geographic Information System (GIS), a
risk-based methodology was created to quantitatively assess flood risk based on hydrologic models, land
use information and socio-economic data. Recently, this methodology was implemented in a specifically
designed GIS-based flood risk assessment tool called LATIS. By estimating the potential damage and
number of casualties during a flood event, LATIS offers the possibility to perform risk analysis quickly and
effectively. This chapter presents a concise overview of LATISโ€™ methodology and its implementation for
flood risk management in Flanders.
Introduction
Flanders is located in the center of northwest Europe, in the low-lying northern part of Belgium, bordering
the North Sea (Fig. 4.1). The region is characterized by a number of river valleys with moderate slopes and
minor elevation differences. During heavy torrents or long-lasting rainy weather, parts of Flanders are
regularly flooded due to overflow (and in rare occasions by breaching) of river dikes. As Flanders is one of
the most densely populated and industrialized regions in the world, adequate flood risk management is
necessary. In the past, the solution of the Flemish administration to the flood problem was to drain the
water downstream as quickly as possible by heightening the dikes along the river banks. However,
experience showed that this was far from an ideal solution. It has become clear that this method leads to
higher water levels and a higher flood risk downstream. Moreover, water defense infrastructure can
collapse due to technical failure such as breaching, often creating more damage than would have occurred
if no flood defense infrastructure had existed. In agricultural areas, the impacts of floods are limited due to
low population density, fewer buildings, and reduced amounts of infrastructure. In other areas (e.g., nature
conservation zones), flooding can even have positive effects. The opposite is true in densely populated
areas or in areas with important industrial activities. In these areas, extra effort and investment must be
made to try to reduce the effects of flooding, such as delineating controlled inundation areas to provide
short term storage for large volumes of water. In order to estimate and compare the benefits from each of
different types of measures, a uniform risk analysis approach is necessary. In this context, several
objectives were set by policy makers in the governmental note described earlier.
1. The development of a methodology for the uniform calculation of damage and risk for the whole of
Flanders;
2. Use of this methodology to calculate change in flood risk and damage due to change in local
infrastructure works and/or land use; and,
3. A definition of data and software necessary for running the equations in a geographic information
technology (GIT) environment.
To meet these goals, Flanders Hydraulics Research,1 in cooperation with the Department of Geography at
Ghent University, developed a risk-based methodology to assess potential flood damage.
Overview of the Risk-Based
Several steps are required to calculate damage and risk. The first step requires the generation of a set of
flood maps, each representing the extent of a flood with a certain return period, using hydrological,
hydraulic, and digital elevation models. Second, different land use maps are combined with a variety of
socio-economic data resulting in a maximum damage map. This maximum damage map is subsequently
combined with the different flood maps to create damage maps for each return period. In the final phase,
these damage maps are combined into a single risk map.
Organizations involved
Flanders Hydraulics Research is part of the Department of Mobility and Public Works of the Flemish
Government and is responsible for the navigable waterways in Flanders (2005). Both land use maps are
included for two reasons: (i) the combination provides additional land use information unavailable when
using only one data source, and (ii) each data set has a different renewal period, so the most recent land
use map can be used when required. Insurance companies possess information on the monetary value of
individual households, but are generally unwilling to disclose such private information. For croplands,
another problem arises.
Flood Map Calculations
Before calculating damage and risk, it is necessary to estimate an areaโ€™s flooding probability through
statistical analysis of past water levels and flow rates. First, the return period, or average period of time in
which a particular maximum water level and discharge may occur, is calculated. Higher water levels and
discharge volumes correspond to longer return periods of occurrence. Calculating probability of
occurrence is performed using composite hydrographs, which are synthetic hydrographs integrated from
Quantity/Duration/Frequency (QDF)-relationships. These QDF-relationships statistically link every river
discharge with its duration and return period. Composite hydrographs have the advantage that in every
point along the waterway (and in the flood zones) the calculated water levels have the same return period.
Only one calculation is required for every return period, resulting in more rapid risk calculation models.
Framework for risk mapping (to be read counterclockwise, starting at upper left)
Damage Calculations
3
In this step, land use information and socio-economic data are used to produce a maximum damage map.
This maximum damage map contains the potential damage value per surface area, where maximal damage
can occur from a hazardous event. Put differently, this map indicates the cost value for a virtual scenario in
which everything is destroyed by a (flood) event. By combining the maximum damage map with the flood
maps, expected damage for a given inundation can be calculated.
1. Different Types of Damage
2. Maximum Damage Map
3. Calculating Damage Maps
4. Calculating Damage Maps
Risk Calculation
In the final step, the different damage maps for each return period are combined into one risk map. As
stated above, risk is defined as the probability of a certain event multiplied by the damage caused by that
event. The risk (expressed as the mean annual damage per surface unit per year) is then equal to the
damage caused by an event with a 1-year return period, plus half of the damage difference between a 2-year
flood and a 1-year flood, plus one-third of the damage difference between a 3-year flood and a 2-year flood,
and so forth. The mathematical explanation of this procedure is explained in Equations 4.2 and 4.3:
Implementation of the Methodology in a GIS
Early GIS-Model
The development of the risk-based methodology described above is insufficient, of itself, to perform risk analysis.
The method needs to be translated into a useful model that executes all necessary steps in a pre-programmed chain
of actions. Starting with land use maps and flood maps, all steps to create risk maps are separated into sub models
based on a raster GIS approach. To determine whether to use raster or vector GIS, a preliminary study was
performed (Vanneuville et al. 2003). While the tests did not produce large differences in precision nor accuracy,
calculation times in raster GIS occur much more quickly than in vector GIS; 90% of the over 400 computations were
more optimally performed in a raster-based GIS (Burrough and McDonnel 1998). One disadvantage of raster-based
GIS is that the required storage capacities are much higher than for vector data; however, this is regarded as a
minor issue.
Development of a Flood Risk Assessment Tool: LATIS
In 2007, Flanders Hydraulics Research, in cooperation with the Department of Geography at Ghent
University developed a GIS tool named LATIS as a substitute for the model structure described above. One
of the main prerequisites for the development of the tool was a user-friendly and easily accessible Graphical
User Interface (GUI). Therefore, the GUI of LATIS (the โ€œClient Applicationโ€ in Fig. 4.6) is built in the C#.NET
programming language. The interface of LATIS is a simple windows application, hiding the complexity of
professional GIS software. The algorithms of the methodology are also implemented in C#.NET, but for the
execution of the geospatial operations, LATIS still uses the optimal computing capacity and built-in
standard modules (which perform the geospatial operations) of IDRISI. The .NET technology enables the
use and execution (in the background) of those IDRISI modules (Fig. 4.6, where the single-headed arrows
represent the relationships between the client applications and the IDRISI modules), which are stand-alone
executable files. The tool performs all necessary actions with the corresponding parameters in the
background of the application so the user only has to input data that affect the risk calculations (i.e., the
flood and land use maps and the socio-economic data).4 LATIS was also designed to address data
management by developing a system that allows administrators to easily manage basic land use maps and
socio-economic data. These maps and data are uniformly gathered for the extent of Flanders and are
centrally managed on a data server. The manipulation of these base data is possible via the LATIS
application of an administrator (shown in Fig. 4.6 by the arrows in the direction of the data server). When a
user runs a damage and risk assessment, the application selects and extracts the necessary data (the
standard is to select the most recent data) for the extent of a certain flooding scenario from the data server
(shown in Fig. 4.6 by the arrows in the direction of the applications). Consequently, the application performs
the preprocessing of land use and socio-economic data and the user only has to input the flood maps. The
data management system also records what data is used in an assessment so a specific risk calculation
can easily be repeated. Development of LATIS now allows damage and risk maps in Flanders to be
calculated in an efficient, uniform, and reproducible manner.
LATIS in Action: Impact of Climate Change on Risk
The calculation of climate change scenarios in Flanders is one of the first projects for which the LATIS tool
has been used. These climate change scenarios are based on regional climate models for different levels of
CO2 emissions. Based on potential change in rainfall and evaporation rates, a high, mean and low scenario
was defined for the summer and winter period in Flanders. In general, the potential for drought is expected
to increase during the summer, while changes that may occur during the winter are highly uncertain
(represented by a strong increase in flooding in the high scenario to a slight decrease in flooding in the low
scenario). The runs of the hydraulic model were executed based on the climate change scenarios and the
available measurement series for water level, discharge and evaporation in order to derive catchment flood
maps with different return periods. Both flood extent and water depth were used as the main factors
influencing damage. Flood maps were used to recalculate damage and risk maps with the most recent
socio-economic data available. These maps were used as references and compared with the flood risk
maps produced under the climate change scenarios. For all four scenarios (current, low, mean and high),
the flood risk is based on the same series of return periods as are used for flood map calculations (1, 50,
100 and 500 years). A relatively small increase or decrease in water level can cause large differences in
damage and risk. Vulnerable sites that are flooded once a century (on average) can be flooded more
frequently, causing the risk to increase significantly. On the other hand, a large increase in water depth on
agricultural land does not lead to a large increase in damage and risk because once crops are rotten, water
depth is no longer important. Economic damages are generally calculated for such features as housing,
industry, and agricultural land. However, special attention is given to local features that are: (1) sensitive to
extreme high damage values (e.g., power supply installations, museums), (2) important in case of an
emergency (e.g., fire brigades, police stations) and (3) problematic due to evacuation reasons (e.g.,
hospitals, retirement homes). Interpretation of the results of the damage and risk maps from the climate
change scenarios is done (as for all flood risk assessments) in a relative manner
5
Conclusions and Further Developments
LATIS, a GIS application for assessing flood risk in Flanders, Belgium has been described, including an overview of
the underlying risk methodology, which incorporates hydrologic and hydraulic models, land use information and
socio-economic data. Presently, LATIS is being used as part of social cost-benefit analyses for estimating the
effects of flood mitigation measures. These analyses are being performed in support of several riverine and coastal
management plans, including studies on the widening and deepening of waterways, the construction of controlled
flood zones, and proposed improvements in the coastal defense infrastructure. These plans not Currently, LATIS is
limited to only four types of damage: monetary, internal, and direct/indirect. Future improvements to the
methodology could include adding external and non-monetary damage to the model. The model could be further
improved with the use of more detailed base data. The main reason the current methodology uses aggregated data
is pragmatic: data gathering is a time-consuming and costly job and processing time becomes longer with more
detailed data. Therefore, the decision was made to work with generalized spatial data and to proceed gradually to
more detailed data when more time and resources become available. This future work is important because
estimating the number of people who could be afflicted directly impacts evacuation needs. Fortunately, although
Flandersโ€™ flood plains are densely populated, it boasts a dense road network that is expected to support substantial
evacuation numbers in the event of a calamity.
Flood risk hotspots of Pakistan
References
Ahola, T., Virrantaus, K., Krisp, J. M., Hunter, G. J. (2007). A spatio-temporal population model to support risk assessment and
damage analysis for decision-making. International Journal of Geographical Information Science, 21(8), 935โ€“953.
Allsop, N.W.H. (2005). D38: Report on Hazard Analysis. Report CLASH WP6, Coordinator HR Wallingford, 28p.
Breyer, F., Felder, S. (2005). Mortality Risk and the Value of a Statistical Life: The Dead-Anyway Effect Revis(it)ed. Geneva Risk
and Insurance Review, 30(1), 41โ€“55.
Burrough, P.A., McDonnel R.A. (1998). Principles of Geographical Information Systems, Oxford University Press, Oxford, p. 333.
Card W.I., Mooney G.H. (1977). What is the monetary value of a human life? British Medical Journal, 2, 1627โ€“1629.
A GIS for Flood Risk Management in Flander.docx

More Related Content

Similar to A GIS for Flood Risk Management in Flander.docx

Forecasting and communication key elements for low-cost fluvial flooding earl...
Forecasting and communication key elements for low-cost fluvial flooding earl...Forecasting and communication key elements for low-cost fluvial flooding earl...
Forecasting and communication key elements for low-cost fluvial flooding earl...IJECEIAES
ย 
IRJET - A Case Study On Flood Risk Management
IRJET - A Case Study On Flood Risk ManagementIRJET - A Case Study On Flood Risk Management
IRJET - A Case Study On Flood Risk ManagementIRJET Journal
ย 
Santillan assessing the-impacts_of_flooding_caused_by_extreme_rainfall_events...
Santillan assessing the-impacts_of_flooding_caused_by_extreme_rainfall_events...Santillan assessing the-impacts_of_flooding_caused_by_extreme_rainfall_events...
Santillan assessing the-impacts_of_flooding_caused_by_extreme_rainfall_events...Vanrosco
ย 
Using GIS for effective flood management
Using GIS for effective flood managementUsing GIS for effective flood management
Using GIS for effective flood managementJames Thompson
ย 
DSD-SEA 2019 Seasonal drought forecasting using state-of-the-art hydro softwa...
DSD-SEA 2019 Seasonal drought forecasting using state-of-the-art hydro softwa...DSD-SEA 2019 Seasonal drought forecasting using state-of-the-art hydro softwa...
DSD-SEA 2019 Seasonal drought forecasting using state-of-the-art hydro softwa...Deltares
ย 
A Model of (P-GIS) for Hydraulic Protection Dams in Northern Morocco
A Model of (P-GIS) for Hydraulic Protection Dams in Northern MoroccoA Model of (P-GIS) for Hydraulic Protection Dams in Northern Morocco
A Model of (P-GIS) for Hydraulic Protection Dams in Northern Moroccoijait
ย 
A MODEL OF (P-GIS) FOR HYDRAULIC PROTECTION DAMS IN NORTHERN MOROCCO
A MODEL OF (P-GIS) FOR HYDRAULIC PROTECTION DAMS IN NORTHERN MOROCCOA MODEL OF (P-GIS) FOR HYDRAULIC PROTECTION DAMS IN NORTHERN MOROCCO
A MODEL OF (P-GIS) FOR HYDRAULIC PROTECTION DAMS IN NORTHERN MOROCCOijait
ย 
IRJET - A Case Study on Flood Risk Management
IRJET - A Case Study on Flood Risk ManagementIRJET - A Case Study on Flood Risk Management
IRJET - A Case Study on Flood Risk ManagementIRJET Journal
ย 
Presentation of Academic Writting .pdf
Presentation of Academic Writting .pdfPresentation of Academic Writting .pdf
Presentation of Academic Writting .pdfAbdulmuqtadetrAhmadi
ย 
Session 6: Scene-setting-Mainstreaming resilience in projects - Sophie Lavaud...
Session 6: Scene-setting-Mainstreaming resilience in projects - Sophie Lavaud...Session 6: Scene-setting-Mainstreaming resilience in projects - Sophie Lavaud...
Session 6: Scene-setting-Mainstreaming resilience in projects - Sophie Lavaud...OECD Environment
ย 
Vietnam disaster risk prevention aid system for urban flooding
Vietnam disaster risk prevention aid system for urban floodingVietnam disaster risk prevention aid system for urban flooding
Vietnam disaster risk prevention aid system for urban floodingByoungjaeBJLee
ย 
Lecture by Prof. Salvatore Manfreda
Lecture by Prof. Salvatore ManfredaLecture by Prof. Salvatore Manfreda
Lecture by Prof. Salvatore ManfredaSalvatore Manfreda
ย 
Natural Hazards & ROLE of satellite remote sensing
Natural Hazards & ROLE of satellite remote sensingNatural Hazards & ROLE of satellite remote sensing
Natural Hazards & ROLE of satellite remote sensingABU UMEER BANBHAN
ย 
Disaster risk management in cambodia
Disaster risk management in cambodiaDisaster risk management in cambodia
Disaster risk management in cambodiaThร nh Nguyแป…n
ย 
Modified Flash Flood Potential Index
Modified Flash Flood Potential IndexModified Flash Flood Potential Index
Modified Flash Flood Potential IndexGabriel Lazar
ย 
Application Of Deep Learning On UAV-Based Aerial Images For Flood Detection
Application Of Deep Learning On UAV-Based Aerial Images For Flood DetectionApplication Of Deep Learning On UAV-Based Aerial Images For Flood Detection
Application Of Deep Learning On UAV-Based Aerial Images For Flood DetectionTodd Turner
ย 

Similar to A GIS for Flood Risk Management in Flander.docx (20)

Forecasting and communication key elements for low-cost fluvial flooding earl...
Forecasting and communication key elements for low-cost fluvial flooding earl...Forecasting and communication key elements for low-cost fluvial flooding earl...
Forecasting and communication key elements for low-cost fluvial flooding earl...
ย 
IRJET - A Case Study On Flood Risk Management
IRJET - A Case Study On Flood Risk ManagementIRJET - A Case Study On Flood Risk Management
IRJET - A Case Study On Flood Risk Management
ย 
AlfredoConetta_EGM712_GIS_Project
AlfredoConetta_EGM712_GIS_ProjectAlfredoConetta_EGM712_GIS_Project
AlfredoConetta_EGM712_GIS_Project
ย 
Santillan assessing the-impacts_of_flooding_caused_by_extreme_rainfall_events...
Santillan assessing the-impacts_of_flooding_caused_by_extreme_rainfall_events...Santillan assessing the-impacts_of_flooding_caused_by_extreme_rainfall_events...
Santillan assessing the-impacts_of_flooding_caused_by_extreme_rainfall_events...
ย 
Using GIS for effective flood management
Using GIS for effective flood managementUsing GIS for effective flood management
Using GIS for effective flood management
ย 
Risks reading1
Risks reading1Risks reading1
Risks reading1
ย 
Risks reading1
Risks reading1Risks reading1
Risks reading1
ย 
DSD-SEA 2019 Seasonal drought forecasting using state-of-the-art hydro softwa...
DSD-SEA 2019 Seasonal drought forecasting using state-of-the-art hydro softwa...DSD-SEA 2019 Seasonal drought forecasting using state-of-the-art hydro softwa...
DSD-SEA 2019 Seasonal drought forecasting using state-of-the-art hydro softwa...
ย 
A Model of (P-GIS) for Hydraulic Protection Dams in Northern Morocco
A Model of (P-GIS) for Hydraulic Protection Dams in Northern MoroccoA Model of (P-GIS) for Hydraulic Protection Dams in Northern Morocco
A Model of (P-GIS) for Hydraulic Protection Dams in Northern Morocco
ย 
A MODEL OF (P-GIS) FOR HYDRAULIC PROTECTION DAMS IN NORTHERN MOROCCO
A MODEL OF (P-GIS) FOR HYDRAULIC PROTECTION DAMS IN NORTHERN MOROCCOA MODEL OF (P-GIS) FOR HYDRAULIC PROTECTION DAMS IN NORTHERN MOROCCO
A MODEL OF (P-GIS) FOR HYDRAULIC PROTECTION DAMS IN NORTHERN MOROCCO
ย 
IRJET - A Case Study on Flood Risk Management
IRJET - A Case Study on Flood Risk ManagementIRJET - A Case Study on Flood Risk Management
IRJET - A Case Study on Flood Risk Management
ย 
Presentation of Academic Writting .pdf
Presentation of Academic Writting .pdfPresentation of Academic Writting .pdf
Presentation of Academic Writting .pdf
ย 
Session 6: Scene-setting-Mainstreaming resilience in projects - Sophie Lavaud...
Session 6: Scene-setting-Mainstreaming resilience in projects - Sophie Lavaud...Session 6: Scene-setting-Mainstreaming resilience in projects - Sophie Lavaud...
Session 6: Scene-setting-Mainstreaming resilience in projects - Sophie Lavaud...
ย 
Vietnam disaster risk prevention aid system for urban flooding
Vietnam disaster risk prevention aid system for urban floodingVietnam disaster risk prevention aid system for urban flooding
Vietnam disaster risk prevention aid system for urban flooding
ย 
MODELLING THE IMPACT OF FLOODING USING GEOGRAPHIC INFORMATION SYSTEM AND REMO...
MODELLING THE IMPACT OF FLOODING USING GEOGRAPHIC INFORMATION SYSTEM AND REMO...MODELLING THE IMPACT OF FLOODING USING GEOGRAPHIC INFORMATION SYSTEM AND REMO...
MODELLING THE IMPACT OF FLOODING USING GEOGRAPHIC INFORMATION SYSTEM AND REMO...
ย 
Lecture by Prof. Salvatore Manfreda
Lecture by Prof. Salvatore ManfredaLecture by Prof. Salvatore Manfreda
Lecture by Prof. Salvatore Manfreda
ย 
Natural Hazards & ROLE of satellite remote sensing
Natural Hazards & ROLE of satellite remote sensingNatural Hazards & ROLE of satellite remote sensing
Natural Hazards & ROLE of satellite remote sensing
ย 
Disaster risk management in cambodia
Disaster risk management in cambodiaDisaster risk management in cambodia
Disaster risk management in cambodia
ย 
Modified Flash Flood Potential Index
Modified Flash Flood Potential IndexModified Flash Flood Potential Index
Modified Flash Flood Potential Index
ย 
Application Of Deep Learning On UAV-Based Aerial Images For Flood Detection
Application Of Deep Learning On UAV-Based Aerial Images For Flood DetectionApplication Of Deep Learning On UAV-Based Aerial Images For Flood Detection
Application Of Deep Learning On UAV-Based Aerial Images For Flood Detection
ย 

More from home

ENVIRONMENTAL HAZARDS
ENVIRONMENTAL HAZARDSENVIRONMENTAL HAZARDS
ENVIRONMENTAL HAZARDShome
ย 
Community-based Conservation
Community-based Conservation Community-based Conservation
Community-based Conservation home
ย 
environmental management system
environmental management systemenvironmental management system
environmental management systemhome
ย 
OHS for environmental hazards in tannery
OHS for environmental hazards in tanneryOHS for environmental hazards in tannery
OHS for environmental hazards in tanneryhome
ย 
Nuclear energy boon or ban
Nuclear energy boon or banNuclear energy boon or ban
Nuclear energy boon or banhome
ย 
ocean role in climate change
ocean role in climate changeocean role in climate change
ocean role in climate changehome
ย 
host parasite relationship of bacteria.docx
host parasite relationship of bacteria.docxhost parasite relationship of bacteria.docx
host parasite relationship of bacteria.docxhome
ย 
money plant poster
money plant postermoney plant poster
money plant posterhome
ย 
Nutrition Assessment.docx
Nutrition Assessment.docxNutrition Assessment.docx
Nutrition Assessment.docxhome
ย 
Echolocation
EcholocationEcholocation
Echolocationhome
ย 
biosensor and its utilization in environment
biosensor and its utilization in environmentbiosensor and its utilization in environment
biosensor and its utilization in environmenthome
ย 
The pianist (2002).pptx
The pianist (2002).pptxThe pianist (2002).pptx
The pianist (2002).pptxhome
ย 
Biosensors and bioelectronics.docx
Biosensors and bioelectronics.docxBiosensors and bioelectronics.docx
Biosensors and bioelectronics.docxhome
ย 
climate change
climate changeclimate change
climate changehome
ย 
Treatments for soil contamination.docx
Treatments for soil contamination.docxTreatments for soil contamination.docx
Treatments for soil contamination.docxhome
ย 
EFFECT OF OCEAN ON CLIMATE CHANGE
EFFECT OF OCEAN ON CLIMATE CHANGE EFFECT OF OCEAN ON CLIMATE CHANGE
EFFECT OF OCEAN ON CLIMATE CHANGE home
ย 
sexual harassment at work place
sexual harassment at work placesexual harassment at work place
sexual harassment at work placehome
ย 
Radioactive pollution taskeen rubab 28145
Radioactive pollution taskeen rubab 28145Radioactive pollution taskeen rubab 28145
Radioactive pollution taskeen rubab 28145home
ย 
Chemistry of detergent taskeen rubab
Chemistry of detergent taskeen rubabChemistry of detergent taskeen rubab
Chemistry of detergent taskeen rubabhome
ย 
Weathering es taskeen ruubab 28145 1 (1)
Weathering es taskeen ruubab 28145 1 (1)Weathering es taskeen ruubab 28145 1 (1)
Weathering es taskeen ruubab 28145 1 (1)home
ย 

More from home (20)

ENVIRONMENTAL HAZARDS
ENVIRONMENTAL HAZARDSENVIRONMENTAL HAZARDS
ENVIRONMENTAL HAZARDS
ย 
Community-based Conservation
Community-based Conservation Community-based Conservation
Community-based Conservation
ย 
environmental management system
environmental management systemenvironmental management system
environmental management system
ย 
OHS for environmental hazards in tannery
OHS for environmental hazards in tanneryOHS for environmental hazards in tannery
OHS for environmental hazards in tannery
ย 
Nuclear energy boon or ban
Nuclear energy boon or banNuclear energy boon or ban
Nuclear energy boon or ban
ย 
ocean role in climate change
ocean role in climate changeocean role in climate change
ocean role in climate change
ย 
host parasite relationship of bacteria.docx
host parasite relationship of bacteria.docxhost parasite relationship of bacteria.docx
host parasite relationship of bacteria.docx
ย 
money plant poster
money plant postermoney plant poster
money plant poster
ย 
Nutrition Assessment.docx
Nutrition Assessment.docxNutrition Assessment.docx
Nutrition Assessment.docx
ย 
Echolocation
EcholocationEcholocation
Echolocation
ย 
biosensor and its utilization in environment
biosensor and its utilization in environmentbiosensor and its utilization in environment
biosensor and its utilization in environment
ย 
The pianist (2002).pptx
The pianist (2002).pptxThe pianist (2002).pptx
The pianist (2002).pptx
ย 
Biosensors and bioelectronics.docx
Biosensors and bioelectronics.docxBiosensors and bioelectronics.docx
Biosensors and bioelectronics.docx
ย 
climate change
climate changeclimate change
climate change
ย 
Treatments for soil contamination.docx
Treatments for soil contamination.docxTreatments for soil contamination.docx
Treatments for soil contamination.docx
ย 
EFFECT OF OCEAN ON CLIMATE CHANGE
EFFECT OF OCEAN ON CLIMATE CHANGE EFFECT OF OCEAN ON CLIMATE CHANGE
EFFECT OF OCEAN ON CLIMATE CHANGE
ย 
sexual harassment at work place
sexual harassment at work placesexual harassment at work place
sexual harassment at work place
ย 
Radioactive pollution taskeen rubab 28145
Radioactive pollution taskeen rubab 28145Radioactive pollution taskeen rubab 28145
Radioactive pollution taskeen rubab 28145
ย 
Chemistry of detergent taskeen rubab
Chemistry of detergent taskeen rubabChemistry of detergent taskeen rubab
Chemistry of detergent taskeen rubab
ย 
Weathering es taskeen ruubab 28145 1 (1)
Weathering es taskeen ruubab 28145 1 (1)Weathering es taskeen ruubab 28145 1 (1)
Weathering es taskeen ruubab 28145 1 (1)
ย 

Recently uploaded

CSR_Tested activities in the classroom -EN
CSR_Tested activities in the classroom -ENCSR_Tested activities in the classroom -EN
CSR_Tested activities in the classroom -ENGeorgeDiamandis11
ย 
Call Girls Ramtek Call Me 7737669865 Budget Friendly No Advance Booking
Call Girls Ramtek Call Me 7737669865 Budget Friendly No Advance BookingCall Girls Ramtek Call Me 7737669865 Budget Friendly No Advance Booking
Call Girls Ramtek Call Me 7737669865 Budget Friendly No Advance Bookingroncy bisnoi
ย 
Russian Call Girls Nashik Anjali 7001305949 Independent Escort Service Nashik
Russian Call Girls Nashik Anjali 7001305949 Independent Escort Service NashikRussian Call Girls Nashik Anjali 7001305949 Independent Escort Service Nashik
Russian Call Girls Nashik Anjali 7001305949 Independent Escort Service Nashikranjana rawat
ย 
(PARI) Viman Nagar Call Girls Just Call 7001035870 [ Cash on Delivery ] Pune ...
(PARI) Viman Nagar Call Girls Just Call 7001035870 [ Cash on Delivery ] Pune ...(PARI) Viman Nagar Call Girls Just Call 7001035870 [ Cash on Delivery ] Pune ...
(PARI) Viman Nagar Call Girls Just Call 7001035870 [ Cash on Delivery ] Pune ...ranjana rawat
ย 
(ANIKA) Call Girls Wagholi ( 7001035870 ) HI-Fi Pune Escorts Service
(ANIKA) Call Girls Wagholi ( 7001035870 ) HI-Fi Pune Escorts Service(ANIKA) Call Girls Wagholi ( 7001035870 ) HI-Fi Pune Escorts Service
(ANIKA) Call Girls Wagholi ( 7001035870 ) HI-Fi Pune Escorts Serviceranjana rawat
ย 
Call Girls Budhwar Peth Call Me 7737669865 Budget Friendly No Advance Booking
Call Girls Budhwar Peth Call Me 7737669865 Budget Friendly No Advance BookingCall Girls Budhwar Peth Call Me 7737669865 Budget Friendly No Advance Booking
Call Girls Budhwar Peth Call Me 7737669865 Budget Friendly No Advance Bookingroncy bisnoi
ย 
Hot Call Girls |Delhi |Preet Vihar โ˜Ž 9711199171 Book Your One night Stand
Hot Call Girls |Delhi |Preet Vihar โ˜Ž 9711199171 Book Your One night StandHot Call Girls |Delhi |Preet Vihar โ˜Ž 9711199171 Book Your One night Stand
Hot Call Girls |Delhi |Preet Vihar โ˜Ž 9711199171 Book Your One night Standkumarajju5765
ย 
Sustainable Packaging
Sustainable PackagingSustainable Packaging
Sustainable PackagingDr. Salem Baidas
ย 
BOOK Call Girls in (Dwarka) CALL | 8377087607 Delhi Escorts Services
BOOK Call Girls in (Dwarka) CALL | 8377087607 Delhi Escorts ServicesBOOK Call Girls in (Dwarka) CALL | 8377087607 Delhi Escorts Services
BOOK Call Girls in (Dwarka) CALL | 8377087607 Delhi Escorts Servicesdollysharma2066
ย 
(NANDITA) Hadapsar Call Girls Just Call 7001035870 [ Cash on Delivery ] Pune ...
(NANDITA) Hadapsar Call Girls Just Call 7001035870 [ Cash on Delivery ] Pune ...(NANDITA) Hadapsar Call Girls Just Call 7001035870 [ Cash on Delivery ] Pune ...
(NANDITA) Hadapsar Call Girls Just Call 7001035870 [ Cash on Delivery ] Pune ...ranjana rawat
ย 
E Waste Management
E Waste ManagementE Waste Management
E Waste ManagementDr. Salem Baidas
ย 
Verified Trusted Kalyani Nagar Call Girls 8005736733 ๐ˆ๐๐ƒ๐„๐๐„๐๐ƒ๐„๐๐“ Call ๐†๐ˆ๐‘๐‹ ๐•...
Verified Trusted Kalyani Nagar Call Girls  8005736733 ๐ˆ๐๐ƒ๐„๐๐„๐๐ƒ๐„๐๐“ Call ๐†๐ˆ๐‘๐‹ ๐•...Verified Trusted Kalyani Nagar Call Girls  8005736733 ๐ˆ๐๐ƒ๐„๐๐„๐๐ƒ๐„๐๐“ Call ๐†๐ˆ๐‘๐‹ ๐•...
Verified Trusted Kalyani Nagar Call Girls 8005736733 ๐ˆ๐๐ƒ๐„๐๐„๐๐ƒ๐„๐๐“ Call ๐†๐ˆ๐‘๐‹ ๐•...tanu pandey
ย 
Call Girls Magarpatta Call Me 7737669865 Budget Friendly No Advance Booking
Call Girls Magarpatta Call Me 7737669865 Budget Friendly No Advance BookingCall Girls Magarpatta Call Me 7737669865 Budget Friendly No Advance Booking
Call Girls Magarpatta Call Me 7737669865 Budget Friendly No Advance Bookingroncy bisnoi
ย 
Mumbai Call Girls, ๐Ÿ’ž Prity 9892124323, Navi Mumbai Call girls
Mumbai Call Girls, ๐Ÿ’ž  Prity 9892124323, Navi Mumbai Call girlsMumbai Call Girls, ๐Ÿ’ž  Prity 9892124323, Navi Mumbai Call girls
Mumbai Call Girls, ๐Ÿ’ž Prity 9892124323, Navi Mumbai Call girlsPooja Nehwal
ย 
VIP Call Girls Service Bandlaguda Hyderabad Call +91-8250192130
VIP Call Girls Service Bandlaguda Hyderabad Call +91-8250192130VIP Call Girls Service Bandlaguda Hyderabad Call +91-8250192130
VIP Call Girls Service Bandlaguda Hyderabad Call +91-8250192130Suhani Kapoor
ย 
NO1 Verified kala jadu karne wale ka contact number kala jadu karne wale baba...
NO1 Verified kala jadu karne wale ka contact number kala jadu karne wale baba...NO1 Verified kala jadu karne wale ka contact number kala jadu karne wale baba...
NO1 Verified kala jadu karne wale ka contact number kala jadu karne wale baba...Amil baba
ย 
VVIP Pune Call Girls Koregaon Park (7001035870) Pune Escorts Nearby with Comp...
VVIP Pune Call Girls Koregaon Park (7001035870) Pune Escorts Nearby with Comp...VVIP Pune Call Girls Koregaon Park (7001035870) Pune Escorts Nearby with Comp...
VVIP Pune Call Girls Koregaon Park (7001035870) Pune Escorts Nearby with Comp...Call Girls in Nagpur High Profile
ย 
The Most Attractive Pune Call Girls Shirwal 8250192130 Will You Miss This Cha...
The Most Attractive Pune Call Girls Shirwal 8250192130 Will You Miss This Cha...The Most Attractive Pune Call Girls Shirwal 8250192130 Will You Miss This Cha...
The Most Attractive Pune Call Girls Shirwal 8250192130 Will You Miss This Cha...ranjana rawat
ย 

Recently uploaded (20)

CSR_Tested activities in the classroom -EN
CSR_Tested activities in the classroom -ENCSR_Tested activities in the classroom -EN
CSR_Tested activities in the classroom -EN
ย 
Call Girls Ramtek Call Me 7737669865 Budget Friendly No Advance Booking
Call Girls Ramtek Call Me 7737669865 Budget Friendly No Advance BookingCall Girls Ramtek Call Me 7737669865 Budget Friendly No Advance Booking
Call Girls Ramtek Call Me 7737669865 Budget Friendly No Advance Booking
ย 
Russian Call Girls Nashik Anjali 7001305949 Independent Escort Service Nashik
Russian Call Girls Nashik Anjali 7001305949 Independent Escort Service NashikRussian Call Girls Nashik Anjali 7001305949 Independent Escort Service Nashik
Russian Call Girls Nashik Anjali 7001305949 Independent Escort Service Nashik
ย 
(PARI) Viman Nagar Call Girls Just Call 7001035870 [ Cash on Delivery ] Pune ...
(PARI) Viman Nagar Call Girls Just Call 7001035870 [ Cash on Delivery ] Pune ...(PARI) Viman Nagar Call Girls Just Call 7001035870 [ Cash on Delivery ] Pune ...
(PARI) Viman Nagar Call Girls Just Call 7001035870 [ Cash on Delivery ] Pune ...
ย 
(ANIKA) Call Girls Wagholi ( 7001035870 ) HI-Fi Pune Escorts Service
(ANIKA) Call Girls Wagholi ( 7001035870 ) HI-Fi Pune Escorts Service(ANIKA) Call Girls Wagholi ( 7001035870 ) HI-Fi Pune Escorts Service
(ANIKA) Call Girls Wagholi ( 7001035870 ) HI-Fi Pune Escorts Service
ย 
Call Girls Budhwar Peth Call Me 7737669865 Budget Friendly No Advance Booking
Call Girls Budhwar Peth Call Me 7737669865 Budget Friendly No Advance BookingCall Girls Budhwar Peth Call Me 7737669865 Budget Friendly No Advance Booking
Call Girls Budhwar Peth Call Me 7737669865 Budget Friendly No Advance Booking
ย 
9953056974 ,Low Rate Call Girls In Adarsh Nagar Delhi 24hrs Available
9953056974 ,Low Rate Call Girls In Adarsh Nagar  Delhi 24hrs Available9953056974 ,Low Rate Call Girls In Adarsh Nagar  Delhi 24hrs Available
9953056974 ,Low Rate Call Girls In Adarsh Nagar Delhi 24hrs Available
ย 
Hot Call Girls |Delhi |Preet Vihar โ˜Ž 9711199171 Book Your One night Stand
Hot Call Girls |Delhi |Preet Vihar โ˜Ž 9711199171 Book Your One night StandHot Call Girls |Delhi |Preet Vihar โ˜Ž 9711199171 Book Your One night Stand
Hot Call Girls |Delhi |Preet Vihar โ˜Ž 9711199171 Book Your One night Stand
ย 
Sustainable Packaging
Sustainable PackagingSustainable Packaging
Sustainable Packaging
ย 
BOOK Call Girls in (Dwarka) CALL | 8377087607 Delhi Escorts Services
BOOK Call Girls in (Dwarka) CALL | 8377087607 Delhi Escorts ServicesBOOK Call Girls in (Dwarka) CALL | 8377087607 Delhi Escorts Services
BOOK Call Girls in (Dwarka) CALL | 8377087607 Delhi Escorts Services
ย 
(NANDITA) Hadapsar Call Girls Just Call 7001035870 [ Cash on Delivery ] Pune ...
(NANDITA) Hadapsar Call Girls Just Call 7001035870 [ Cash on Delivery ] Pune ...(NANDITA) Hadapsar Call Girls Just Call 7001035870 [ Cash on Delivery ] Pune ...
(NANDITA) Hadapsar Call Girls Just Call 7001035870 [ Cash on Delivery ] Pune ...
ย 
E Waste Management
E Waste ManagementE Waste Management
E Waste Management
ย 
Verified Trusted Kalyani Nagar Call Girls 8005736733 ๐ˆ๐๐ƒ๐„๐๐„๐๐ƒ๐„๐๐“ Call ๐†๐ˆ๐‘๐‹ ๐•...
Verified Trusted Kalyani Nagar Call Girls  8005736733 ๐ˆ๐๐ƒ๐„๐๐„๐๐ƒ๐„๐๐“ Call ๐†๐ˆ๐‘๐‹ ๐•...Verified Trusted Kalyani Nagar Call Girls  8005736733 ๐ˆ๐๐ƒ๐„๐๐„๐๐ƒ๐„๐๐“ Call ๐†๐ˆ๐‘๐‹ ๐•...
Verified Trusted Kalyani Nagar Call Girls 8005736733 ๐ˆ๐๐ƒ๐„๐๐„๐๐ƒ๐„๐๐“ Call ๐†๐ˆ๐‘๐‹ ๐•...
ย 
Call Girls Magarpatta Call Me 7737669865 Budget Friendly No Advance Booking
Call Girls Magarpatta Call Me 7737669865 Budget Friendly No Advance BookingCall Girls Magarpatta Call Me 7737669865 Budget Friendly No Advance Booking
Call Girls Magarpatta Call Me 7737669865 Budget Friendly No Advance Booking
ย 
Mumbai Call Girls, ๐Ÿ’ž Prity 9892124323, Navi Mumbai Call girls
Mumbai Call Girls, ๐Ÿ’ž  Prity 9892124323, Navi Mumbai Call girlsMumbai Call Girls, ๐Ÿ’ž  Prity 9892124323, Navi Mumbai Call girls
Mumbai Call Girls, ๐Ÿ’ž Prity 9892124323, Navi Mumbai Call girls
ย 
VIP Call Girls Service Bandlaguda Hyderabad Call +91-8250192130
VIP Call Girls Service Bandlaguda Hyderabad Call +91-8250192130VIP Call Girls Service Bandlaguda Hyderabad Call +91-8250192130
VIP Call Girls Service Bandlaguda Hyderabad Call +91-8250192130
ย 
NO1 Verified kala jadu karne wale ka contact number kala jadu karne wale baba...
NO1 Verified kala jadu karne wale ka contact number kala jadu karne wale baba...NO1 Verified kala jadu karne wale ka contact number kala jadu karne wale baba...
NO1 Verified kala jadu karne wale ka contact number kala jadu karne wale baba...
ย 
VVIP Pune Call Girls Koregaon Park (7001035870) Pune Escorts Nearby with Comp...
VVIP Pune Call Girls Koregaon Park (7001035870) Pune Escorts Nearby with Comp...VVIP Pune Call Girls Koregaon Park (7001035870) Pune Escorts Nearby with Comp...
VVIP Pune Call Girls Koregaon Park (7001035870) Pune Escorts Nearby with Comp...
ย 
Green Banking
Green Banking Green Banking
Green Banking
ย 
The Most Attractive Pune Call Girls Shirwal 8250192130 Will You Miss This Cha...
The Most Attractive Pune Call Girls Shirwal 8250192130 Will You Miss This Cha...The Most Attractive Pune Call Girls Shirwal 8250192130 Will You Miss This Cha...
The Most Attractive Pune Call Girls Shirwal 8250192130 Will You Miss This Cha...
ย 

A GIS for Flood Risk Management in Flander.docx

  • 1. A GIS for Flood Risk Management in Flanders ENV sci 5th (section B) Taskeen Rubab (2025117079)
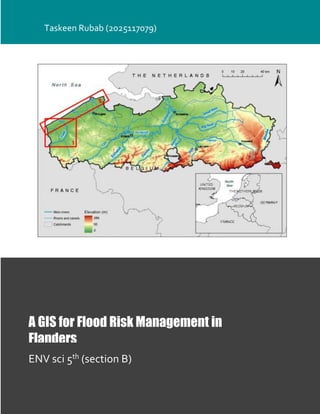
  • 2. 1 A GIS for Flood Risk Management in Flanders Remote Sensing and Geographic Information System Abstract In the past decades, Flanders, a region of north Belgium that extends from the coastline inland (in northwest Europe), has suffered several serious riverine floods that caused substantial property damage. As Flanders is one of the most densely populated regions in the world, a solid water management policy is needed in order to mitigate the effects of this type of calamity. In the past, Flemish water managers chose to drain off river water as quickly as possible by heightening the dikes along the rivers. However, this method leads to a higher flood probability further downstream. Moreover, water defence infrastructure can always suffer from technical failures (e.g., breaching) creating even more damage than would have occurred if no defences were in place. In a search for a better solution to this recurring problem, the Flemish administration proposed a new approach in the 1990s. This approach focuses on minimizing the consequences of flooding instead of attempting to prevent floods. To implement this approach, large amounts of data were gathered for the Flemish Region. Using a Geographic Information System (GIS), a risk-based methodology was created to quantitatively assess flood risk based on hydrologic models, land use information and socio-economic data. Recently, this methodology was implemented in a specifically designed GIS-based flood risk assessment tool called LATIS. By estimating the potential damage and number of casualties during a flood event, LATIS offers the possibility to perform risk analysis quickly and effectively. This chapter presents a concise overview of LATISโ€™ methodology and its implementation for flood risk management in Flanders. Introduction Flanders is located in the center of northwest Europe, in the low-lying northern part of Belgium, bordering the North Sea (Fig. 4.1). The region is characterized by a number of river valleys with moderate slopes and minor elevation differences. During heavy torrents or long-lasting rainy weather, parts of Flanders are regularly flooded due to overflow (and in rare occasions by breaching) of river dikes. As Flanders is one of the most densely populated and industrialized regions in the world, adequate flood risk management is necessary. In the past, the solution of the Flemish administration to the flood problem was to drain the water downstream as quickly as possible by heightening the dikes along the river banks. However, experience showed that this was far from an ideal solution. It has become clear that this method leads to higher water levels and a higher flood risk downstream. Moreover, water defense infrastructure can collapse due to technical failure such as breaching, often creating more damage than would have occurred if no flood defense infrastructure had existed. In agricultural areas, the impacts of floods are limited due to low population density, fewer buildings, and reduced amounts of infrastructure. In other areas (e.g., nature conservation zones), flooding can even have positive effects. The opposite is true in densely populated areas or in areas with important industrial activities. In these areas, extra effort and investment must be made to try to reduce the effects of flooding, such as delineating controlled inundation areas to provide short term storage for large volumes of water. In order to estimate and compare the benefits from each of different types of measures, a uniform risk analysis approach is necessary. In this context, several objectives were set by policy makers in the governmental note described earlier.
  • 3. 1. The development of a methodology for the uniform calculation of damage and risk for the whole of Flanders; 2. Use of this methodology to calculate change in flood risk and damage due to change in local infrastructure works and/or land use; and, 3. A definition of data and software necessary for running the equations in a geographic information technology (GIT) environment. To meet these goals, Flanders Hydraulics Research,1 in cooperation with the Department of Geography at Ghent University, developed a risk-based methodology to assess potential flood damage. Overview of the Risk-Based Several steps are required to calculate damage and risk. The first step requires the generation of a set of flood maps, each representing the extent of a flood with a certain return period, using hydrological, hydraulic, and digital elevation models. Second, different land use maps are combined with a variety of socio-economic data resulting in a maximum damage map. This maximum damage map is subsequently combined with the different flood maps to create damage maps for each return period. In the final phase, these damage maps are combined into a single risk map. Organizations involved Flanders Hydraulics Research is part of the Department of Mobility and Public Works of the Flemish Government and is responsible for the navigable waterways in Flanders (2005). Both land use maps are included for two reasons: (i) the combination provides additional land use information unavailable when using only one data source, and (ii) each data set has a different renewal period, so the most recent land use map can be used when required. Insurance companies possess information on the monetary value of individual households, but are generally unwilling to disclose such private information. For croplands, another problem arises. Flood Map Calculations Before calculating damage and risk, it is necessary to estimate an areaโ€™s flooding probability through statistical analysis of past water levels and flow rates. First, the return period, or average period of time in which a particular maximum water level and discharge may occur, is calculated. Higher water levels and discharge volumes correspond to longer return periods of occurrence. Calculating probability of occurrence is performed using composite hydrographs, which are synthetic hydrographs integrated from Quantity/Duration/Frequency (QDF)-relationships. These QDF-relationships statistically link every river discharge with its duration and return period. Composite hydrographs have the advantage that in every point along the waterway (and in the flood zones) the calculated water levels have the same return period. Only one calculation is required for every return period, resulting in more rapid risk calculation models. Framework for risk mapping (to be read counterclockwise, starting at upper left) Damage Calculations
  • 4. 3 In this step, land use information and socio-economic data are used to produce a maximum damage map. This maximum damage map contains the potential damage value per surface area, where maximal damage can occur from a hazardous event. Put differently, this map indicates the cost value for a virtual scenario in which everything is destroyed by a (flood) event. By combining the maximum damage map with the flood maps, expected damage for a given inundation can be calculated. 1. Different Types of Damage 2. Maximum Damage Map 3. Calculating Damage Maps 4. Calculating Damage Maps Risk Calculation In the final step, the different damage maps for each return period are combined into one risk map. As stated above, risk is defined as the probability of a certain event multiplied by the damage caused by that event. The risk (expressed as the mean annual damage per surface unit per year) is then equal to the damage caused by an event with a 1-year return period, plus half of the damage difference between a 2-year flood and a 1-year flood, plus one-third of the damage difference between a 3-year flood and a 2-year flood, and so forth. The mathematical explanation of this procedure is explained in Equations 4.2 and 4.3: Implementation of the Methodology in a GIS Early GIS-Model The development of the risk-based methodology described above is insufficient, of itself, to perform risk analysis. The method needs to be translated into a useful model that executes all necessary steps in a pre-programmed chain of actions. Starting with land use maps and flood maps, all steps to create risk maps are separated into sub models based on a raster GIS approach. To determine whether to use raster or vector GIS, a preliminary study was performed (Vanneuville et al. 2003). While the tests did not produce large differences in precision nor accuracy, calculation times in raster GIS occur much more quickly than in vector GIS; 90% of the over 400 computations were more optimally performed in a raster-based GIS (Burrough and McDonnel 1998). One disadvantage of raster-based GIS is that the required storage capacities are much higher than for vector data; however, this is regarded as a minor issue. Development of a Flood Risk Assessment Tool: LATIS In 2007, Flanders Hydraulics Research, in cooperation with the Department of Geography at Ghent University developed a GIS tool named LATIS as a substitute for the model structure described above. One of the main prerequisites for the development of the tool was a user-friendly and easily accessible Graphical User Interface (GUI). Therefore, the GUI of LATIS (the โ€œClient Applicationโ€ in Fig. 4.6) is built in the C#.NET programming language. The interface of LATIS is a simple windows application, hiding the complexity of professional GIS software. The algorithms of the methodology are also implemented in C#.NET, but for the execution of the geospatial operations, LATIS still uses the optimal computing capacity and built-in standard modules (which perform the geospatial operations) of IDRISI. The .NET technology enables the use and execution (in the background) of those IDRISI modules (Fig. 4.6, where the single-headed arrows represent the relationships between the client applications and the IDRISI modules), which are stand-alone executable files. The tool performs all necessary actions with the corresponding parameters in the background of the application so the user only has to input data that affect the risk calculations (i.e., the
  • 5. flood and land use maps and the socio-economic data).4 LATIS was also designed to address data management by developing a system that allows administrators to easily manage basic land use maps and socio-economic data. These maps and data are uniformly gathered for the extent of Flanders and are centrally managed on a data server. The manipulation of these base data is possible via the LATIS application of an administrator (shown in Fig. 4.6 by the arrows in the direction of the data server). When a user runs a damage and risk assessment, the application selects and extracts the necessary data (the standard is to select the most recent data) for the extent of a certain flooding scenario from the data server (shown in Fig. 4.6 by the arrows in the direction of the applications). Consequently, the application performs the preprocessing of land use and socio-economic data and the user only has to input the flood maps. The data management system also records what data is used in an assessment so a specific risk calculation can easily be repeated. Development of LATIS now allows damage and risk maps in Flanders to be calculated in an efficient, uniform, and reproducible manner. LATIS in Action: Impact of Climate Change on Risk The calculation of climate change scenarios in Flanders is one of the first projects for which the LATIS tool has been used. These climate change scenarios are based on regional climate models for different levels of CO2 emissions. Based on potential change in rainfall and evaporation rates, a high, mean and low scenario was defined for the summer and winter period in Flanders. In general, the potential for drought is expected to increase during the summer, while changes that may occur during the winter are highly uncertain (represented by a strong increase in flooding in the high scenario to a slight decrease in flooding in the low scenario). The runs of the hydraulic model were executed based on the climate change scenarios and the available measurement series for water level, discharge and evaporation in order to derive catchment flood maps with different return periods. Both flood extent and water depth were used as the main factors influencing damage. Flood maps were used to recalculate damage and risk maps with the most recent socio-economic data available. These maps were used as references and compared with the flood risk maps produced under the climate change scenarios. For all four scenarios (current, low, mean and high), the flood risk is based on the same series of return periods as are used for flood map calculations (1, 50, 100 and 500 years). A relatively small increase or decrease in water level can cause large differences in damage and risk. Vulnerable sites that are flooded once a century (on average) can be flooded more frequently, causing the risk to increase significantly. On the other hand, a large increase in water depth on agricultural land does not lead to a large increase in damage and risk because once crops are rotten, water depth is no longer important. Economic damages are generally calculated for such features as housing, industry, and agricultural land. However, special attention is given to local features that are: (1) sensitive to extreme high damage values (e.g., power supply installations, museums), (2) important in case of an emergency (e.g., fire brigades, police stations) and (3) problematic due to evacuation reasons (e.g., hospitals, retirement homes). Interpretation of the results of the damage and risk maps from the climate change scenarios is done (as for all flood risk assessments) in a relative manner
  • 6. 5 Conclusions and Further Developments LATIS, a GIS application for assessing flood risk in Flanders, Belgium has been described, including an overview of the underlying risk methodology, which incorporates hydrologic and hydraulic models, land use information and socio-economic data. Presently, LATIS is being used as part of social cost-benefit analyses for estimating the effects of flood mitigation measures. These analyses are being performed in support of several riverine and coastal management plans, including studies on the widening and deepening of waterways, the construction of controlled flood zones, and proposed improvements in the coastal defense infrastructure. These plans not Currently, LATIS is limited to only four types of damage: monetary, internal, and direct/indirect. Future improvements to the methodology could include adding external and non-monetary damage to the model. The model could be further improved with the use of more detailed base data. The main reason the current methodology uses aggregated data is pragmatic: data gathering is a time-consuming and costly job and processing time becomes longer with more detailed data. Therefore, the decision was made to work with generalized spatial data and to proceed gradually to more detailed data when more time and resources become available. This future work is important because estimating the number of people who could be afflicted directly impacts evacuation needs. Fortunately, although Flandersโ€™ flood plains are densely populated, it boasts a dense road network that is expected to support substantial evacuation numbers in the event of a calamity. Flood risk hotspots of Pakistan References Ahola, T., Virrantaus, K., Krisp, J. M., Hunter, G. J. (2007). A spatio-temporal population model to support risk assessment and damage analysis for decision-making. International Journal of Geographical Information Science, 21(8), 935โ€“953. Allsop, N.W.H. (2005). D38: Report on Hazard Analysis. Report CLASH WP6, Coordinator HR Wallingford, 28p. Breyer, F., Felder, S. (2005). Mortality Risk and the Value of a Statistical Life: The Dead-Anyway Effect Revis(it)ed. Geneva Risk and Insurance Review, 30(1), 41โ€“55. Burrough, P.A., McDonnel R.A. (1998). Principles of Geographical Information Systems, Oxford University Press, Oxford, p. 333. Card W.I., Mooney G.H. (1977). What is the monetary value of a human life? British Medical Journal, 2, 1627โ€“1629.