1. KQM-BR07-V00
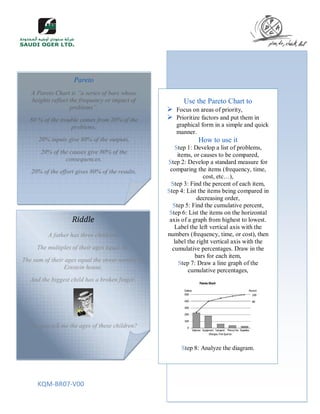
Use the Pareto Chart to
Focus on areas of priority,
Prioritize factors and put them in
graphical form in a simple and quick
manner.
How to use it
Step 1: Develop a list of problems,
items, or causes to be compared,
Step 2: Develop a standard measure for
comparing the items (frequency, time,
cost, etc…),
Step 3: Find the percent of each item,
Step 4: List the items being compared in
decreasing order,
Step 5: Find the cumulative percent,
Step 6: List the items on the horizontal
axis of a graph from highest to lowest.
Label the left vertical axis with the
numbers (frequency, time, or cost), then
label the right vertical axis with the
cumulative percentages. Draw in the
bars for each item,
Step 7: Draw a line graph of the
cumulative percentages,
Step 8: Analyze the diagram.
Riddle
A father has three children:
The multiples of their ages equal 36,
The sum of their ages equal the street number of
Einstein house,
And the biggest child has a broken finger.
Can you tell me the ages of these children?
Pareto
A Pareto Chart is “a series of bars whose
heights reflect the frequency or impact of
problems”.
80 % of the trouble comes from 20% of the
problems,
20% inputs give 80% of the outputs,
20% of the causes give 80% of the
consequences,
20% of the effort gives 80% of the results.