NordCoLa-seminar: Chantal Julia - Food labelling as a tool of public health policy - the NutriScore scheme
•
1 like•470 views

Chantal Julia, Food Composition Data for Food Labelling and Public Health -seminar (NordCoLa), 17.4.2019

Recommended
More Related Content
What's hot
What's hot (20)
Similar to NordCoLa-seminar: Chantal Julia - Food labelling as a tool of public health policy - the NutriScore scheme
Similar to NordCoLa-seminar: Chantal Julia - Food labelling as a tool of public health policy - the NutriScore scheme (20)
More from THL
More from THL (20)
Recently uploaded
Recently uploaded (20)
NordCoLa-seminar: Chantal Julia - Food labelling as a tool of public health policy - the NutriScore scheme
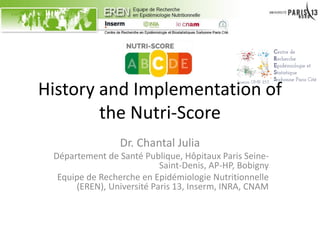
- 1. History and Implementation of the Nutri-Score Dr. Chantal Julia Département de Santé Publique, Hôpitaux Paris Seine- Saint-Denis, AP-HP, Bobigny Equipe de Recherche en Epidémiologie Nutritionnelle (EREN), Université Paris 13, Inserm, INRA, CNAM
- 2. Context • Front-of-pack nutrition labels (FOPL) • Complementary to the nutrition declaration – Considered as difficult to understand • FOPL – Help consumers in decision making • Orient towards healthier foods – Entice reformulation/innovation towards healthier foods 1989 Sweden 2000 Finland 2005 UK 2006 Netherlands 2014 NZ-Aus 2016 Chile
- 3. Context • Report to the French Minister of Health – Jan 2014 • New proposals in Public Health Nutrition – Consumer information – Nutritional education – Improvement of food supply
- 4. FOPL proposal • Based on scientific literature – Summary labels > nutrient- based labels • In particular for vulnerable populations – Affixed on all foods > Affixed on a fraction of foods – Colour-coded schemes > numerical information • Use of ‘semantic’ colours Development of a graded coloured summary label
- 5. Nutrient profiling system : FSA/ofcom score Nutrient/100g Points Energy (KJ) 0-10 Sugars (g) 0-10 Saturated fat (g) 0-10 Sodium (g) 0-10 Element/100g Points Fruit, vegetables and nuts (%) 0-5 Fibres (g) 0-5 Proteins (g)* 0-5 A Points 0-40 points C Points 0-15 points — FINAL SCORE Arambepola, C., Rayner et al. Pub Health Nutr 11(4), 371-378. 2008. Julia, Kesse-Guyot et al. Br J Nut, 112(10), 1699-1705. 2014. Julia, Kesse-Guyot et al., Nutrition Journal, (2015) 14:100 Higher nutritional quality Lower nutritional quality -15 40Adaptations for Cheese Beverages Fats and oils
- 6. Theoretical framework Nutrient profiling system Adapted from Townsend et al., 2010 Application Transposition to diet Prospective association health Graphical design Adapted from Grunert et al., 2007 Perception Understanding Use in purchasing situation Potential impact on health Attitude
- 7. Classification of foods – FSA score Julia. Kesse-Guyot et al. Br J Nutr. 112(10). 1699-1705. 2014. Julia. Hercberg et al. Obésité 2015 Julia et al.. BMC Pub Health. 2015Julia et al.. Nutrition Journal. 2015 Julia et al. Cah Diet Nut. 2015 ANSES, 2015 • Test in 4 food composition tables • NutriNet-Santé • Open Food Facts • Breakfast cereals • OQALI (ANSES) • Hierarchy between food groups • Fruits and vegetables vs. • Snacking products • High variability within food groups • Substitution of foodsFatand sauces Saltysnacks Sugarysnacks FishMeatEggs Dairyproducts Cereals and potatoes Fruits and Vegetables -10 0 10 20 OfCom score Higher nutritional quality Lower nutritional quality - 15 40
- 8. Transpose to the diet of individuals • Development of the FSA-NPS DI • Based on the FSA score of foods and beverages consumed • Transposition to the diet of individuals Application in cohort and cross-sectional studies NutriNet-Santé – SU.VI.MAX cohorts ENNS cross-sectional study Meilleure Qualité nutritionnelle Moins bonne Qualité nutritionnelle Foods Diets
- 9. Cancer CVD Obesity Men Obesity Women Metabolic syndrome Quintile 1 Quintile 2 Quintile 3 Quintile 4 Quintile 5 Quartile 1 Quartile 2 Quartile 3 Quartile 4 Quartile 1 Quartile 2 Quartile 3 Quartile 4 Quartile 1 Quartile 2 Quartile 3 Quartile 4 Quartile 1 Quartile 2 Quartile 3 Quartile 4 0.5 2 P=0.03 P=0.03 P=0.01 P=0.39 P=0.02 Foods Diets Health Prospective association health Donnenfeld. Touvier et al. Br J Nutr 2015;1-9 Adriouch. Fezeu. Touvier et al.. EJ Prev Card, 2016 Julia. Kesse-Guyot et al.. Prev Med 2015;81:189-94 Julia. Kesse-Guyot et al.. J Nutr. 2015 Oct;145(10):2355-61 Prospective cohorts • SU.VIMAX • Randomized trial • 13y of follow-up • NutriNet-Santé • Web-based prospective cohort • 4y of follow-up Results • Q5 vs. Q1 + 34% cancer + 52% breast cancer • Q4 vs. Q1 + 61% overweight and obesity (men) +43% MetS + 40 / 63% MCV
- 10. Perception – Objective understanding PERCEPTION • Self-administered questionnaire • Three aspects of perception – Acceptability – Liking – Perceived cognitive workload Cod, carrots and fennel Cod with butter sauce and risotto Salmon with mashed potatoes with olive oil (2%) Ducrot, Péneau et al, Plos One 10(10), e0140898. 2015 Ducrot, Péneau et al., Nutrients. 7(8), 7106-7125. 2015 OBJECTIVE UNDERSTANDING • Classification of 3 products • According to the information provided by the simplified FOP nutrition labelling • 5 Categories of products testedGDA 5-CNL MTL Tick
- 11. Ducrot et al. Nutrients. 2015 Objective understanding • Ability to rank products according to their overall nutritional quality – No label situation – Comparison across labels • Results – All labels improve understanding in consumers – The magnitude of effect differs across labels • Nutri-Score: improvement up to 20 times compared to a no labels situation – Differences across sub-groups of the population • Nutri-Score: the most efficient in particular in vulnerable populations
- 12. International comparative study • Assessment of consumers’ response to five FoPLs currently in use in the world – Objective Understanding – Attitudes – Effect on food choice • International comparison across 12 countries: Argentina, Australia, Bulgaria, Canada, Denmark, France, Germany, Mexico, Singapore, Spain, United Kingdom, United States 12
- 13. • Participants 12,015 adults recruited in twelve countries (~1000/country) using an internation web panel provider Quota sampling on: Sex: 1/1 ratio Age: 1/3 in 18-30 years, 31-50 years and over 51 years Socioeconomic status: 1/3 in high, medium, low income households Regular consumers of the food categories tested • Design and stimuli 3 food categories (pizzas, cakes, cereals) with high variability in nutritional quality within the category and consumed in all 12 countries Within each food category: 3 products with distinct nutritional profiles (lower, intermediate, and higher nutritional quality) Creation of mock packages 13
- 14. • Results of the associations between FoPLs and the ability of correclty rank products 14Odd Ratios and 95% confidence intervals of the association between FOP labels and improvement of ranking ability compared to RIs * Significant associations after multiple testing correction
- 15. Comparative studies • Alternatives proposed during the concertation process • Graphical formats compared – Nutriscore – SENS – MTL – Modified Reference Intakes – Control : no label • Modification of purchasing behavior – Overall nutritional quality of the items in the shopping cart (FSA score) • Types of studies – Large scale experimentation – Experimental economy SENS NUTRI-REPERES MTL=‘Nutri-Couleurs NUTRISCORE
- 16. Large scale experimentation • 60 supermarkets – 10 for each label – 20 controls • 4 regions • 10 weeks • Intervention – Limited to 4 shelves • Fresh deli • Bread • Pastries • Canned prepared meals – Voluntary • Between 63% et 86% of labeled products • Data collected: receipts
- 17. Large scale experimentation • Improvement of the shopping cart + 4,5% + 3,9% 3,3 % • Sub-group analysis – Nutri-Score: Higher impact in subjects buying discount brands – Nutri-Score: No deterioration of the nutritional quality of the shopping cart in any subgroup
- 18. Experimental economy study • Intervention in controlled setting – Controlled and reproducible experimental food store of 290 foods – 691 participants – Constitution of a shopping cart before an after exposure to a label • Results – The Nutri-Score is associated with the highest improvement – Nutri-Score performs best in households with lower incomes Crosetto et al., 2017 Nutritional quality Overall <2000€/m +9,3% +9,4% +6,6% +6,5% +4,8% +3,6% +3,6% +2,1% +2,9% +2,2% Control -0,2% -0,2%
- 19. Nutri-Score as official FOPL • Signature on Oct 2017 • On Jan 2019 – >110 brands registered – ≈20% market share – Large and small brands • Reformulation strategies based on the Nutri-Score • Adoption by Belgium and Spain
- 20. Thank you Nutritional quality + - To encourage To limit
- 21. Review of the studies performed on 5-CNL and Nutri-Score Published in Dec 15th, 2017 http://www.euro.who.int/en/publications/public-health-panorama/journal-issues/volume- 3,-issue-4,-december-2017/review3