
Recommended
Recommended
More Related Content
What's hot
What's hot (20)
Similar to Indicator Analysis Steps and Techniques, M&E training part-2, sushanta, fao, cox's bazar
Similar to Indicator Analysis Steps and Techniques, M&E training part-2, sushanta, fao, cox's bazar (20)
Recently uploaded
Recently uploaded (20)
Indicator Analysis Steps and Techniques, M&E training part-2, sushanta, fao, cox's bazar
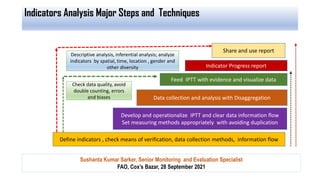
- 1. Indicators Analysis Major Steps and Techniques Define indicators , check means of verification, data collection methods, information flow Develop and operationalize IPTT and clear data information flow Set measuring methods appropriately with avoiding duplication Data collection and analysis with Disaggregation Feed IPTT with evidence and visualize data Share and use report Check data quality, avoid double counting, errors and biases Descriptive analysis, inferential analysis; analyze indicators by spatial, time, location , gender and other diversity Indicator Progress report Sushanta Kumar Sarker, Senior Monitoring and Evaluation Specialist FAO, Cox’s Bazar, 28 September 2021
- 2. Different forms of Indicators Environmental Indicators Institutional and Policy/legislative Indicators Social Indicators Economic Indicators Result wise indicators Outcome Indicators Output Indicators Activities Indicators Input indicators Quality Quantitative indicators Qualitative Indicators Structural Indicators Composite indicator Standard Indicator Custom Indicator Progress Progress Indicators Process Indicators Support in absence of appropriate indicators Proxy Indicators Sushanta, 28 September 2021
- 3. Process Indicators Progress Indicators Input indicators Activities indicators Output indicators Impact Indicators Indicators in Result Chain Sushanta, 28 September 2021
- 4. Livelihoods Indices (Examples) Economic Environmental Social Institutional • % of increased Income • % increased new value • Gross Profit Margin • Average Productivity • Number of person benefitted, • Increased investment of private company in livelihoods development • Reduced market deficiencies • Ha of land under improved natural resource management • Percentage of natural resource dependent households adopted improved farming techniques • Number of hectares of degraded forestland reforested / rehabilitated . • Number of nurseries gained improved knowledge and techniques • Soil Fertilizer use • Fertilizer management • % of community members who perceive the natural resource governance mechanisms as effective and fair • % adopted improved agricultural technologies • % of women empowerment • Number of trained • Increased occupational safety • %Increased access to market • Number of instructions adopted • Management practices improved • Number of policy dialogue conducted • Number of policy implemented • Number of extension staff are able to provide ICT support to the organizations Sushanta, 28 September 2021
- 5. Challenges of Indicators Analysis Defining indicators and feeding IPTT Alignment with indicators, means of verification and methodologies Double counting, validation and quality Utilize inappropria te methods and data collection Disaggregated data (Sex, Age, disability and other diversity) Lack of evidence for each progress value Sushanta, 28 September 2021
- 6. Indicators Analysis Major Steps and Techniques Define indicators , means of verification, identify mean utilities and target audiences Develop and operationalize IPTT and clear data information flow Set measuring methods appropriately with avoiding duplication Data collection and analysis with Disaggregation Feed IPTT with evidence and visualize data Share and use report Check data quality, avoid double counting, errors and biases Descriptive analysis, inferential analysis, Analyze indicators by spatial, time, location , gender and other diversity Indicator Progress report Sushanta, 28 September 2021
- 7. Performance Indicator Reference Sheet
- 8. Data Disaggregation Sushanta, 28 September 2021 Other diversities Disability Sex Location Age Indicator Disaggregation
- 9. Performance Indicators Tracking Table Indicator Result Measured by Indicator Type of Indicator Data Source and method Frequency Unit of Measure PPR (Y/N) Target (if applicable) Achivement % of progress Reason of variation Comments /Evidences Value Value Sushanta, 28 September 2021
- 10. Indicator Analysis Techniques Sushanta, 28 September 2021 Calculate Percentage (Nominator/ denominator)x 100 Calucate Average Average = Total sum of progress value/Number of item in Set Indicatorsarelooking similarwhilethemeasuring Indicators MeasuringTechniques Increased Knowledge Preandposttestsummary Increased perception Survey Increased capacity Trainingfollow-upassessment Indictor are looking similar but not the same. Indicators Results Number of people reached Activities/low outputs Number of people benefitted Outcome Number of people supported Activities/low outputs
- 11. Indicators analysis techniques Indicators Calculation Techniques % of farmers net income increased from agriculture Total net income= (Total sales/revenue+ value of home consumption) - total production cost and other expenses value (for farmers) Total sales/revenue - total expenses value =Total net income ( for Traders) Gross profit margin Operating Profit Margin Net Profit Margin Average Household income 𝐺𝑟𝑜𝑠𝑠 𝑃𝑟𝑜𝑓𝑖𝑡 𝑀𝑎𝑟𝑔𝑖𝑛=𝑅𝑒𝑣𝑒𝑛𝑢𝑒−𝐶𝑂𝐺𝑆𝑅𝑒𝑣𝑒𝑛𝑢𝑒 /Revenue Operating Profit Margin =Operating Profit/Net Sales X 100 Net profit margin Net income/Net sales x100 Total HHs income in the area/ total number of households in the areas Sushanta, 28 September 2021
- 12. Indicators analysis techniques Indicators Calculation Techniques % of production growth increased Current production value – baseline/past year production valueX100 = Percent of production growth Example: 300 tone in 2019 and 500 tone in 2020 The increase value= (500-300)/300)x100 plantation density increased Plant population = (field area * number of plant/stand) / ((plant spacing + walkway width) * row spacing) Percent field emergence Value added [100 x crop (plants/ha)] / number seeds (seeds/ha) 𝑉𝑎𝑙𝑢𝑒 𝑎𝑑𝑑𝑒𝑑=𝑅𝑒𝑣𝑒𝑛𝑢𝑒𝑠+𝑂𝑡ℎ𝑒𝑟 𝑖𝑛𝑐𝑜𝑚𝑒−𝑂𝑝𝑒𝑟𝑎𝑡𝑖𝑛𝑔 𝑐𝑜𝑠𝑡𝑠 𝑁𝑒𝑡 𝑣𝑎𝑙𝑢𝑒 𝑎𝑑𝑑𝑒𝑑= 𝑉𝑎𝑙𝑢𝑒 𝑎𝑑𝑑𝑒𝑑 – 𝐷𝑒𝑝𝑟𝑒𝑐𝑖𝑎𝑡𝑖𝑜𝑛 Sushanta, 28 September 2021
- 13. Indicators analysis techniques Indicators Calculation Techniques Proportion of community investment 𝑃𝑟𝑜𝑝𝑜𝑟𝑡𝑖𝑜𝑛 𝑜𝑓 𝑐𝑜𝑚𝑚𝑢𝑛𝑖𝑡𝑦 𝑖𝑛𝑣𝑒𝑠𝑡𝑚𝑒𝑛𝑡 / 𝐶𝑜𝑚𝑚𝑢𝑛𝑖𝑡𝑦 𝑖𝑛𝑣𝑒𝑠𝑡𝑚𝑒𝑛𝑡 𝑅𝑒𝑣𝑒𝑛𝑢𝑒 𝐻𝑎𝑏𝑖𝑡𝑎𝑡 𝑎𝑟𝑒𝑎 𝑝𝑟𝑜𝑡𝑒𝑐𝑡𝑒𝑑/𝑐𝑟𝑒𝑎𝑡𝑒𝑑/𝑟𝑒𝑠𝑡𝑜 𝑟𝑒𝑑 𝑟𝑎𝑡𝑖𝑜 𝑇𝑜𝑡𝑎𝑙 𝑎𝑟𝑒𝑎 𝑜𝑓 ℎ𝑎𝑏𝑖𝑡𝑎𝑡 𝑝𝑟𝑜𝑡𝑒𝑐𝑡𝑒𝑑,𝑐𝑟𝑒𝑎𝑡𝑒𝑑 𝑜𝑟 𝑟𝑒𝑠𝑡𝑜𝑟𝑒𝑑 𝑇𝑜𝑡𝑎𝑙 𝑙𝑎𝑛𝑑 𝑎𝑟𝑒𝑎 𝑢𝑠𝑒𝑑 Total crop land are 𝐹𝑒𝑟𝑡𝑖𝑙𝑖𝑧𝑒𝑟 𝑢𝑠𝑒 𝑖𝑛𝑡𝑒𝑛𝑠𝑖𝑡𝑦𝑛𝑢𝑡𝑟𝑖𝑒𝑛𝑡=𝑇𝑜𝑡𝑎𝑙 𝑎𝑚𝑜𝑢𝑛𝑡 𝑜𝑓 𝑓𝑒𝑟𝑡𝑖𝑙𝑖𝑧𝑒𝑟𝑠 𝑢𝑠𝑒𝑑𝑛𝑢𝑡𝑟𝑖𝑒𝑛𝑡/𝑇𝑜𝑡𝑎𝑙 𝑐𝑟𝑜𝑝𝑙𝑎𝑛𝑑 𝑎𝑟𝑒𝑎 Average hours of training per year per employee 𝐴𝑣𝑒𝑟𝑎𝑔𝑒 ℎ𝑜𝑢𝑟𝑠 𝑜𝑓 𝑡𝑟𝑎𝑖𝑛𝑖𝑛𝑔 𝑝𝑒𝑟 𝑦𝑒𝑎𝑟 𝑝𝑒𝑟 𝑒𝑚𝑝𝑙𝑜𝑦𝑒𝑒 = 𝑇𝑜𝑡𝑎𝑙 ℎ𝑜𝑢𝑟𝑠 𝑜𝑓 𝑒𝑚𝑝𝑙𝑜𝑦𝑒𝑒 𝑡𝑟𝑎𝑖𝑛𝑖𝑛𝑔 𝑠𝑢𝑝𝑝𝑜𝑟𝑡𝑒𝑑 𝑏𝑦 𝑡ℎ𝑒 𝑒𝑛𝑡𝑖𝑡𝑦 𝑁𝑢𝑚𝑏𝑒𝑟 𝑜𝑓 𝑒𝑚𝑝𝑙𝑜𝑦𝑒𝑒𝑠 𝑎𝑛𝑑 𝑤𝑜𝑟𝑘𝑒𝑟𝑠 % of women empowered in agricultural index WEAI = 0.9(5DE) + 0.1(GPI) Or WEAI = 0.9{He+ (Hn x Aa)} + 0.1{1 - (Hw x Rp)}
- 14. Indicators analysis techniques In 𝑃𝑟𝑜𝑝𝑜𝑟𝑡𝑖𝑜𝑛 𝑜𝑓 𝑐𝑜𝑚𝑚𝑢𝑛𝑖𝑡𝑦 𝑖𝑛𝑣𝑒𝑠𝑡𝑚𝑒𝑛𝑡 / 𝐶𝑜𝑚𝑚𝑢𝑛𝑖𝑡𝑦 𝑖𝑛𝑣𝑒𝑠𝑡𝑚𝑒𝑛𝑡 𝑅𝑒𝑣𝑒𝑛𝑢𝑒 𝐻𝑎𝑏𝑖𝑡𝑎𝑡 𝑎𝑟𝑒𝑎 𝑝𝑟𝑜𝑡𝑒𝑐𝑡𝑒𝑑/𝑐𝑟𝑒𝑎𝑡𝑒𝑑/𝑟𝑒𝑠𝑡 𝑇𝑜𝑡𝑎𝑙 𝑎𝑟𝑒𝑎 𝑜𝑓 ℎ𝑎𝑏𝑖𝑡𝑎𝑡 𝑝𝑟𝑜𝑡𝑒𝑐𝑡𝑒𝑑,𝑐𝑟𝑒𝑎𝑡𝑒𝑑 𝑜𝑟 𝑟𝑒𝑠𝑡𝑜𝑟𝑒𝑑 𝑇𝑜𝑡𝑎𝑙 𝑙𝑎𝑛𝑑 𝑎𝑟𝑒𝑎 𝑢𝑠𝑒𝑑 Total crop land are 𝐹𝑒𝑟𝑡𝑖𝑙𝑖𝑧𝑒𝑟 𝑢𝑠𝑒 𝑖𝑛𝑡𝑒𝑛𝑠𝑖𝑡𝑦𝑛𝑢𝑡𝑟𝑖𝑒𝑛𝑡=𝑇𝑜𝑡𝑎𝑙 𝑎𝑚𝑜𝑢𝑛𝑡 𝑜𝑓 𝑓𝑒𝑟𝑡𝑖𝑙𝑖𝑧𝑒𝑟𝑠 𝑢𝑠𝑒𝑑𝑛𝑢𝑡𝑟𝑖𝑒𝑛𝑡/𝑇𝑜𝑡𝑎𝑙 𝑐𝑟𝑜𝑝𝑙𝑎𝑛𝑑 𝑎𝑟𝑒𝑎 Average hours of training per year per employee 𝐴𝑣𝑒𝑟𝑎𝑔𝑒 ℎ𝑜𝑢𝑟𝑠 𝑜𝑓 𝑡𝑟𝑎𝑖𝑛𝑖𝑛𝑔 𝑝𝑒𝑟 𝑦𝑒𝑎𝑟 𝑝𝑒𝑟 𝑒𝑚𝑝𝑙𝑜𝑦𝑒𝑒 = 𝑇𝑜𝑡𝑎𝑙 ℎ𝑜𝑢𝑟𝑠 𝑜𝑓 𝑒𝑚𝑝𝑙𝑜𝑦𝑒𝑒 𝑡𝑟𝑎𝑖𝑛𝑖𝑛𝑔 𝑠𝑢𝑝𝑝𝑜𝑟𝑡𝑒𝑑 𝑏𝑦 𝑡ℎ𝑒 𝑒𝑛𝑡𝑖𝑡𝑦 𝑁𝑢𝑚𝑏𝑒𝑟 𝑜𝑓 𝑒𝑚𝑝𝑙𝑜𝑦𝑒𝑒𝑠 𝑎𝑛𝑑 𝑤𝑜𝑟𝑘𝑒𝑟𝑠 In the context of SDG Target 4.3, it is recommended to disaggregate this indicator by sex and age group. % of women empowered in agricultural index WEAI = 0.9(5DE) + 0.1(GPI) Or WEAI = 0.9{He+ (Hn x Aa)} + 0.1{1 - (Hw x Rp)} Proportion of community investment 𝑃𝑟𝑜𝑝𝑜𝑟𝑡𝑖𝑜𝑛 𝑜𝑓 𝑐𝑜𝑚𝑚𝑢𝑛𝑖𝑡𝑦 𝑖𝑛𝑣𝑒𝑠𝑡𝑚𝑒𝑛𝑡 / 𝐶𝑜𝑚𝑚𝑢𝑛𝑖𝑡𝑦 𝑖𝑛𝑣𝑒𝑠𝑡𝑚𝑒𝑛𝑡 𝑅𝑒𝑣𝑒𝑛𝑢𝑒 Sushanta
- 17. Thanks