
Recommended
More Related Content
What's hot
What's hot (20)
Similar to Effective M&E System and How to Avoid Common Mistakes in Logframe -Sushanta Kumar Sarker, 31 August, 2021
Similar to Effective M&E System and How to Avoid Common Mistakes in Logframe -Sushanta Kumar Sarker, 31 August, 2021 (20)
Recently uploaded
Recently uploaded (20)
Effective M&E System and How to Avoid Common Mistakes in Logframe -Sushanta Kumar Sarker, 31 August, 2021
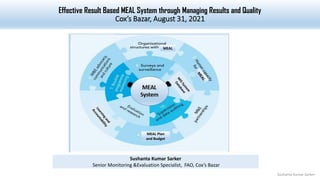
- 1. Effective Result Based MEAL System through Managing Results and Quality Cox’s Bazar, August 31, 2021 Sushanta Kumar Sarker Senior Monitoring &Evaluation Specialist, FAO, Cox’s Bazar MEAL MEAL Plan and Budget Sushanta Kumar Sarker
- 2. Trends of MEAL in Cox’s Bazar Context (2017-2021 & Onwards) Inputs Activities Outputs Outcomes Impacts Increasing Stabilities and qualities; changing Service Priorities; more in-depth evidence based MEAL High/ Emergency 2017-18 High emphasis on Inputs-Outputs Monitoring Emergency and Stabilization 2019 Emphasis on Inputs-Outcome Increasing Resilence 2021 in terms of refugee influx context Inputs-Impact (entire process monitoring to progress monitoring, use more in-depth and evidence based information) Impact Context and timeline Results Chain Sushanta Kumar Sarker
- 3. MEAL BASICS ELEMENTS Monitoring Context, delivery, quality, thresholds, indicators, beneficiaries, processes, strong information management Evaluation Relevance, efficiency, effectiveness, outcome, impact sustainability Accountability Accountability for the affected population, including primary and secondary beneficiaries, tracking, solution Learning From and adapt according to evidence; disseminate learning for improved Tools: i.e. Learning agenda, Learning Log, learning database Tools: i.e. Hotline, Reflection meeting, email, AAP tracker, etc. Tools-i.e. Logframe, Result Matrix, Monitoring Indicators, Matrix, IPTT, PDM, Distribution Monitoring, Tools-i.e. Theory of change, res, result Matrix, effeteness checking tools, households survey Results-based MEAL system is integrated with result indicators, MEAL plan including information flow chain, learning and accountability which monitor and measure (what we call “monitoring”) each steps of result chain is a continuous process of collecting and analyzing information on key indicators, and comparing actual results to expected results and integrated learning Sushanta Kumar Sarker
- 4. Stages Tools Utilization 1. MEAL System Planning Tools Logframe, Result Matrix, MEAL planning Matrix, Indicator performance tracking Drive to design and develop a MEAL system 2. MEAL Operational Tools MIS database (i.e. Beneficiaries, Machinery), LMS, 5W tools, etc. Operationalize &roll on MEAL system 3. Data collection Online tools- Kobo tool box (livelihoods), Open Foris (Forestry) Androdoid Tab, Input, Process, Activities- Quality monitoring tools (standardization of livestock, Agriculture, eligibility check list, Beneficiary registration form/ basic profile, Organizational capacity assessment, Plantation Mapping, Clinometer, GPS, Android Tab, diameter tape, compass, distance measurement, Pre-post, event monitoring (i.e. training, distribution, plantation), Event tracker, 5W, Market monitoring, Production forecasting, COVID tracker Outputs, Outcomes and Impact Progress monitoring tracker, Post distribution monitoring (Agricultural inputs, i.e. seeds, agro-machinery, IPTT, LMS, questionnaire, FGDs, KII, II, Ranking, Time Series outcome monitoring tools for the plantation, nursery, seeds utilizations, production and income tracker, survey, impact monitoring questionnaires, etc, • Ensure program quality • Track results of the program • Provide exact picture of the program and extent of progress achieved. Extract learning, identify innovation and good practice • Provide findings to the management for immediate decision making and determine future strategies • Strengthen the affected people voice Process & Progress Monitoring (Input, Activities, outputs, outcome and impact) 4. AAP &Learning Hoteline, email, reflection meeting, AAP tracker, learning/ learning database 5.Data Analysis Excel, SPSS, GIS, ODK, KoBo tool box, Power Bi, Open Foris, Earth Engine, etc. Descriptive, inferential and geospatial data analysis and visualization for the situation and progress. 6. Data visualization Data storage and Dissemination MEAL database ( Beneficiary, agro machinery, event, training, Plantation Mapped) Livelihoods, food security & NRM data storage and share. MEAL Stages, Type of Tools & Utilization, Cox’s Bazar Sushanta Kumar Sarker
- 5. Result Chain Basics and Link with MEAL Inputs Activities Outputs Outcomes Impact Implementation Results Assumptions MEAL Sushanta Kumar Sarker
- 6. Improved food security and resilience of the host community households and Rohingya Refugees in Cox’s Bazar Result Chain in Casual Linkage Sushanta Kumar Sarker
- 7. Components of MEAL 1. Organizational Structures with MEAL Functions 2. Human Capacity for MEAL 3. Partnerships for Planning, Coordinating and Managing the MEAL System 4. M&E frameworks with indicators setting and tracking system 5. M&E Work Plan and Costs 6. Communication, Advocacy and Culture for M&E 7. Routine Programme Monitoring 8. Surveys and Surveillance 9. MIS System (Information flow chain, database and data quality assurance) 10. Reporting channel and system 11. Evaluation and Research 12. Learning system 13. Accountability system 14. Data Dissemination and Utilization Sushanta Kumar Sarker
- 8. MEAL in Project Cycle Management Sushanta Kumar Sarker
- 9. SDG MEAL in Project Cycle Management Sushanta Kumar Sarker
- 10. Sushanta Kumar Sarker Significance of MEAL Management decision making, Improved project performance and Quality Key Significance of MEAL
- 11. Common Mistakes and Challenges in Log frame and How to Avoid Sushanta Kumar Sarker
- 12. Mistake One: LFA (Logical Framework Approach) and LFM (Logframe Matrix) is not similar LFM (4/4 matrix) is a part of logical framework approach. It is developed after analysis phase. LFM (Logframe Matrix) Sushanta Kumar Sarker
- 13. Mistake-Two: Overlapping of Analysis phase to formulate planning phase Please, ensure analysis phase to avoid mistakes Sushanta Kumar Sarker
- 14. Mistake three: Lack of Knowledge in Establishing linkage vertical and horizontal logic Please, integrate vertical and horizontal logic combined and appropriately • The vertical logic identifies what the project intends to do, clarifies the causal relationships and specifies the important assumptions and uncertainties beyond the project manager's control. • The horizontal logic relates to the measurement of the effects of, and resources used by, the project through the specification of key indicators of measurement, and the means by which the measurement will be verified. Sushanta Kumar Sarker
- 15. Mistake four: Write assumptions in the overall objectives is not correct. The structure and terminologies of the elements seems diverse but the basics are almost similar in LFA/LFM Writing assumption in the overall objective is not appropriate in terms of “if” and “then” logic and try to avoid. But, if any authorities practiced, do not ignore it. Intervention Logic (Project Summary) Objectively Verifiable Indicators (OVI) Means of Verification (MoV) Assumptions Overall Objective (Goal/Impact) IF the purpose/outcome is achieved, THEN this should contribute towards the goal/impact Purpose (outcome) IF outputs are produced, THEN the purpose/outcome will be achieved And assumptions Results (outputs) IF the activities are undertaken, THEN outputs can be produced And assumptions Activities IF adequate inputs are provided, THEN activities can be undertaken And assumptions Sushanta Kumar Sarker
- 16. Wrong Indicators Setting (Not SMART) (Example) Increased capacity of farmers to utilize learning technologies (Not specific, measurable and time bound) Improved dietary diversity (Not specific, measurable and time bound) Decrease 20% negative coping mechanisms of vulnerable farmers by one by five months ( Number of people trained (Not Specific) Mistake five: Writing assumption in the Negative approach and setting It is needed to avoid and avoid killing assumption. Mistake Six: Setting not SMART indicators Mistake Seven: Setting too many standard indicators rather than custom indicator Please avoid, it will make the result measurement too difficult Sushanta Kumar Sarker
- 17. Mistake Nine: Mixing with result statement and activities in result section Mistake 10: Write results in interrogative, imperative or exclamatory sentences Wrong Result Statement Results Integrate 5,000 farmers in market monitoring system Increase negative coping mechanisms of vulnerable farmers livelihoods Increase food consumption score of the 9,000 household Mistake Eight: Setting too many indicators under one result Please, select one/two appropriate indicators under one result statement which measure the results. It is better to measure result but if the reality requires it can be more than two under one resut in some contexts Sushanta Kumar Sarker
- 18. Risk Assessment and Mitigation Strategies Risks are assessed along 2 dimensions Leading to overall risk level Lijellihood Impact High Medium Low Likelihood "What is the likelihood of the risk materializing given our existing controls?" Minimal Critical Impact "What is the impact of the risk materializing on the grant's objectives & impact?" Mild Severe Sushanta Kumar Sarker
- 19. How to Articulate Result Statements Sushanta Kumar Sarker
- 20. Areas Brief Advantages Standard Structure In terms of structural point of view, logframe is better than ToC because logframe has clear common standard structure (ususally 4/4) while ToC has no structures resulting sometimes it is vague and complicated Relatively understandable ToC is highly understandable than the complex structure of lograme to the wider readers and audience. Adaptability with context ToC is relatively adaptable with the context than logframe. Logframe is highly rigid. As a result ToC benefice the programe and adapt intervention with the changing contexts Project planning Both are important for result management Project implementation A theory of change explains how the activities undertaken by an intervention (such as a project, program or policy) contribute to a chain of results that lead to the intended or observed impacts. MEAL Logframe has indicators, means of verification which provided Result management Both are important for result management. The two models are not contradictory while complementary at many extents. ToC and Logframe Sushanta Kumar Sarker
- 21. MEAL System Design Basics and Gender Sensitive Monitoring Sushanta Kumar Sarker
- 22. MEAL System Designing BASIC • A systematic approach to determine the capacity and willingness of a government or organization to construct a results-based M&E system planning for improvement : selecting realistic targets 5 1 Conducting a Readiness Assessment 3 selecting key indicators to monitor outcomes 7 using evaluation information 9 using findings 2 agreeing on outcomes to monitor and evaluate 4 gathering baseline data on indicators 6 monitoring for results 8 reporting findings sustaining the M&E system within the organization 10 1 Sushanta Kumar Sarker
- 24. Gender Sensitive MEAL . Integrate into Planning Indicators setting and tracking Data collection methods and analysis Result disseminatio n and uses Integrate in to design system Gender-sensitive monitoring and evaluation is used to reveal whether a programme addresses the different priorities and needs of women and men, to assess if it has an impact on gender relations, and to determine the gender aspects that need to be integrated into monitoring and evaluation systems. The inclusion of explicit gender equality objectives to all stages Sushanta Kumar Sarker
- 25. Gender Sensitive Indicators (Example) % increased of the food consumption score of the vulnerable household with special emphasis of women in Cox’s Bazar by 2023 Number of dried fish workers of which at least 50% of women are aware on food safety in Cox’s Bazar % increased of women in market linkages in Cox’s Bazar Number of gender-responsive targets included in the policy % of trained institutes applied gender sensitive tools Number of gender guidelines and materials developed to support the field staff; Disaggregation of Indicator and analysis Integrate gender disaggregation of indicators and analyze finding or progress with gender lens. Sex, Age and disaggregated with other diversity. Sushanta Kumar Sarker