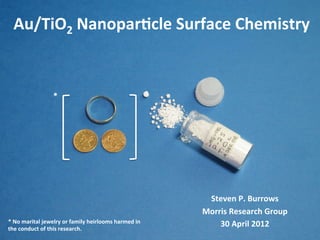
SlideShare a Scribd company logo
1 of 57
Download to read offline
 Au/TiO2	
  Nanopar/cle	
  Surface	
  Chemistry	
  	
  
Steven	
  P.	
  Burrows	
  
Morris	
  Research	
  Group	
  
30	
  April	
  2012	
  
*	
  
*	
  No	
  marital	
  jewelry	
  or	
  family	
  heirlooms	
  harmed	
  in	
  
the	
  conduct	
  of	
  this	
  research.	
  
Nanopar/cles:	
  The	
  Scale	
  
•  Nanopar'cles	
  range	
  from	
  
~3	
  to	
  50	
  x	
  10-­‐9m	
  diameter	
  
(smaller	
  than	
  a	
  virus).	
  
•  Crystalline	
  material	
  on	
  this	
  
size	
  scale	
  begins	
  to	
  assume	
  
molecular	
  proper'es.	
  
•  Electron	
  behavior	
  within	
  
nanopar'cles	
  “between	
  
bands	
  and	
  bonds”2	
  
2	
  
2 x 10⁻⁶ m 2 x 10⁻⁸ m Degussa P25
0.25 x 10⁻⁸ m
Au 'Decoration'
0.04 x 10⁻⁸ m
1Bacteria Virus Nanoparticles
1Archives	
  of	
  Histology	
  and	
  Cytology,	
  2007	
  vol.	
  70	
  (1)	
  pp.	
  43-­‐49	
  
2Applied	
  Spectroscopy,	
  2006	
  vol.	
  56	
  (1)	
  pp.	
  16A-­‐27A	


Valence
Band
Conduction
Band
Egap
HOMO -
LUMO
Gap
Egap
Bulk
Semiconductor Nanoparticle Molecule
Energy
Applica/ons:	
  Present	
  and	
  An/cipated	
  
•  Hydrogen	
  Fuel	
  Produc'on	
  (Water	
  SpliTng)	
  
•  Hydrogen	
  Fuel	
  Storage	
  
•  Photovoltaic	
  Cells	
  
•  Building	
  Materials	
  Coa'ngs	
  (e.g.	
  Self-­‐Cleaning	
  
Windows)	
  
•  An'bacterial	
  Coa'ngs	
  
•  An'-­‐Cancer	
  Therapies	
  
•  Pollu'on	
  Detec'on,	
  Control,	
  and	
  Remedia'on	
  
•  Industrial	
  Process	
  Catalysts	
  
•  Detec'on	
  and	
  Decomposi'on	
  of	
  Chemical	
  Warfare	
  
Agents	
  (CWAs)	
   3	
  
Research	
  Objec/ves	
  
•  Develop	
  understanding	
  of	
  size	
  and	
  loading	
  
effects	
  for	
  Au/TiO2	
  nanopar'cle	
  catalysts.	
  
•  Inves'gate	
  structural	
  effects	
  on	
  catalyst	
  
performance:	
  ‘decorated’	
  vs.	
  aerogel	
  oxide	
  
supports.	
  
•  Maximize	
  cataly'c	
  ac'vity.	
  
•  Develop	
  understanding	
  of	
  reac'on	
  
mechanism	
  through	
  fundamental	
  catalyst	
  
studies.	
  
4	
  
5	
  
Nanopar/cle	
  Prepara/on	
  
And	
  
Cataly/c	
  Ac/vity	
  Screening	
  
Laser	
  Vaporiza/on	
  (LV)	
  Nanopar/cles	
  
•  Sintered	
  tablet	
  of	
  metal	
  oxide	
  vaporized	
  with	
  CO2	
  laser.	
  
•  Vaporized	
  oxide	
  condenses	
  in	
  gas-­‐phase	
  to	
  form	
  nanopar'cles.	
  
•  Nanopar'cles	
  accrete	
  on	
  sheet	
  metal	
  surface.	
  
•  Nanopar'cle	
  size	
  controlled	
  through	
  chamber	
  pressure	
  and	
  
chamber	
  geometry.	
   6	
  
Examples	
  of	
  LV	
  Produced	
  TiO2	
  	
  
7	
  
P	
  =	
  1	
  Torr	
  O2	
   P	
  =	
  100	
  Torr	
  O2	
  
Carbon	
  Monoxide	
  Oxida/on	
  
8	
  
2CO(g)	
  +	
  O2(g)	
  	
   2CO2(g)	
  
CeO2	
  Rela/ve	
  CO	
  Oxida/on	
  Ac/vity	
  
9	
  
300 400 500 600 700 800
-1
0
1
2
3
4
5
6
7
CO2
PeaksArea(2280-2395cm
-1
)
Temperature / K
Blank
No. 1
No. 2
No. 3
No. 4
No. 5
No. 6
No. 7
No. 8
No. 9
CeO2
Nanoparticle Repeatability Study
He
+
O2
+
CO
Temperature
Control System
(100 ~ 675 K)
Catalyst Sample
Screening Tube
He
+
O2
+
CO
+
CO2
IR
Gas
Cell
FTIR Detection
Activity Screening Apparatus
Repeatability	
  Study	
  
CO	
  Screening	
  Method	
  Valida/on	
  
10	
  
100
90
80
70
60
50
40
30
20
10
0
COConversion/%
700600500400300200100
Temperature / K
SPB_069 CeO2 CO Oxidation
Dual Flow Cell Calculations
10	
  
the fluorite structure with a calculated lattice parameter of 5.416
Å, and the other phase still of fluorite structure with a contracted
lattice parameter of 5.403 Å, attributed to a solid solution
between gold and ceria. The closeness of the ionic radii of Ce4+
and Au3+, 0.97 and 0.85 Å, respectively,41 would indeed allow
for the formation of a composite Ce1-xAuxO2-δ (where δ takes
into account the charge balance).25,26 The XRD pattern of the
CP sample calcined at 673 K is shown in Figure 4. Differently
from the DP sample, and as expected from the high-temperature
treatment, this profile reveals the Au (111) and the Au (200)
reflection peaks of metallic gold along with the peaks related
to the CeO2 phase with a certain degree of amorphism. It is
worth mentioning that the further calcinations of the CP sample
at 673 K aimed to form the solid solution, with a modified
fluorite structure of ceria, which appeared to be amorphous after
the 393 K treatment. Moreover, for the purpose of this study,
the attainment of just ionic gold species by the DP method
followed by the mild treatment in air at 393 K fulfilled our
original objective.
In Table 3, the results in terms of the main binding energies,
Au 4f7/2, O 1s, of Au/Ce atomic ratio and gold loading, as
obtained from the XPS quantitative analyses, are reported for
the differently prepared samples. For all samples, no extra peaks
due to impurities were observed. In consideration of the
decreased activity of the 3AuCe(DP) with aging and after the
catalytic reaction, the XPS results of this sample at different
stages of its life, referred to as “as prepared”, “aged”, and
“used”, are listed in the table. Because no such changes in
activity were observed with the samples prepared by the other
two techniques, no distinction between different stages of the
Figure 1. CO conversion % as a function of temperature for the
different catalysts.
TABLE 1: Temperature in Correspondence of the 100%
Conversion of CO
catalyst T100% (K)
3AuCe(DP)393K 301
3AuCe(DP)1monthaged 373
3AuCe(SMAD)298K 427
10AuCe(CP)673K 473
ceria 723
TABLE 2: Average Ceria Crystallite Size, dCeO2, and Au
Particle Size, dAu, As Obtained from XRD Analyses of the
Different Catalysts (Values Are Quoted with an Uncertainty
Ceria-Supported Gold Catalysts J. Phys. Chem. B, Vol. 109, No. 7, 2005 2823
tober2,2009|http://pubs.acs.org
2005|doi:10.1021/jp045928i
Plot	
  Inset:	
  Venezia,	
  A.	
  M.	
  et	
  al.	
  Journal	
  of	
  Physical	
  Chemistry	
  B	
  2005,	
  109,	
  2821-­‐2827.	
  
•  Samples	
  run	
  on	
  glass	
  wool	
  in	
  
glass	
  bulb	
  screening	
  tube.	
  
•  Par'cles	
  condi'oned	
  and	
  
200	
  ∘C	
  for	
  ~	
  30	
  minutes.	
  
•  Note	
  my	
  CeO2	
  achieves	
  50%	
  
CO	
  conversion	
  at	
  ~640K.	
  
•  Venezia	
  CeO2	
  achieves	
  50%	
  
CO	
  conversion	
  at	
  ~550K.	
  
Degussa	
  TiO2	
  With/Without	
  Au	
  
11	
  
200 300 400 500 600 700 800
-2
0
2
4
6
8
10
12
14
16
18
20
22
CO2
PeaksArea(2280-2395cm
-1
)
Temperature / K
Blank
P25 TiO2
P25 TiO2
/ Au
Degussa P25 TiO2
with Solution Precipitated Au
Ti O Ti O Ti
Au
C O C OO
O O
Mul/ple	
  Au	
  Deposi/ons	
  Reactor	
  
12	
  12	
  
F
A
N
F
A
N
Heated Sand Bath
Air-cooled reflux
condenser tubes
Aluminum
air duct
tube
Air FlowAir Flow
Stirrer Motors
Note the removeable top and sliding air ducts for connection to the condenser duct.
Urea	
  Hydrolysis	
  Gold	
  Deposi/on	
  
CO(NH2)2(aq)	
  +	
  3H2O(l)	
  →	
  CO2(g)	
  +	
  2NH4OH(aq)	
  
pH	
  3	
  at	
  30∘C	
  to	
  pH	
  8	
  at	
  T	
  ~	
  80∘C	
  
HAuCl4(aq)	
  +	
  4NH4OH(aq)→	
  Au(OH)3(s)	
  +	
  4NH4Cl(aq)	
  +	
  H2O(l)	
  
•  Reac'on	
  vessels	
  are	
  heated	
  to	
  
approximately	
  80	
  C	
  to	
  ini'ate	
  pH	
  
shii	
  to	
  precipitate	
  Au(OH)3.	
  
•  Solu'ons	
  are	
  s'rred	
  for	
  
approximately	
  20	
  hours	
  to	
  allow	
  
‘Ostwald	
  Ripening’	
  par'cles.	
  
•  Reac'ons	
  conducted	
  under	
  low-­‐light	
  
condi'ons	
  to	
  block	
  uncontrolled	
  
photo-­‐reduc'on	
  of	
  Au3+.	
  
•  Gold	
  loading	
  %	
  determined	
  through	
  
atomic	
  emission	
  spectroscopy	
  (ICP).	
  
Electron	
  Microscopy	
  Measurement	
  
13	
  13	
  
0"
5"
10"
15"
20"
25"
30"
2" 3" 4" 5" 6" 7" 8" 9" 10"11"12"13"14"15"16"
Frequency)/)%)
Par.cle)Size)/)nm)
0"
5"
10"
15"
20"
25"
30"
35"
40"
2" 3" 4" 5" 6" 7" 8" 9" 10"11"12"13"14"15"16"
Frequency)/)%)
Par.cle)Size)/)nm)
9.5%	
  (w/w)	
  Au	
  /	
  TiO2	
   3.4%	
  (w/w)	
  Au	
  /	
  TiO2	
  
	
  =	
  Au	
  Par/cle	
  
125000x	
  Mag	
  
125000x	
  Mag	
  
100	
  nm	
  
100	
  nm	
  
Au/TiO2	
  Prepara/on	
  CO	
  Screening	
  
14	
  14	
  
15
10
5
0
IntegratedCO2PeaksArea(2395~2280cm
-1
)
800700600500400300200
Mean Sample Temperature (K)
Blank
4.0% Au/TiO2
6.4% Au/TiO2
6.6% Au/TiO2
8.2% Au/TiO2
9.5% Au/TiO2
8.6% Au/SiO2
2.6% Au/TiO2
3.4% Au/TiO2
4.4% Au/TiO2
5.4% Au/TiO2
6.6% Au/TiO2
7.4% Au/TiO2
5.9% Au/TiO2
8.6% Au/TiO2
10% Au/TiO2
10% Au/TiO2
11% Au/TiO2
15% Au/TiO2
12% Au/TiO2
Blacksburg Preparations
Pittsburgh
Preparation
Au/SiO2
Blank
Highest
Activity
Catalyst
(9.5% Au)
Lowest
Activity
Catalyst
(3.4% Au)
Au/P25	
  TiO2	
  Mul'-­‐Reactor	
  Results	
  
Prior	
  Au/P25	
  TiO2	
  
Prepara'on	
  (12%	
  Au)	
  
Au	
  Deposi/on	
  with	
  Aerogel	
  TiO2	
  
15	
  
Au	
  Deposi'on	
  on	
  Oxide	
  Par'cles	
   Aerogel	
  Deposi'on	
  of	
  Oxide	
  on	
  Au	
  
TiO2
TiO2
TiO2TiO2
TiO2
TiO2
TiO2
TiO2
Solution
Au(OH)3
Deposition
Au Particle
Reductive
Activation TiO2
TiO2
TiO2
TiO2
TiO2
TiO2
TiO2
TiO2
TiO2
TiO2
TiO2
TiO2
Au Particle
Preparation
Thiolate
Coating
Application
Sol-Gel
Application
of TiO2
Sintering Removal
of Thiolates and
TiO2 Crystallization
Why	
  This	
  Difference	
  MaZers	
  
16	
  
Thermal	
  migra'on	
  occurs	
  at	
  
300	
  ~	
  400	
  ∘C	
  and	
  is	
  promoted	
  
by	
  Cl-­‐	
  contamina'on.	
  
TiO2
Au
Decoration
(Active)
Au Aggregate
(Low Activity or Inactive)
Thermal
Migration
TiO2
TiO2
TiO2
TiO2
TiO2
TiO2
Au nanoparticles 'locked down' by
3-dimensional stabilization through
multiple Au - TiO2 interfaces.
2-Dimensional Au -TiO2 Au - Aerogel TiO2
Decorated	
  vs.	
  Aerogel	
  Au/TiO2	
  
17	
  17	
  
100
90
80
70
60
50
40
30
20
10
0
COConversion/%
400350300250200150100
Temperature / K
Decorated vs. Aerogel
Au/TiO2 Nanoparticles
Decorated Run A
Decorated Run B
Aerogel
HV	
  Chamber	
  Studies	
  
18	
  
High	
  Vacuum	
  Chamber	
  Apparatus	
  
19	
  
LN2 Cooled MCT
FTIR Detector
Interfacing
Optics
Nexus 470 FTIR
Pressure
Sensor
RGAQuadrupole
MassSpectrometer
View Port
Dosing
Jets
19	
  (Top	
  View	
  -­‐	
  Not	
  to	
  Scale)	
  
Sample	
  Mount	
  
To Vacuum
Pass-Through
and
High-Current
Power Supply
Blank (Empty)
Sample 1
Sample 2
Tungsten Mesh
Copper
Mesh
Clamps
K-Thermocouple
(Welded to Mesh)
10-­‐7	
  ~	
  10-­‐8	
  Torr	
  
Pneumatic
Gate Valve
Manual
Gate Valve
Chamber
Pump
Pump
Pressure
Sensor
Pressure
Sensor
( Side View )
TiO2	
  Thermal	
  O2	
  Condi/oning	
  	
  
20	
  
0.40
0.35
0.30
0.25
0.20
0.15
0.10
0.05
0.00
∆Absorbance
4000 3500 3000 2500 2000 1500 1000
Wavenumber / cm
-1
•  Following	
  60	
  minutes	
  of	
  O2	
  treatment	
  at	
  673	
  K,	
  the	
  
sample	
  is	
  cooled	
  slowly	
  to	
  300	
  K	
  and	
  the	
  O2	
  is	
  
evacuated.	
  
•  Nega've	
  deflec'ons	
  in	
  spectrum	
  are	
  the	
  result	
  of	
  
adsorbate	
  losses.	
  
Au	
  /	
  Aerogel	
  TiO2	
  (Post-­‐Treatment)	
  
Aerogel	
  TiO2	
  (Post	
  Treatment)	
  
Free	
  -­‐OH	
  
forma'on	
  
Organics	
  
Loss	
   H2O	
  
Loss	
   Carbonates	
  Loss	
  
21	
  
•  Range	
  of	
  energies	
  observed	
  in	
  mid-­‐IR	
  
range	
  span	
  approximately	
  0.45	
  eV.	
  
•  Distribu'on	
  of	
  CB	
  electrons	
  governed	
  
by	
  Fermi	
  probability	
  func'on	
  
•  Changes	
  in	
  CB	
  electron	
  popula'on	
  
and	
  intraband	
  transi'ons	
  observed	
  as	
  
broad	
  shii	
  in	
  infrared	
  baseline	
  
absorbance.	
  
IR	
  Spectroscopy	
  of	
  Electrons…	
  ?	
  
400 cm-1 / 0.05 eV
4000 cm-1
/ 0.5 eV
Ti 3+
shallow trap state
conduction band
0.3~0.4eV
FTIR spectrum
energy range
3.0 ~ 3.1 eV
conduction band
valence band
0.3 ~ 0.4 eV
Ti 3+
shallow trap state
FTIR spectrum
energy range
Egap
0.20
0.15
0.10
0.05
0.00
∆Absorbance
4000 3500 3000 2500 2000 1500 1000
Wavenumbers / cm
-1
313 K
673 K
f (E) =
1
1+ Exp
E − EF
kBT
⎡
⎣
⎢
⎤
⎦
⎥
Atomic	
  Hydrogen	
  n-­‐Doping	
  
22	
  
sociation on supported Au particles in the 2-3 nm diameter
ge has been studied at 295 K. It has been found that the
O2 is a sensitive detector for spillover-H atoms, where trapped
ctrons in shallow trap states near the bottom of the conduction
ure 8. Schematic diagram of the hydrogen spillover process,
cting electrons into shallow trap states near the bottom of the
duction band. The trapped electrons are then excited by IR photons
the conduction band where they are highly delocalized, producing
oad IR absorbance in the range 4000-1000 cm-1
.
J. Phys. Chem. C, Vol. 111, No. 7, 2007 2963
D.	
  Panayotov	
  and	
  J.	
  T.	
  Yates.	
  J	
  Phys	
  Chem	
  C,	
  2007	
  vol.	
  111	
  (7)	
  pp.	
  
2959-­‐2964	
  
•  Molecular	
  hydrogen	
  adsorbed	
  onto	
  Au	
  
nanopar'cles	
  dissociates	
  into	
  surface-­‐
adsorbed	
  atomic	
  hydrogen.	
  
•  Spillover	
  of	
  atomic	
  hydrogen	
  onto	
  the	
  TiO2	
  
support	
  surface	
  causes	
  popula'on	
  of	
  shallow	
  
trap	
  states	
  with	
  addi'onal	
  electrons.	
  
•  The	
  remaining	
  proton	
  (electron	
  hole)	
  diffuses	
  
into	
  the	
  TiO2	
  bulk.	
  
•  Shallow-­‐trapped	
  electrons	
  are	
  thermally	
  or	
  IR	
  
excited	
  into	
  the	
  TiO2	
  conduc'on	
  band	
  where	
  
they	
  are	
  detected	
  by	
  IR.	
  
•  Removal	
  of	
  gaseous	
  H2	
  pressure	
  reverses	
  this	
  
process.	
  
Au/TiO2	
  n-­‐Doping	
  (293	
  K)	
  
23	
  
0.08
0.07
0.06
0.05
0.04
0.03
0.02
0.01
0.00
∆Absorbance
4000 3500 3000 2500 2000 1500 1000
Wavenumber / cm
-1
170	
  minutes	
  
H2	
  exposure	
  
•  Sample	
  chamber	
  sealed	
  and	
  pressurized	
  to	
  1.4	
  Torr	
  with	
  
high-­‐purity	
  H2.	
  
•  Growth	
  of	
  peaks	
  at	
  1100	
  and	
  1600	
  cm-­‐1	
  apributed	
  to	
  
accumula'on	
  of	
  bicarbonate	
  and	
  molecular	
  water	
  from	
  
methoxy	
  surface	
  treatment	
  decomposi'on.	
  
•  Nega've	
  peak	
  at	
  3700	
  cm-­‐1	
  apributed	
  to	
  loss	
  of	
  free	
  -­‐OH	
  
due	
  to	
  adsorp'on	
  of	
  CO2	
  decomposi'on	
  product.	
  
•  H-­‐bonded	
  -­‐OH	
  growth	
  from	
  3600	
  -­‐	
  3500	
  cm-­‐1	
  noted.	
  
Au/TiO2	
  n-­‐Doping	
  (293	
  K)	
  
24	
  
0.08
0.07
0.06
0.05
0.04
0.03
0.02
0.01
0.00
∆Absorbance
4000 3500 3000 2500 2000 1500 1000
Wavenumber / cm
-1
50	
  minutes	
  
evacua'on	
  
•  Following	
  H2	
  exposure,	
  sample	
  chamber	
  gate	
  valves	
  
opened	
  and	
  pump	
  down	
  to	
  ~	
  1	
  x	
  10-­‐8	
  Torr	
  started.	
  
•  Diffusion	
  of	
  protons	
  from	
  TiO2	
  bulk	
  and	
  TiO2	
  conduc'on	
  
band	
  electrons	
  result	
  in	
  reforma'on	
  of	
  H2.	
  
•  Loss	
  of	
  TiO2	
  conduc'on	
  band	
  electrons	
  results	
  in	
  broad	
  
drop	
  of	
  baseline	
  absorbance.	
  
•  Accumulated	
  methoxy	
  residue	
  decomposi'on	
  products	
  
remain	
  on	
  surface.	
  
Au/TiO2	
  n-­‐Doping	
  (250	
  K)	
  
25	
  
0.08
0.07
0.06
0.05
0.04
0.03
0.02
0.01
0.00
∆Absorbance
4000 3500 3000 2500 2000 1500 1000
Wavenumber / cm
-1
•  Similar	
  baseline	
  absorbance	
  effects	
  noted	
  when	
  the	
  
sample	
  temperature	
  was	
  lowered	
  to	
  250	
  K	
  during	
  H2	
  
exposure	
  and	
  pump	
  off	
  removal.	
  
•  Because	
  this	
  experiment	
  followed	
  the	
  293	
  K	
  exposure,	
  
further	
  methoxy	
  decomposi'on	
  products	
  accumulate	
  on	
  
the	
  par'cle	
  surfaces.	
  
90	
  minutes	
  H2	
  
exposure	
  
Au/TiO2	
  n-­‐Doping	
  (250	
  K)	
  
26	
  
0.08
0.07
0.06
0.05
0.04
0.03
0.02
0.01
0.00
∆Absorbance
4000 3500 3000 2500 2000 1500 1000
Wavenumber / cm
-1
•  Similar	
  baseline	
  absorbance	
  effects	
  noted	
  when	
  the	
  
sample	
  temperature	
  was	
  lowered	
  to	
  250	
  K	
  during	
  H2	
  
exposure	
  and	
  pump	
  off	
  removal.	
  
•  Because	
  this	
  experiment	
  followed	
  the	
  293	
  K	
  exposure,	
  
further	
  methoxy	
  decomposi'on	
  products	
  accumulate	
  on	
  
the	
  par'cle	
  surfaces.	
  
40	
  minutes	
  
evacua'on	
  
Propene	
  Chemistry	
  on	
  Au/TiO2	
  
27	
  
•  Propene	
  has	
  been	
  observed	
  to	
  convert	
  to	
  acrolein	
  and	
  
propenal	
  as	
  intermediates	
  during	
  complete	
  oxida'on.1,2	
  
•  Propene	
  reported	
  to	
  undergo	
  hydrogena'on	
  or	
  oxida'on	
  in	
  
the	
  presence	
  of	
  Au/TiO2	
  nanopar'cles.3	
  
•  Hydrogena'on	
  selec'vity	
  reported	
  for	
  Au	
  >	
  4.5	
  nm	
  and	
  
oxida'on	
  for	
  smaller	
  Au	
  nanopar'cles.4	
  
•  Propene	
  oxide	
  produc'on	
  of	
  commercial	
  interest	
  due	
  to	
  
applica'on	
  as	
  a	
  polymer	
  feedstock.	
  
H2C	
   CH	
   CH3	
   H3C	
   CH2	
   CH3	
  
O	
  
H2C	
   CH	
   CH3	
  
Propene	
   Propane	
   Propene	
  Oxide	
  
H2C	
   CH	
   CH	
  
O	
  
H3C	
   CH2	
   CH	
  
O	
  
Acrolein	
   Propenal	
  
1Surface	
  Science,	
  2009	
  vol.	
  603	
  (7)	
  pp.	
  1010-­‐1017	
  
2J	
  Phys	
  Chem,	
  1971	
  vol.	
  75	
  pp.	
  2914-­‐2921	
  
3Journal	
  of	
  Catalysis,	
  2012	
  vol.	
  285	
  (1)	
  pp.	
  324-­‐327	
  
4J.	
  Gaudet,	
  K.K.	
  Bando,	
  Z.	
  Song,	
  T.	
  Fujitani,	
  W.	
  Zhang,	
  D.S.	
  Su,	
  and	
  S	
  T	
  Oyama	
  
Propene	
  and	
  H2	
  at	
  Au/TiO2	
  (123	
  K)	
  
28	
  
0.12
0.11
0.10
0.09
0.08
0.07
0.06
0.05
0.04
0.03
0.02
0.01
0.00
∆Absorbance
4000 3500 3000 2500 2000 1500 1000
Wavenumber / cm
-1
Reac/on	
  Condi/ons	
  
•  Nanopar'cles	
  exposed	
  to	
  H2	
  and	
  n-­‐doped.	
  
•  Chamber	
  evacuated	
  following	
  H2	
  exposure.	
  
•  Chamber	
  pressurized	
  to	
  1	
  Torr	
  with	
  propene.	
  
•  Sample	
  Temperature	
  maintained	
  at	
  123	
  K.	


5	
  min.	
  
8	
  min.	
  
13	
  min.	
  
17	
  min.	
  
Propene	
  on	
  Au	
  /	
  Aerogel	
  TiO2	
  (123	
  K)	
  
Propene	
  and	
  H2	
  at	
  Au/TiO2	
  (123	
  K)	
  
29	
  
0.12
0.11
0.10
0.09
0.08
0.07
0.06
0.05
0.04
0.03
0.02
0.01
0.00
∆Absorbance
4000 3500 3000 2500 2000 1500 1000
Wavenumber / cm
-1
5	
  min.	
  
8	
  min.	
  
13	
  min.	
  
17	
  min.	
  
10	
  min	
  
Propene	
  on	
  Aerogel	
  TiO2	
  (123	
  K)	
  
Gas-­‐Phase	
  Propene	
  
Propene	
  Adsorbate	
  Peaks	


υ(C=C)	
  at	
  1656,	
  1640	
  cm-­‐1	
  
δa(CH3)	
  at	
  1456	
  cm-­‐1	


Catalysis	
  Lepers,	
  2002	
  vol.	
  84	
  (3)	
  
pp.	
  143-­‐146	
   δa(CH3)	
  	
  
υ(C=C)	
  	
  
Propene	
  on	
  Au	
  /	
  Aerogel	
  TiO2	
  (123	
  K)	
  
Propene	
  and	
  H2	
  at	
  Au/TiO2	
  (123	
  K)	
  
30	
  
0.12
0.11
0.10
0.09
0.08
0.07
0.06
0.05
0.04
0.03
0.02
0.01
0.00
∆Absorbance
4000 3500 3000 2500 2000 1500 1000
Wavenumber / cm
-1
δa(CH3)	
  	
  
υ(C=C)	
  	
  
5	
  min.	
  
8	
  min.	
  
13	
  min.	
  
17	
  min.	
  
Propene	
  on	
  Aerogel	
  TiO2	
  (123	
  K)	
  
10	
  min	
  
50	
  min	
  
•  Iden'fied	
  propene	
  adsorbate	
  modes	
  
diminish	
  with	
  'me	
  on	
  both	
  TiO2	
  and	
  Au/
TiO2.	
  
•  CO	
  (ads)	
  and	
  CO2	
  (ads)	
  peaks	
  grow	
  on	
  both	
  
TiO2	
  and	
  Au/TiO2	
  with	
  length	
  of	
  exposure.	
  
•  Peak	
  at	
  2163	
  cm-­‐1	
  assigned	
  to	
  CO	
  on	
  
ca'onic	
  gold	
  (Auδ+)	
  and	
  2080	
  cm-­‐1	
  is	
  
assigned	
  to	
  CO	
  on	
  anionic	
  gold	
  (Auδ-­‐).	
  
CO2(ads)	
   CO(ads)	
  
CO(ads)	
  
CO	
  Auδ+	
  
CO	
  Auδ-­‐	
  
Propene	
  and	
  H2	
  at	
  Au/TiO2	
  (123	
  K)	
  
31	
  
0.12
0.11
0.10
0.09
0.08
0.07
0.06
0.05
0.04
0.03
0.02
0.01
0.00
∆Absorbance
4000 3500 3000 2500 2000 1500 1000
Wavenumber / cm
-1
5	
  min.	
  
8	
  min.	
  
13	
  min.	
  
17	
  min.	
  
Propene	
  on	
  Au	
  /	
  Aerogel	
  TiO2	
  (123	
  K)	
  
Methyl	
  Hydrogen	
  Abstrac/on	
  from	
  Propene	


Loss	
  of	
  methyl	
  bending	
  mode	
  at	
  1456	
  
cm-­‐1	
  and	
  methyl	
  stretches	
  from	
  2800	
  ~	
  
3200	
  cm-­‐1	
  caused	
  by	
  loss	
  of	
  methyl	
  
hydrogens.	


J	
  Phys	
  Chem,	
  1971	
  vol.	
  75	
  pp.	
  2914-­‐2921	
  
Catalysis	
  Lepers,	
  2002	
  vol.	
  84	
  (3)	
  pp.	
  143-­‐146	
  	
  
Propene	
  
Allyl	
  Ca'on	
  
H2C	
  
C	
  
H	
  
C	
  
H	
  
H	
  
H	
  
H2C	
  
C	
  
H	
  
CH2	
  
+	
  
H2C	
  
C	
  
H	
  
CH2	
  
+	
  
H2O	
  
Ti	
   O	
   Ti	
   O	
   Ti	
  Ti	
   O	
   Ti	
   O	
   Ti	
  
OH	
  
δa(CH3)	
  	
  
υa,s(CH3)	
  	
  
Propene	
  and	
  H2	
  at	
  Au/TiO2	
  (123	
  K)	
  
32	
  
0.12
0.11
0.10
0.09
0.08
0.07
0.06
0.05
0.04
0.03
0.02
0.01
0.00
∆Absorbance
4000 3500 3000 2500 2000 1500 1000
Wavenumber / cm
-1
5	
  min.	
  
8	
  min.	
  
13	
  min.	
  
17	
  min.	
  
Propene	
  on	
  Au	
  /	
  Aerogel	
  TiO2	
  (123	
  K)	
  
Resonance	
  Stabilized	
  Allyl	
  Ca/on	
  Reacts	
  with	
  TiO2	
  Bridge	
  Oxygens	


Allyl	
  Ca'on	
  
H2C	
  
C	
  
H	
  
CH2	
  
δ+	
   δ+	
  
Ti	
  Ti	
  
O	
  
Ti	
  
O	
  
Ti	
  
O	
  
Ti	
  Ti	
  
O	
  
Ti3+	
   Ti3+	
  
OH	
  
O	
  
H2C	
  
C	
  
H	
  
C	
   H	
  
Acrolein	
  
υ(C=O)	
  at	
  1715	
  cm-­‐1	
  is	
  assigned	
  to	
  
acrolein	
  produced	
  from	
  allyl.	
  	
  As	
  
propene	
  is	
  converted	
  to	
  acrolein	
  
this	
  peak	
  grows.	
  
υ(C=O)	
  
Acrolein	
  
Propene	
  and	
  H2	
  at	
  Au/TiO2	
  (123	
  K)	
  
33	
  
0.12
0.11
0.10
0.09
0.08
0.07
0.06
0.05
0.04
0.03
0.02
0.01
0.00
∆Absorbance
4000 3500 3000 2500 2000 1500 1000
Wavenumber / cm
-1
5	
  min.	
  
8	
  min.	
  
13	
  min.	
  
17	
  min.	
  
Propene	
  on	
  Au	
  /	
  Aerogel	
  TiO2	
  (123	
  K)	
  
Acrolein	
  Binds	
  at	
  Lewis	
  Acid	
  Sites	
  (Ti4+)	
  and	
  Reacts	
  with	
  Surface	
  -­‐OH	


Acrolein	
  
Hydroxyla'on	
  of	
  the	
  TiO2	
  surface	
  by	
  water	
  
reacts	
  with	
  acrolein	
  to	
  produce	
  propenal.	


υ(C=O)	
  at	
  1682	
  cm-­‐1	
  and	
  δa(CH3)	
  at	
  1349	
  
cm-­‐1	
  are	
  assigned	
  to	
  propenal.	


Surface	
  Science,	
  2009	
  vol.	
  603	
  (7)	
  pp.	
  1010-­‐1017	
  
Propenal	
  
Ti	
   O	
   Ti	
   O	
   Ti	
  
H2C	
  
C	
  
H	
  
C	
  
O	
  
H	
  
Ti	
   O	
   Ti	
   O	
   Ti	
  
O	
  
CH2	
  
H3C	
   C	
  
H	
  
OH	
  OH	
   O-­‐	
   O-­‐	
  
H2O	
  
υ(C=O)	
   Propenal	
  
Acrolein	
  
δa(CH3)	
  	
  
Propene	
  and	
  H2	
  at	
  Au/TiO2	
  (123	
  K)	
  
34	
  
0.12
0.11
0.10
0.09
0.08
0.07
0.06
0.05
0.04
0.03
0.02
0.01
0.00
∆Absorbance
4000 3500 3000 2500 2000 1500 1000
Wavenumber / cm
-1
5	
  min.	
  
8	
  min.	
  
13	
  min.	
  
17	
  min.	
  
Propene	
  on	
  Au	
  /	
  Aerogel	
  TiO2	
  (123	
  K)	
  
Adsorbed	
  Propenal	
  Reacts	
  with	
  Ladce	
  Oxygen	
  to	
  Yield	
  CO	
  and	
  CO2	


CO(g)	
  is	
  either	
  re-­‐adsorbed	
  to	
  the	
  
Au/TiO2	
  as	
  shown	
  earlier	
  or	
  spilled	
  
over	
  onto	
  the	
  adjacent	
  TiO2	
  
sample.	


CO2(g)	
  also	
  either	
  adsorbs	
  to	
  the	
  
Au/TiO2	
  as	
  carbonates	
  or	
  spills	
  
over	
  to	
  the	
  TiO2	
  sample.	
  
Propenal	
  
Ti	
   O	
   Ti	
   O	
   Ti	
  
O	
  
CH2	
  
H3C	
   C	
  
H	
  
Ti3+	
   Ti3+	
   Ti3+	
  
CO	
   CO2	
   H2O	
  
(Gaseous	
  and	
  Adsorbed)	
  
CO(ads)	
  
CO	
  Auδ+	
  
CO	
  Auδ-­‐	
  
CO2(ads)	
  
CO3
2-­‐
(ads)	
  
Summary	
  
•  A	
  variety	
  of	
  decorated	
  Au	
  /	
  Degussa	
  P25	
  TiO2	
  
were	
  prepared,	
  with	
  some	
  catalysts	
  
demonstra'ng	
  surprising	
  CO	
  oxida'on	
  ac'vity.	
  	
  
•  CO	
  oxida'on	
  screening	
  suggested	
  Aerogel	
  oxide	
  
supported	
  Au/TiO2	
  catalysts	
  are	
  less	
  ac've	
  than	
  
their	
  decorated	
  counterparts.	
  
•  Aerogel	
  supported	
  Au	
  catalysts	
  s'll	
  demonstrate	
  
high	
  ac'vity	
  for	
  H2	
  dissocia'on	
  and	
  propene	
  
oxida'on.	
  
35	
  
Future	
  Work	
  
•  Further	
  experimenta'on	
  with	
  condi'ons	
  to	
  
op'mize	
  decorated	
  Au/TiO2	
  catalysts.	
  
•  Study	
  condi'ons	
  (if	
  any)	
  that	
  can	
  cause	
  
Aerogel	
  Au/TiO2	
  catalysts	
  to	
  selec'vely	
  
epoxidize	
  propene.	
  
•  Beper	
  understand	
  mechanisms	
  for	
  propene	
  
oxida'on	
  and	
  epoxida'on	
  on	
  both	
  decorated	
  
and	
  Aerogel	
  Au/TiO2	
  catalysts.	
  
36	
  
Acknowledgements	
  
•  Prof.	
  John	
  R.	
  Morris	
  
•  Commipee	
  Members	
  
–  Prof.	
  Brian	
  M.	
  Tissue	
  
–  Prof.	
  Karen	
  J.	
  Brewer	
  
–  Prof.	
  Sungsool	
  Wi	
  
•  Kathy	
  Lowe	
  (Veterinary	
  School)	
  
•  Leslie	
  Owen	
  
•  Drs.	
  Jeremy	
  Pietron	
  and	
  Debra	
  Rolison	
  
(Naval	
  Research	
  Laboratories)	
  
•  Army	
  Research	
  Office	
  
•  Members	
  of	
  the	
  Morris	
  Research	
  Group	


37	
  
Acknowledgements	
  
•  Prof.	
  John	
  R.	
  Morris	
  
•  Commipee	
  Members	
  
–  Prof.	
  Brian	
  M.	
  Tissue	
  
–  Prof.	
  Karen	
  J.	
  Brewer	
  
–  Prof.	
  Sungsool	
  Wi	
  
•  Kathy	
  Lowe	
  (Veterinary	
  School)	
  
•  Leslie	
  Owen	
  
•  Drs.	
  Jeremy	
  Pietron	
  and	
  Debra	
  Rolison	
  
(Naval	
  Research	
  Laboratories)	
  
•  Army	
  Research	
  Office	
  
•  Members	
  of	
  the	
  Morris	
  Research	
  Group	
  
–  Dr.	
  Dimitar	
  Panayotov	
  (a.k.a.	
  Mitko)	
  
38	
  
39	
  
Ques/ons	
  ?	
  
40	
  
Suppor/ng	
  
Informa/on	
  
FTIR	
  Flow	
  Cell	
  Experiments	
  
41	
  41	
  
Nanopar'cle	
  
sample	
  pressed	
  
into	
  tungsten	
  
mesh	
  
CO	
  Screening:	
  Linear	
  Flow	
  Tube	
  
42	
  42	
  
6 mm Soft Glass Tube Nanoparticle Film
Type K Thermocouple
1/4 - 1/8" OD
Steel Tube Union
Ceramic Coating
Nichrome
Heating
Element
Aluminum
Tube
Cast Aluminum Enclosure
Reactor Heater
Nanoparticle Screening Tube
•  Mixture	
  of	
  7:1	
  molar	
  ra'o	
  O2:CO	
  passed	
  
through	
  sample	
  tube.	
  
•  Sample	
  tube	
  temperature	
  varied	
  from	
  200	
  
to	
  600K.	
  
•  IR	
  spectra	
  recorded	
  from	
  2600	
  ~1800	
  cm-­‐1.	
  	
  
•  CO2	
  peaks	
  integrated	
  from	
  2395	
  -­‐	
  2280	
  
cm-­‐1.	
  
Examples	
  of	
  CO	
  Screening	
  Tubes	
  (Au/TiO2)	
  
Sample	
  Stage	
  Posi/oning	
  Precision	
  
43	
  43	
  
0.25
0.20
0.15
0.10
0.05
0.00
∆Absorbance
4000 3000 2000 1000
Wavenumber / cm
-1
Z = 14.46 mm
10 Spectra
RSD = 0.27% @ 2602 cm
-1
Z = 23.42 mm
10 Spectra
RSD = 0.25% @ 2602 cm
-1
9.5% (w/w) Au / TiO2
3.4% (w/w) Au / TiO2
S 0
S 1
S 2
FTIR HeNe
Laser Reflection
Z = 0 mm
Z = 14.16 mm
Z = 23.42 mm
Z-AxisTranslation
Au	
  Deposi/on	
  in	
  Progress…	
  
44	
  44	
  
S'rrer	
  Motors	
  
Reflux	
  Air	
  Cooling	
  
Reac'on	
  
Tubes	
  (6)	
  
Heated	
  Sand	
  Bath	
  
S'rrer	
  Controller	
  
Thermocouple	
  
Well	
  
PTFE	
  S'r	
  Vane	
  
Post	
  Au	
  Deposi/on	
  Processing	
  
45	
  45	
  
•  Nanopar'cles	
  transferred	
  
to	
  centrifuge	
  tubes.	
  
•  Centrifuge	
  and	
  rinse	
  un'l	
  
AgNO3	
  test	
  shows	
  no	
  Cl-­‐	
  
present	
  (~8	
  rinses).	
  
•  Rinsed	
  nanopar'cles	
  air	
  
dried.	
  
•  All	
  processing	
  opera'ons	
  
must	
  be	
  conducted	
  under	
  
darkroom	
  condi'ons.	
  
•  Au(OH)3	
  reduced	
  to	
  Au0	
  
immediately	
  prior	
  to	
  use.	


Au	
  Assay	
  by	
  Atomic	
  Spectroscopy	
  
46	
  46	
  
‘Wet’	
  Au(OH3)	
  on	
  TiO2	
  
Reduced	
  Au0	
  on	
  TiO2	
  
Au0	
  Dissolu'on	
  
in	
  HNO3	
  /	
  HCl	
  
Heated	
  Acid	
  Diges'on	
  of	
  Au0	
  
ICP-­‐AES	
  Analyses	
  
2-­‐Channel	
  Gas	
  Flow	
  Cell	
  
47	
  47	
  
N2	
  Purged	
  
Flexible	
  
Op'cal	
  Paths	
  
X-­‐Y	
  Transla'on	
  
Stage	
  
M
M
M
He O2 CO
Vent 1
Vent 2
Needle
Valve
Micrometer
Needle
Valve
NeedleValve
Rotometer
Low-Flow
Rotometer
Gas Flow
Splitter
Gas Flow
Splitter
F
B
FTIR
2-Channel
Flow Cell
Catalyst Screening Tube
Vent 3
Total Flow
180 mL/min
Total Flow
28 mL/min
Gas	
  Mixing	
  /	
  SpliTng	
  Manifold	
  
Screening	
  Tube	
  Temperature	
  Control	
  
48	
  48	
  
Catalyst	
  Screening	
  Tube	
  
Heaters	
  
Gas	
  Flow	
  
Subambient	
  
Temperatures	
  
Enclosure	
  
LN2	
  Fill	
  
Bulb	
  -­‐	
  Type	
  Screening	
  Tubes	
  
49	
  49	
  
K-Thermocouple
Junction
6 mm OD
Tubing
2 cm OD Bulb
Glass Wool
Packing
Gas Expansion Zone
•  Original	
  screening	
  tubes	
  
were	
  ‘wet-­‐coated’	
  along	
  
en're	
  length.	
  
•  Bulb	
  modifica'on	
  tubes	
  
concentrate	
  nanopar'cles	
  
in	
  gas	
  expansion	
  zone.	
  
•  Nanopar'cles	
  applied	
  dry	
  
to	
  glass	
  wool.	
  
•  Bulb	
  and	
  glass	
  wool	
  packing	
  
promote	
  gas	
  turbulence,	
  
mixing,	
  and	
  contact	
  with	
  
nanopar'cle	
  sample.	
  
HV	
  Chamber	
  Upgrades	
  
50	
  
Corrugated Steel Flex Line
(Swagelok Tube Fittings)
Corrugated Steel Flex Line
( VCR Female Fittings)
Male - Male
VCR Union
VCR to
Swagelok
Union
VCR-FVCR-F
SS-4BK-VS1
VCR-FVCR-F
SS-4BK-VS1
VCR to
Swagelok
Union
VCR to
Swagelok
Union
Swagelok
Tee Fitting
Swagelok
Tee Fitting
SS-4H
Glass-to-Metal
Simulant Bulb
SS-4H
Glass-to-Metal
Simulant Bulb
SS-4H
Swagelok
Tee Fitting
SS-4H
Swagelok
to VCR-F
Weldment
PBaratron Sensor
SS-4H
Glass-to-Metal
Simulant Bulb
VCR to
Swagelok
Union
VCR-FVCR-F
SS-4BK-VS1
Swagelok
SS-4CS
Mini Cylinder
SS-4H
Swagelok
1/4 - 1/8
Reduncing
Union
1/8" Line from Gas
Mixing Manifold
To Vacuum Pump
Vacuum
Chamber
Manifold
Plate
Gas	
  Dosing	
  Manifold	
  
and	
  Pressure	
  Monitoring	
  
Vacuum	
  Gate	
  Valves	
  
Pneuma/cs	
  
Pneumatic
Gate Valve
Manual
Gate Valve
Chamber
Pump
Pump
Pressure
Sensor
Pressure
Sensor
( Side View )
HV	
  Chamber	
  Upgrades	
  
51	
  
Detector	
  Op'cs	
  FTIR	
  Source	
  Op'cs	
  
IR	
  Op/cs	
  
IR	
  Beam	
  Flag	
  
HV	
  Chamber	
  Upgrades	
  
52	
  Sample	
  Temperature	
  Control	
  
Soiware-­‐Controlled	
  Resis've	
  	
  Hea'ng	
  	
  
LN2	
  Chamber/
Sample	
  Cooling	
  
Au/TiO2	
  Methanol	
  Treatment	
  
53	
  
0.80
0.75
0.70
0.65
0.60
0.55
0.50
0.45
0.40
0.35
0.30
0.25
0.20
0.15
0.10
0.05
0.00
∆Absorbance
4000 3500 3000 2500 2000 1500 1000
Wavenumber / cm
-1
20	
  min.	
  
40	
  min.	
  
50	
  min.	
  
75	
  min.	
  
170	
  min.	
  
200	
  min.	
  
220	
  min.	
  
1300	
  to	
  1150	
  cm-­‐1:	
  
adsorbed	
  carbonates	
  
3900	
  cm-­‐1:	
  free	
  -­‐OH	
  loss	
  
Propene	
  Gas-­‐Phase	
  Spectrum	
  
54	
  
5.00
4.00
3.00
2.00
1.00
0.00
∆Absorbance
3500 3000 2500 2000 1500 1000
Wavenumber / cm
-1
NIST	
  Reference	
  Spectrum	
  
Quartz	
  Flow	
  Cell	
  Spectrum	
  
Gas-­‐Phase	
  Propene	
  in	
  Vacuum	
  Chamber	
  
55	
  
0.01
0.00
∆Absorbance
4000 3500 3000 2500 2000 1500 1000
Wavenumber / cm
-1
Gaseous	
  CO	
  
Gaseous	
  Propene	
  Features	
  
0.9	
  Torr	
  
1.4	
  Torr	
  
No	
  Propylene	
  (Baseline	
  W-­‐Mesh	
  Spectrum)	
  
T	
  =	
  293	
  K	
  
TiO2	
  Methanol	
  Treatment	
  
56	
  
0.80
0.75
0.70
0.65
0.60
0.55
0.50
0.45
0.40
0.35
0.30
0.25
0.20
0.15
0.10
0.05
0.00
∆Absorbance
4000 3500 3000 2500 2000 1500 1000
Wavenumber / cm
-1
8	
  min.	
  
20	
  min.	
  
30	
  min.	
  
50	
  min.	
  
70	
  min.	
  
170	
  min.	
  
200	
  min.	
  
220	
  min.	
  
Propene	
  and	
  H2	
  at	
  Au/TiO2	
  (293	
  K)	
  
57	
  
0.25
0.20
0.15
0.10
0.05
0.00
∆Absorbance
4000 3500 3000 2500 2000 1500 1000
Wavenumber / cm
-1
10	
  min.	
  
20	
  min.	
  
30	
  min.	
  
40	
  min.	
  
50	
  min.	
  
60	
  min.	
  
70	
  min.	
  
80	
  min.	
  
90	
  min.	
  
1170	
  cm-­‐1:	
  adsorbed	
  
bicarbonate	
  1590	
  cm-­‐1:	
  adsorbed	
  
molecular	
  H2O	
  
loss	
  of	
  -­‐CH3	
  
stretches	
   CO	
  on	
  Au	
  ?	
  

More Related Content

What's hot

S160016 anushri surbhi_iitk
S160016 anushri surbhi_iitkS160016 anushri surbhi_iitk
S160016 anushri surbhi_iitkAnushri Surbhi
 
Synthesis and Structural Investigations of Ag-Added
Synthesis and Structural Investigations of Ag-AddedSynthesis and Structural Investigations of Ag-Added
Synthesis and Structural Investigations of Ag-Addedsaad yakout
 
Rebak GE EPRI AFC Florida 2015 02 17
Rebak GE EPRI AFC Florida 2015 02 17Rebak GE EPRI AFC Florida 2015 02 17
Rebak GE EPRI AFC Florida 2015 02 17Raul Rebak
 
Atomic Layer Depostion , 7th Jan 2014
Atomic Layer Depostion , 7th Jan 2014Atomic Layer Depostion , 7th Jan 2014
Atomic Layer Depostion , 7th Jan 2014Chinmayananda Gouda
 
Au-Pd Supported on 3D Hybrid Strontium-Substituted Lanthanum Manganite Perovs...
Au-Pd Supported on 3D Hybrid Strontium-Substituted Lanthanum Manganite Perovs...Au-Pd Supported on 3D Hybrid Strontium-Substituted Lanthanum Manganite Perovs...
Au-Pd Supported on 3D Hybrid Strontium-Substituted Lanthanum Manganite Perovs...Hamid Arandiyan
 
The Controlled Disassembly of Mesostructured Perovskites
The Controlled Disassembly of Mesostructured Perovskites The Controlled Disassembly of Mesostructured Perovskites
The Controlled Disassembly of Mesostructured Perovskites Hamid Arandiyan
 
Meso-Molding Three-Dimensional Macroporous Perovskites
Meso-Molding Three-Dimensional Macroporous PerovskitesMeso-Molding Three-Dimensional Macroporous Perovskites
Meso-Molding Three-Dimensional Macroporous PerovskitesHamid Arandiyan
 
Synthesis and Characterization of Au-Zn Implants in Sapphire
Synthesis and Characterization of Au-Zn Implants in SapphireSynthesis and Characterization of Au-Zn Implants in Sapphire
Synthesis and Characterization of Au-Zn Implants in SapphireDaniel Scott
 
Dye-sensitized and Perovskite Solar Cells | Peter Holliman, University of Bangor
Dye-sensitized and Perovskite Solar Cells | Peter Holliman, University of BangorDye-sensitized and Perovskite Solar Cells | Peter Holliman, University of Bangor
Dye-sensitized and Perovskite Solar Cells | Peter Holliman, University of Bangorcdtpv
 
EuroCVD-16-2007_Puurunen
EuroCVD-16-2007_PuurunenEuroCVD-16-2007_Puurunen
EuroCVD-16-2007_PuurunenRiikka Puurunen
 
Influence of La3+ substitution on dielectric, ferroelectric and electrocalori...
Influence of La3+ substitution on dielectric, ferroelectric and electrocalori...Influence of La3+ substitution on dielectric, ferroelectric and electrocalori...
Influence of La3+ substitution on dielectric, ferroelectric and electrocalori...Mohammad Azam
 
Biopolymer based nanomaterials as potential biosorbents for toxic metal ions
Biopolymer based nanomaterials as potential biosorbents for toxic metal ionsBiopolymer based nanomaterials as potential biosorbents for toxic metal ions
Biopolymer based nanomaterials as potential biosorbents for toxic metal ionsAlexander Decker
 
Effect of Annealing on the Structural and Optical Properties of Nanostr...
Effect of Annealing on the Structural and       Optical Properties of Nanostr...Effect of Annealing on the Structural and       Optical Properties of Nanostr...
Effect of Annealing on the Structural and Optical Properties of Nanostr...sarmad
 
Physica b 08
Physica b 08Physica b 08
Physica b 08aman2395
 
Gel Growth and Characterization of New PbHNSO3 Crystals
Gel Growth and Characterization of New PbHNSO3 CrystalsGel Growth and Characterization of New PbHNSO3 Crystals
Gel Growth and Characterization of New PbHNSO3 CrystalsIRJET Journal
 

What's hot (19)

S160016 anushri surbhi_iitk
S160016 anushri surbhi_iitkS160016 anushri surbhi_iitk
S160016 anushri surbhi_iitk
 
Synthesis and Structural Investigations of Ag-Added
Synthesis and Structural Investigations of Ag-AddedSynthesis and Structural Investigations of Ag-Added
Synthesis and Structural Investigations of Ag-Added
 
Rebak GE EPRI AFC Florida 2015 02 17
Rebak GE EPRI AFC Florida 2015 02 17Rebak GE EPRI AFC Florida 2015 02 17
Rebak GE EPRI AFC Florida 2015 02 17
 
Atomic Layer Depostion , 7th Jan 2014
Atomic Layer Depostion , 7th Jan 2014Atomic Layer Depostion , 7th Jan 2014
Atomic Layer Depostion , 7th Jan 2014
 
Comparative study on structure, corrosion and hardness of Zn-Ni alloy
Comparative study on structure, corrosion and hardness of Zn-Ni alloyComparative study on structure, corrosion and hardness of Zn-Ni alloy
Comparative study on structure, corrosion and hardness of Zn-Ni alloy
 
Au-Pd Supported on 3D Hybrid Strontium-Substituted Lanthanum Manganite Perovs...
Au-Pd Supported on 3D Hybrid Strontium-Substituted Lanthanum Manganite Perovs...Au-Pd Supported on 3D Hybrid Strontium-Substituted Lanthanum Manganite Perovs...
Au-Pd Supported on 3D Hybrid Strontium-Substituted Lanthanum Manganite Perovs...
 
The Controlled Disassembly of Mesostructured Perovskites
The Controlled Disassembly of Mesostructured Perovskites The Controlled Disassembly of Mesostructured Perovskites
The Controlled Disassembly of Mesostructured Perovskites
 
Meso-Molding Three-Dimensional Macroporous Perovskites
Meso-Molding Three-Dimensional Macroporous PerovskitesMeso-Molding Three-Dimensional Macroporous Perovskites
Meso-Molding Three-Dimensional Macroporous Perovskites
 
Synthesis and Characterization of Au-Zn Implants in Sapphire
Synthesis and Characterization of Au-Zn Implants in SapphireSynthesis and Characterization of Au-Zn Implants in Sapphire
Synthesis and Characterization of Au-Zn Implants in Sapphire
 
Dye-sensitized and Perovskite Solar Cells | Peter Holliman, University of Bangor
Dye-sensitized and Perovskite Solar Cells | Peter Holliman, University of BangorDye-sensitized and Perovskite Solar Cells | Peter Holliman, University of Bangor
Dye-sensitized and Perovskite Solar Cells | Peter Holliman, University of Bangor
 
EuroCVD-16-2007_Puurunen
EuroCVD-16-2007_PuurunenEuroCVD-16-2007_Puurunen
EuroCVD-16-2007_Puurunen
 
Influence of La3+ substitution on dielectric, ferroelectric and electrocalori...
Influence of La3+ substitution on dielectric, ferroelectric and electrocalori...Influence of La3+ substitution on dielectric, ferroelectric and electrocalori...
Influence of La3+ substitution on dielectric, ferroelectric and electrocalori...
 
RESEARCH PAPER
RESEARCH PAPERRESEARCH PAPER
RESEARCH PAPER
 
Biopolymer based nanomaterials as potential biosorbents for toxic metal ions
Biopolymer based nanomaterials as potential biosorbents for toxic metal ionsBiopolymer based nanomaterials as potential biosorbents for toxic metal ions
Biopolymer based nanomaterials as potential biosorbents for toxic metal ions
 
Effect of Annealing on the Structural and Optical Properties of Nanostr...
Effect of Annealing on the Structural and       Optical Properties of Nanostr...Effect of Annealing on the Structural and       Optical Properties of Nanostr...
Effect of Annealing on the Structural and Optical Properties of Nanostr...
 
Physica b 08
Physica b 08Physica b 08
Physica b 08
 
Fabrication of Nanomaterials by Chemical Route: An Overview
Fabrication of Nanomaterials by Chemical Route: An OverviewFabrication of Nanomaterials by Chemical Route: An Overview
Fabrication of Nanomaterials by Chemical Route: An Overview
 
Gel Growth and Characterization of New PbHNSO3 Crystals
Gel Growth and Characterization of New PbHNSO3 CrystalsGel Growth and Characterization of New PbHNSO3 Crystals
Gel Growth and Characterization of New PbHNSO3 Crystals
 
KC-AtmoPlasmaProcR&D(csnb)140607
KC-AtmoPlasmaProcR&D(csnb)140607KC-AtmoPlasmaProcR&D(csnb)140607
KC-AtmoPlasmaProcR&D(csnb)140607
 

Viewers also liked

Sociedad del conocimiento
Sociedad del conocimientoSociedad del conocimiento
Sociedad del conocimientoCarmen Espinosa
 
Como Poner una Presentacion Power Point en tu Blog
Como Poner una Presentacion Power Point en tu BlogComo Poner una Presentacion Power Point en tu Blog
Como Poner una Presentacion Power Point en tu Blogpucca_maiden
 
Tutorial como subir a Slideshare
Tutorial como subir a SlideshareTutorial como subir a Slideshare
Tutorial como subir a Slidesharebambooflexible
 
A Guide to SlideShare Analytics - Excerpts from Hubspot's Step by Step Guide ...
A Guide to SlideShare Analytics - Excerpts from Hubspot's Step by Step Guide ...A Guide to SlideShare Analytics - Excerpts from Hubspot's Step by Step Guide ...
A Guide to SlideShare Analytics - Excerpts from Hubspot's Step by Step Guide ...SlideShare
 
How to Make Awesome SlideShares: Tips & Tricks
How to Make Awesome SlideShares: Tips & TricksHow to Make Awesome SlideShares: Tips & Tricks
How to Make Awesome SlideShares: Tips & TricksSlideShare
 
Getting Started With SlideShare
Getting Started With SlideShareGetting Started With SlideShare
Getting Started With SlideShareSlideShare
 

Viewers also liked (9)

Sociedad del conocimiento
Sociedad del conocimientoSociedad del conocimiento
Sociedad del conocimiento
 
Como Poner una Presentacion Power Point en tu Blog
Como Poner una Presentacion Power Point en tu BlogComo Poner una Presentacion Power Point en tu Blog
Como Poner una Presentacion Power Point en tu Blog
 
Tutorial como subir a Slideshare
Tutorial como subir a SlideshareTutorial como subir a Slideshare
Tutorial como subir a Slideshare
 
Solución de problemas
Solución de problemasSolución de problemas
Solución de problemas
 
Solución de problemas
Solución de problemasSolución de problemas
Solución de problemas
 
Solución de problemas
Solución de problemasSolución de problemas
Solución de problemas
 
A Guide to SlideShare Analytics - Excerpts from Hubspot's Step by Step Guide ...
A Guide to SlideShare Analytics - Excerpts from Hubspot's Step by Step Guide ...A Guide to SlideShare Analytics - Excerpts from Hubspot's Step by Step Guide ...
A Guide to SlideShare Analytics - Excerpts from Hubspot's Step by Step Guide ...
 
How to Make Awesome SlideShares: Tips & Tricks
How to Make Awesome SlideShares: Tips & TricksHow to Make Awesome SlideShares: Tips & Tricks
How to Make Awesome SlideShares: Tips & Tricks
 
Getting Started With SlideShare
Getting Started With SlideShareGetting Started With SlideShare
Getting Started With SlideShare
 

Similar to Talk 3_0

Thin Film and Nanowires of Transparent Conducting Oxides for Chemical Gas Sen...
Thin Film and Nanowires of Transparent Conducting Oxides for Chemical Gas Sen...Thin Film and Nanowires of Transparent Conducting Oxides for Chemical Gas Sen...
Thin Film and Nanowires of Transparent Conducting Oxides for Chemical Gas Sen...Raj Kumar, PhD
 
Awais Thesis Final Defense ppt updated.pptx
Awais Thesis Final Defense ppt updated.pptxAwais Thesis Final Defense ppt updated.pptx
Awais Thesis Final Defense ppt updated.pptxNaseem89
 
Synthesis, characterization and electrocatalytic activity of silver nanorods ...
Synthesis, characterization and electrocatalytic activity of silver nanorods ...Synthesis, characterization and electrocatalytic activity of silver nanorods ...
Synthesis, characterization and electrocatalytic activity of silver nanorods ...madlovescience
 
Synthesis, characterization and electrocatalytic activity of silver nanorods ...
Synthesis, characterization and electrocatalytic activity of silver nanorods ...Synthesis, characterization and electrocatalytic activity of silver nanorods ...
Synthesis, characterization and electrocatalytic activity of silver nanorods ...tshankar20134
 
Preparation of Au-Ag composite Nanoparticles by Pulsed Laser Ablation in Wate...
Preparation of Au-Ag composite Nanoparticles by Pulsed Laser Ablation in Wate...Preparation of Au-Ag composite Nanoparticles by Pulsed Laser Ablation in Wate...
Preparation of Au-Ag composite Nanoparticles by Pulsed Laser Ablation in Wate...IOSRJAC
 
Atomic Layer Deposition: a process technology for transparent conducting oxides
Atomic Layer Deposition: a process technology for transparent conducting oxidesAtomic Layer Deposition: a process technology for transparent conducting oxides
Atomic Layer Deposition: a process technology for transparent conducting oxidescdtpv
 
Synthesis and Characterisation of Copper Oxide nanoparticles
Synthesis and Characterisation of Copper Oxide nanoparticlesSynthesis and Characterisation of Copper Oxide nanoparticles
Synthesis and Characterisation of Copper Oxide nanoparticlesIOSR Journals
 
A facile method to prepare CdO-Mn3O4 nanocomposite
A facile method to prepare CdO-Mn3O4 nanocompositeA facile method to prepare CdO-Mn3O4 nanocomposite
A facile method to prepare CdO-Mn3O4 nanocompositeIOSR Journals
 
Homogenous pathway.pdf
Homogenous pathway.pdfHomogenous pathway.pdf
Homogenous pathway.pdfRavi Teja
 
Carbon corrosion and platinum nanoparticles ripening under open circuit poten...
Carbon corrosion and platinum nanoparticles ripening under open circuit poten...Carbon corrosion and platinum nanoparticles ripening under open circuit poten...
Carbon corrosion and platinum nanoparticles ripening under open circuit poten...LandimarMendesDuarte
 
10.1117@12.622198
10.1117@12.62219810.1117@12.622198
10.1117@12.622198stoph89
 
Synthesis and Characterization Studies of Solvothermally Synthesized Undoped ...
Synthesis and Characterization Studies of Solvothermally Synthesized Undoped ...Synthesis and Characterization Studies of Solvothermally Synthesized Undoped ...
Synthesis and Characterization Studies of Solvothermally Synthesized Undoped ...IJERA Editor
 
Size control of Nanoparticles
Size control of NanoparticlesSize control of Nanoparticles
Size control of NanoparticlesOscar1Miranda2
 
Size control of Nanoparticles
Size control of NanoparticlesSize control of Nanoparticles
Size control of NanoparticlesOscar1Miranda2
 
The Effect of Size of the CuO Nanoleaves on the Sunlight Driven Photocatalyti...
The Effect of Size of the CuO Nanoleaves on the Sunlight Driven Photocatalyti...The Effect of Size of the CuO Nanoleaves on the Sunlight Driven Photocatalyti...
The Effect of Size of the CuO Nanoleaves on the Sunlight Driven Photocatalyti...IRJET Journal
 
Surfactant-assisted Hydrothermal Synthesis of Ceria-Zirconia Nanostructured M...
Surfactant-assisted Hydrothermal Synthesis of Ceria-Zirconia Nanostructured M...Surfactant-assisted Hydrothermal Synthesis of Ceria-Zirconia Nanostructured M...
Surfactant-assisted Hydrothermal Synthesis of Ceria-Zirconia Nanostructured M...IOSR Journals
 

Similar to Talk 3_0 (20)

Thin Film and Nanowires of Transparent Conducting Oxides for Chemical Gas Sen...
Thin Film and Nanowires of Transparent Conducting Oxides for Chemical Gas Sen...Thin Film and Nanowires of Transparent Conducting Oxides for Chemical Gas Sen...
Thin Film and Nanowires of Transparent Conducting Oxides for Chemical Gas Sen...
 
Awais Thesis Final Defense ppt updated.pptx
Awais Thesis Final Defense ppt updated.pptxAwais Thesis Final Defense ppt updated.pptx
Awais Thesis Final Defense ppt updated.pptx
 
Synthesis, characterization and electrocatalytic activity of silver nanorods ...
Synthesis, characterization and electrocatalytic activity of silver nanorods ...Synthesis, characterization and electrocatalytic activity of silver nanorods ...
Synthesis, characterization and electrocatalytic activity of silver nanorods ...
 
Synthesis, characterization and electrocatalytic activity of silver nanorods ...
Synthesis, characterization and electrocatalytic activity of silver nanorods ...Synthesis, characterization and electrocatalytic activity of silver nanorods ...
Synthesis, characterization and electrocatalytic activity of silver nanorods ...
 
Preparation of Au-Ag composite Nanoparticles by Pulsed Laser Ablation in Wate...
Preparation of Au-Ag composite Nanoparticles by Pulsed Laser Ablation in Wate...Preparation of Au-Ag composite Nanoparticles by Pulsed Laser Ablation in Wate...
Preparation of Au-Ag composite Nanoparticles by Pulsed Laser Ablation in Wate...
 
Atomic Layer Deposition: a process technology for transparent conducting oxides
Atomic Layer Deposition: a process technology for transparent conducting oxidesAtomic Layer Deposition: a process technology for transparent conducting oxides
Atomic Layer Deposition: a process technology for transparent conducting oxides
 
Synthesis and Characterisation of Copper Oxide nanoparticles
Synthesis and Characterisation of Copper Oxide nanoparticlesSynthesis and Characterisation of Copper Oxide nanoparticles
Synthesis and Characterisation of Copper Oxide nanoparticles
 
A facile method to prepare CdO-Mn3O4 nanocomposite
A facile method to prepare CdO-Mn3O4 nanocompositeA facile method to prepare CdO-Mn3O4 nanocomposite
A facile method to prepare CdO-Mn3O4 nanocomposite
 
Homogenous pathway.pdf
Homogenous pathway.pdfHomogenous pathway.pdf
Homogenous pathway.pdf
 
Carbon corrosion and platinum nanoparticles ripening under open circuit poten...
Carbon corrosion and platinum nanoparticles ripening under open circuit poten...Carbon corrosion and platinum nanoparticles ripening under open circuit poten...
Carbon corrosion and platinum nanoparticles ripening under open circuit poten...
 
10.1117@12.622198
10.1117@12.62219810.1117@12.622198
10.1117@12.622198
 
10.1007_s12633-015-9356-x
10.1007_s12633-015-9356-x10.1007_s12633-015-9356-x
10.1007_s12633-015-9356-x
 
239 paramjyot
239 paramjyot239 paramjyot
239 paramjyot
 
Synthesis and Characterization Studies of Solvothermally Synthesized Undoped ...
Synthesis and Characterization Studies of Solvothermally Synthesized Undoped ...Synthesis and Characterization Studies of Solvothermally Synthesized Undoped ...
Synthesis and Characterization Studies of Solvothermally Synthesized Undoped ...
 
ELECTRODEPOSITION OF SILVER NANOPARTICLES ON CARBON SPHERE SURFACES BY PULSE ...
ELECTRODEPOSITION OF SILVER NANOPARTICLES ON CARBON SPHERE SURFACES BY PULSE ...ELECTRODEPOSITION OF SILVER NANOPARTICLES ON CARBON SPHERE SURFACES BY PULSE ...
ELECTRODEPOSITION OF SILVER NANOPARTICLES ON CARBON SPHERE SURFACES BY PULSE ...
 
Size control of Nanoparticles
Size control of NanoparticlesSize control of Nanoparticles
Size control of Nanoparticles
 
Size control of Nanoparticles
Size control of NanoparticlesSize control of Nanoparticles
Size control of Nanoparticles
 
The Effect of Size of the CuO Nanoleaves on the Sunlight Driven Photocatalyti...
The Effect of Size of the CuO Nanoleaves on the Sunlight Driven Photocatalyti...The Effect of Size of the CuO Nanoleaves on the Sunlight Driven Photocatalyti...
The Effect of Size of the CuO Nanoleaves on the Sunlight Driven Photocatalyti...
 
Surfactant-assisted Hydrothermal Synthesis of Ceria-Zirconia Nanostructured M...
Surfactant-assisted Hydrothermal Synthesis of Ceria-Zirconia Nanostructured M...Surfactant-assisted Hydrothermal Synthesis of Ceria-Zirconia Nanostructured M...
Surfactant-assisted Hydrothermal Synthesis of Ceria-Zirconia Nanostructured M...
 
X4101144147
X4101144147X4101144147
X4101144147
 

Talk 3_0

  • 1.  Au/TiO2  Nanopar/cle  Surface  Chemistry     Steven  P.  Burrows   Morris  Research  Group   30  April  2012   *   *  No  marital  jewelry  or  family  heirlooms  harmed  in   the  conduct  of  this  research.  
  • 2. Nanopar/cles:  The  Scale   •  Nanopar'cles  range  from   ~3  to  50  x  10-­‐9m  diameter   (smaller  than  a  virus).   •  Crystalline  material  on  this   size  scale  begins  to  assume   molecular  proper'es.   •  Electron  behavior  within   nanopar'cles  “between   bands  and  bonds”2   2   2 x 10⁻⁶ m 2 x 10⁻⁸ m Degussa P25 0.25 x 10⁻⁸ m Au 'Decoration' 0.04 x 10⁻⁸ m 1Bacteria Virus Nanoparticles 1Archives  of  Histology  and  Cytology,  2007  vol.  70  (1)  pp.  43-­‐49   2Applied  Spectroscopy,  2006  vol.  56  (1)  pp.  16A-­‐27A     Valence Band Conduction Band Egap HOMO - LUMO Gap Egap Bulk Semiconductor Nanoparticle Molecule Energy
  • 3. Applica/ons:  Present  and  An/cipated   •  Hydrogen  Fuel  Produc'on  (Water  SpliTng)   •  Hydrogen  Fuel  Storage   •  Photovoltaic  Cells   •  Building  Materials  Coa'ngs  (e.g.  Self-­‐Cleaning   Windows)   •  An'bacterial  Coa'ngs   •  An'-­‐Cancer  Therapies   •  Pollu'on  Detec'on,  Control,  and  Remedia'on   •  Industrial  Process  Catalysts   •  Detec'on  and  Decomposi'on  of  Chemical  Warfare   Agents  (CWAs)   3  
  • 4. Research  Objec/ves   •  Develop  understanding  of  size  and  loading   effects  for  Au/TiO2  nanopar'cle  catalysts.   •  Inves'gate  structural  effects  on  catalyst   performance:  ‘decorated’  vs.  aerogel  oxide   supports.   •  Maximize  cataly'c  ac'vity.   •  Develop  understanding  of  reac'on   mechanism  through  fundamental  catalyst   studies.   4  
  • 5. 5   Nanopar/cle  Prepara/on   And   Cataly/c  Ac/vity  Screening  
  • 6. Laser  Vaporiza/on  (LV)  Nanopar/cles   •  Sintered  tablet  of  metal  oxide  vaporized  with  CO2  laser.   •  Vaporized  oxide  condenses  in  gas-­‐phase  to  form  nanopar'cles.   •  Nanopar'cles  accrete  on  sheet  metal  surface.   •  Nanopar'cle  size  controlled  through  chamber  pressure  and   chamber  geometry.   6  
  • 7. Examples  of  LV  Produced  TiO2     7   P  =  1  Torr  O2   P  =  100  Torr  O2  
  • 8. Carbon  Monoxide  Oxida/on   8   2CO(g)  +  O2(g)     2CO2(g)  
  • 9. CeO2  Rela/ve  CO  Oxida/on  Ac/vity   9   300 400 500 600 700 800 -1 0 1 2 3 4 5 6 7 CO2 PeaksArea(2280-2395cm -1 ) Temperature / K Blank No. 1 No. 2 No. 3 No. 4 No. 5 No. 6 No. 7 No. 8 No. 9 CeO2 Nanoparticle Repeatability Study He + O2 + CO Temperature Control System (100 ~ 675 K) Catalyst Sample Screening Tube He + O2 + CO + CO2 IR Gas Cell FTIR Detection Activity Screening Apparatus Repeatability  Study  
  • 10. CO  Screening  Method  Valida/on   10   100 90 80 70 60 50 40 30 20 10 0 COConversion/% 700600500400300200100 Temperature / K SPB_069 CeO2 CO Oxidation Dual Flow Cell Calculations 10   the fluorite structure with a calculated lattice parameter of 5.416 Å, and the other phase still of fluorite structure with a contracted lattice parameter of 5.403 Å, attributed to a solid solution between gold and ceria. The closeness of the ionic radii of Ce4+ and Au3+, 0.97 and 0.85 Å, respectively,41 would indeed allow for the formation of a composite Ce1-xAuxO2-δ (where δ takes into account the charge balance).25,26 The XRD pattern of the CP sample calcined at 673 K is shown in Figure 4. Differently from the DP sample, and as expected from the high-temperature treatment, this profile reveals the Au (111) and the Au (200) reflection peaks of metallic gold along with the peaks related to the CeO2 phase with a certain degree of amorphism. It is worth mentioning that the further calcinations of the CP sample at 673 K aimed to form the solid solution, with a modified fluorite structure of ceria, which appeared to be amorphous after the 393 K treatment. Moreover, for the purpose of this study, the attainment of just ionic gold species by the DP method followed by the mild treatment in air at 393 K fulfilled our original objective. In Table 3, the results in terms of the main binding energies, Au 4f7/2, O 1s, of Au/Ce atomic ratio and gold loading, as obtained from the XPS quantitative analyses, are reported for the differently prepared samples. For all samples, no extra peaks due to impurities were observed. In consideration of the decreased activity of the 3AuCe(DP) with aging and after the catalytic reaction, the XPS results of this sample at different stages of its life, referred to as “as prepared”, “aged”, and “used”, are listed in the table. Because no such changes in activity were observed with the samples prepared by the other two techniques, no distinction between different stages of the Figure 1. CO conversion % as a function of temperature for the different catalysts. TABLE 1: Temperature in Correspondence of the 100% Conversion of CO catalyst T100% (K) 3AuCe(DP)393K 301 3AuCe(DP)1monthaged 373 3AuCe(SMAD)298K 427 10AuCe(CP)673K 473 ceria 723 TABLE 2: Average Ceria Crystallite Size, dCeO2, and Au Particle Size, dAu, As Obtained from XRD Analyses of the Different Catalysts (Values Are Quoted with an Uncertainty Ceria-Supported Gold Catalysts J. Phys. Chem. B, Vol. 109, No. 7, 2005 2823 tober2,2009|http://pubs.acs.org 2005|doi:10.1021/jp045928i Plot  Inset:  Venezia,  A.  M.  et  al.  Journal  of  Physical  Chemistry  B  2005,  109,  2821-­‐2827.   •  Samples  run  on  glass  wool  in   glass  bulb  screening  tube.   •  Par'cles  condi'oned  and   200  ∘C  for  ~  30  minutes.   •  Note  my  CeO2  achieves  50%   CO  conversion  at  ~640K.   •  Venezia  CeO2  achieves  50%   CO  conversion  at  ~550K.  
  • 11. Degussa  TiO2  With/Without  Au   11   200 300 400 500 600 700 800 -2 0 2 4 6 8 10 12 14 16 18 20 22 CO2 PeaksArea(2280-2395cm -1 ) Temperature / K Blank P25 TiO2 P25 TiO2 / Au Degussa P25 TiO2 with Solution Precipitated Au Ti O Ti O Ti Au C O C OO O O
  • 12. Mul/ple  Au  Deposi/ons  Reactor   12  12   F A N F A N Heated Sand Bath Air-cooled reflux condenser tubes Aluminum air duct tube Air FlowAir Flow Stirrer Motors Note the removeable top and sliding air ducts for connection to the condenser duct. Urea  Hydrolysis  Gold  Deposi/on   CO(NH2)2(aq)  +  3H2O(l)  →  CO2(g)  +  2NH4OH(aq)   pH  3  at  30∘C  to  pH  8  at  T  ~  80∘C   HAuCl4(aq)  +  4NH4OH(aq)→  Au(OH)3(s)  +  4NH4Cl(aq)  +  H2O(l)   •  Reac'on  vessels  are  heated  to   approximately  80  C  to  ini'ate  pH   shii  to  precipitate  Au(OH)3.   •  Solu'ons  are  s'rred  for   approximately  20  hours  to  allow   ‘Ostwald  Ripening’  par'cles.   •  Reac'ons  conducted  under  low-­‐light   condi'ons  to  block  uncontrolled   photo-­‐reduc'on  of  Au3+.   •  Gold  loading  %  determined  through   atomic  emission  spectroscopy  (ICP).  
  • 13. Electron  Microscopy  Measurement   13  13   0" 5" 10" 15" 20" 25" 30" 2" 3" 4" 5" 6" 7" 8" 9" 10"11"12"13"14"15"16" Frequency)/)%) Par.cle)Size)/)nm) 0" 5" 10" 15" 20" 25" 30" 35" 40" 2" 3" 4" 5" 6" 7" 8" 9" 10"11"12"13"14"15"16" Frequency)/)%) Par.cle)Size)/)nm) 9.5%  (w/w)  Au  /  TiO2   3.4%  (w/w)  Au  /  TiO2    =  Au  Par/cle   125000x  Mag   125000x  Mag   100  nm   100  nm  
  • 14. Au/TiO2  Prepara/on  CO  Screening   14  14   15 10 5 0 IntegratedCO2PeaksArea(2395~2280cm -1 ) 800700600500400300200 Mean Sample Temperature (K) Blank 4.0% Au/TiO2 6.4% Au/TiO2 6.6% Au/TiO2 8.2% Au/TiO2 9.5% Au/TiO2 8.6% Au/SiO2 2.6% Au/TiO2 3.4% Au/TiO2 4.4% Au/TiO2 5.4% Au/TiO2 6.6% Au/TiO2 7.4% Au/TiO2 5.9% Au/TiO2 8.6% Au/TiO2 10% Au/TiO2 10% Au/TiO2 11% Au/TiO2 15% Au/TiO2 12% Au/TiO2 Blacksburg Preparations Pittsburgh Preparation Au/SiO2 Blank Highest Activity Catalyst (9.5% Au) Lowest Activity Catalyst (3.4% Au) Au/P25  TiO2  Mul'-­‐Reactor  Results   Prior  Au/P25  TiO2   Prepara'on  (12%  Au)  
  • 15. Au  Deposi/on  with  Aerogel  TiO2   15   Au  Deposi'on  on  Oxide  Par'cles   Aerogel  Deposi'on  of  Oxide  on  Au   TiO2 TiO2 TiO2TiO2 TiO2 TiO2 TiO2 TiO2 Solution Au(OH)3 Deposition Au Particle Reductive Activation TiO2 TiO2 TiO2 TiO2 TiO2 TiO2 TiO2 TiO2 TiO2 TiO2 TiO2 TiO2 Au Particle Preparation Thiolate Coating Application Sol-Gel Application of TiO2 Sintering Removal of Thiolates and TiO2 Crystallization
  • 16. Why  This  Difference  MaZers   16   Thermal  migra'on  occurs  at   300  ~  400  ∘C  and  is  promoted   by  Cl-­‐  contamina'on.   TiO2 Au Decoration (Active) Au Aggregate (Low Activity or Inactive) Thermal Migration TiO2 TiO2 TiO2 TiO2 TiO2 TiO2 Au nanoparticles 'locked down' by 3-dimensional stabilization through multiple Au - TiO2 interfaces. 2-Dimensional Au -TiO2 Au - Aerogel TiO2
  • 17. Decorated  vs.  Aerogel  Au/TiO2   17  17   100 90 80 70 60 50 40 30 20 10 0 COConversion/% 400350300250200150100 Temperature / K Decorated vs. Aerogel Au/TiO2 Nanoparticles Decorated Run A Decorated Run B Aerogel
  • 19. High  Vacuum  Chamber  Apparatus   19   LN2 Cooled MCT FTIR Detector Interfacing Optics Nexus 470 FTIR Pressure Sensor RGAQuadrupole MassSpectrometer View Port Dosing Jets 19  (Top  View  -­‐  Not  to  Scale)   Sample  Mount   To Vacuum Pass-Through and High-Current Power Supply Blank (Empty) Sample 1 Sample 2 Tungsten Mesh Copper Mesh Clamps K-Thermocouple (Welded to Mesh) 10-­‐7  ~  10-­‐8  Torr   Pneumatic Gate Valve Manual Gate Valve Chamber Pump Pump Pressure Sensor Pressure Sensor ( Side View )
  • 20. TiO2  Thermal  O2  Condi/oning     20   0.40 0.35 0.30 0.25 0.20 0.15 0.10 0.05 0.00 ∆Absorbance 4000 3500 3000 2500 2000 1500 1000 Wavenumber / cm -1 •  Following  60  minutes  of  O2  treatment  at  673  K,  the   sample  is  cooled  slowly  to  300  K  and  the  O2  is   evacuated.   •  Nega've  deflec'ons  in  spectrum  are  the  result  of   adsorbate  losses.   Au  /  Aerogel  TiO2  (Post-­‐Treatment)   Aerogel  TiO2  (Post  Treatment)   Free  -­‐OH   forma'on   Organics   Loss   H2O   Loss   Carbonates  Loss  
  • 21. 21   •  Range  of  energies  observed  in  mid-­‐IR   range  span  approximately  0.45  eV.   •  Distribu'on  of  CB  electrons  governed   by  Fermi  probability  func'on   •  Changes  in  CB  electron  popula'on   and  intraband  transi'ons  observed  as   broad  shii  in  infrared  baseline   absorbance.   IR  Spectroscopy  of  Electrons…  ?   400 cm-1 / 0.05 eV 4000 cm-1 / 0.5 eV Ti 3+ shallow trap state conduction band 0.3~0.4eV FTIR spectrum energy range 3.0 ~ 3.1 eV conduction band valence band 0.3 ~ 0.4 eV Ti 3+ shallow trap state FTIR spectrum energy range Egap 0.20 0.15 0.10 0.05 0.00 ∆Absorbance 4000 3500 3000 2500 2000 1500 1000 Wavenumbers / cm -1 313 K 673 K f (E) = 1 1+ Exp E − EF kBT ⎡ ⎣ ⎢ ⎤ ⎦ ⎥
  • 22. Atomic  Hydrogen  n-­‐Doping   22   sociation on supported Au particles in the 2-3 nm diameter ge has been studied at 295 K. It has been found that the O2 is a sensitive detector for spillover-H atoms, where trapped ctrons in shallow trap states near the bottom of the conduction ure 8. Schematic diagram of the hydrogen spillover process, cting electrons into shallow trap states near the bottom of the duction band. The trapped electrons are then excited by IR photons the conduction band where they are highly delocalized, producing oad IR absorbance in the range 4000-1000 cm-1 . J. Phys. Chem. C, Vol. 111, No. 7, 2007 2963 D.  Panayotov  and  J.  T.  Yates.  J  Phys  Chem  C,  2007  vol.  111  (7)  pp.   2959-­‐2964   •  Molecular  hydrogen  adsorbed  onto  Au   nanopar'cles  dissociates  into  surface-­‐ adsorbed  atomic  hydrogen.   •  Spillover  of  atomic  hydrogen  onto  the  TiO2   support  surface  causes  popula'on  of  shallow   trap  states  with  addi'onal  electrons.   •  The  remaining  proton  (electron  hole)  diffuses   into  the  TiO2  bulk.   •  Shallow-­‐trapped  electrons  are  thermally  or  IR   excited  into  the  TiO2  conduc'on  band  where   they  are  detected  by  IR.   •  Removal  of  gaseous  H2  pressure  reverses  this   process.  
  • 23. Au/TiO2  n-­‐Doping  (293  K)   23   0.08 0.07 0.06 0.05 0.04 0.03 0.02 0.01 0.00 ∆Absorbance 4000 3500 3000 2500 2000 1500 1000 Wavenumber / cm -1 170  minutes   H2  exposure   •  Sample  chamber  sealed  and  pressurized  to  1.4  Torr  with   high-­‐purity  H2.   •  Growth  of  peaks  at  1100  and  1600  cm-­‐1  apributed  to   accumula'on  of  bicarbonate  and  molecular  water  from   methoxy  surface  treatment  decomposi'on.   •  Nega've  peak  at  3700  cm-­‐1  apributed  to  loss  of  free  -­‐OH   due  to  adsorp'on  of  CO2  decomposi'on  product.   •  H-­‐bonded  -­‐OH  growth  from  3600  -­‐  3500  cm-­‐1  noted.  
  • 24. Au/TiO2  n-­‐Doping  (293  K)   24   0.08 0.07 0.06 0.05 0.04 0.03 0.02 0.01 0.00 ∆Absorbance 4000 3500 3000 2500 2000 1500 1000 Wavenumber / cm -1 50  minutes   evacua'on   •  Following  H2  exposure,  sample  chamber  gate  valves   opened  and  pump  down  to  ~  1  x  10-­‐8  Torr  started.   •  Diffusion  of  protons  from  TiO2  bulk  and  TiO2  conduc'on   band  electrons  result  in  reforma'on  of  H2.   •  Loss  of  TiO2  conduc'on  band  electrons  results  in  broad   drop  of  baseline  absorbance.   •  Accumulated  methoxy  residue  decomposi'on  products   remain  on  surface.  
  • 25. Au/TiO2  n-­‐Doping  (250  K)   25   0.08 0.07 0.06 0.05 0.04 0.03 0.02 0.01 0.00 ∆Absorbance 4000 3500 3000 2500 2000 1500 1000 Wavenumber / cm -1 •  Similar  baseline  absorbance  effects  noted  when  the   sample  temperature  was  lowered  to  250  K  during  H2   exposure  and  pump  off  removal.   •  Because  this  experiment  followed  the  293  K  exposure,   further  methoxy  decomposi'on  products  accumulate  on   the  par'cle  surfaces.   90  minutes  H2   exposure  
  • 26. Au/TiO2  n-­‐Doping  (250  K)   26   0.08 0.07 0.06 0.05 0.04 0.03 0.02 0.01 0.00 ∆Absorbance 4000 3500 3000 2500 2000 1500 1000 Wavenumber / cm -1 •  Similar  baseline  absorbance  effects  noted  when  the   sample  temperature  was  lowered  to  250  K  during  H2   exposure  and  pump  off  removal.   •  Because  this  experiment  followed  the  293  K  exposure,   further  methoxy  decomposi'on  products  accumulate  on   the  par'cle  surfaces.   40  minutes   evacua'on  
  • 27. Propene  Chemistry  on  Au/TiO2   27   •  Propene  has  been  observed  to  convert  to  acrolein  and   propenal  as  intermediates  during  complete  oxida'on.1,2   •  Propene  reported  to  undergo  hydrogena'on  or  oxida'on  in   the  presence  of  Au/TiO2  nanopar'cles.3   •  Hydrogena'on  selec'vity  reported  for  Au  >  4.5  nm  and   oxida'on  for  smaller  Au  nanopar'cles.4   •  Propene  oxide  produc'on  of  commercial  interest  due  to   applica'on  as  a  polymer  feedstock.   H2C   CH   CH3   H3C   CH2   CH3   O   H2C   CH   CH3   Propene   Propane   Propene  Oxide   H2C   CH   CH   O   H3C   CH2   CH   O   Acrolein   Propenal   1Surface  Science,  2009  vol.  603  (7)  pp.  1010-­‐1017   2J  Phys  Chem,  1971  vol.  75  pp.  2914-­‐2921   3Journal  of  Catalysis,  2012  vol.  285  (1)  pp.  324-­‐327   4J.  Gaudet,  K.K.  Bando,  Z.  Song,  T.  Fujitani,  W.  Zhang,  D.S.  Su,  and  S  T  Oyama  
  • 28. Propene  and  H2  at  Au/TiO2  (123  K)   28   0.12 0.11 0.10 0.09 0.08 0.07 0.06 0.05 0.04 0.03 0.02 0.01 0.00 ∆Absorbance 4000 3500 3000 2500 2000 1500 1000 Wavenumber / cm -1 Reac/on  Condi/ons   •  Nanopar'cles  exposed  to  H2  and  n-­‐doped.   •  Chamber  evacuated  following  H2  exposure.   •  Chamber  pressurized  to  1  Torr  with  propene.   •  Sample  Temperature  maintained  at  123  K.     5  min.   8  min.   13  min.   17  min.   Propene  on  Au  /  Aerogel  TiO2  (123  K)  
  • 29. Propene  and  H2  at  Au/TiO2  (123  K)   29   0.12 0.11 0.10 0.09 0.08 0.07 0.06 0.05 0.04 0.03 0.02 0.01 0.00 ∆Absorbance 4000 3500 3000 2500 2000 1500 1000 Wavenumber / cm -1 5  min.   8  min.   13  min.   17  min.   10  min   Propene  on  Aerogel  TiO2  (123  K)   Gas-­‐Phase  Propene   Propene  Adsorbate  Peaks     υ(C=C)  at  1656,  1640  cm-­‐1   δa(CH3)  at  1456  cm-­‐1     Catalysis  Lepers,  2002  vol.  84  (3)   pp.  143-­‐146   δa(CH3)     υ(C=C)     Propene  on  Au  /  Aerogel  TiO2  (123  K)  
  • 30. Propene  and  H2  at  Au/TiO2  (123  K)   30   0.12 0.11 0.10 0.09 0.08 0.07 0.06 0.05 0.04 0.03 0.02 0.01 0.00 ∆Absorbance 4000 3500 3000 2500 2000 1500 1000 Wavenumber / cm -1 δa(CH3)     υ(C=C)     5  min.   8  min.   13  min.   17  min.   Propene  on  Aerogel  TiO2  (123  K)   10  min   50  min   •  Iden'fied  propene  adsorbate  modes   diminish  with  'me  on  both  TiO2  and  Au/ TiO2.   •  CO  (ads)  and  CO2  (ads)  peaks  grow  on  both   TiO2  and  Au/TiO2  with  length  of  exposure.   •  Peak  at  2163  cm-­‐1  assigned  to  CO  on   ca'onic  gold  (Auδ+)  and  2080  cm-­‐1  is   assigned  to  CO  on  anionic  gold  (Auδ-­‐).   CO2(ads)   CO(ads)   CO(ads)   CO  Auδ+   CO  Auδ-­‐  
  • 31. Propene  and  H2  at  Au/TiO2  (123  K)   31   0.12 0.11 0.10 0.09 0.08 0.07 0.06 0.05 0.04 0.03 0.02 0.01 0.00 ∆Absorbance 4000 3500 3000 2500 2000 1500 1000 Wavenumber / cm -1 5  min.   8  min.   13  min.   17  min.   Propene  on  Au  /  Aerogel  TiO2  (123  K)   Methyl  Hydrogen  Abstrac/on  from  Propene     Loss  of  methyl  bending  mode  at  1456   cm-­‐1  and  methyl  stretches  from  2800  ~   3200  cm-­‐1  caused  by  loss  of  methyl   hydrogens.     J  Phys  Chem,  1971  vol.  75  pp.  2914-­‐2921   Catalysis  Lepers,  2002  vol.  84  (3)  pp.  143-­‐146     Propene   Allyl  Ca'on   H2C   C   H   C   H   H   H   H2C   C   H   CH2   +   H2C   C   H   CH2   +   H2O   Ti   O   Ti   O   Ti  Ti   O   Ti   O   Ti   OH   δa(CH3)     υa,s(CH3)    
  • 32. Propene  and  H2  at  Au/TiO2  (123  K)   32   0.12 0.11 0.10 0.09 0.08 0.07 0.06 0.05 0.04 0.03 0.02 0.01 0.00 ∆Absorbance 4000 3500 3000 2500 2000 1500 1000 Wavenumber / cm -1 5  min.   8  min.   13  min.   17  min.   Propene  on  Au  /  Aerogel  TiO2  (123  K)   Resonance  Stabilized  Allyl  Ca/on  Reacts  with  TiO2  Bridge  Oxygens     Allyl  Ca'on   H2C   C   H   CH2   δ+   δ+   Ti  Ti   O   Ti   O   Ti   O   Ti  Ti   O   Ti3+   Ti3+   OH   O   H2C   C   H   C   H   Acrolein   υ(C=O)  at  1715  cm-­‐1  is  assigned  to   acrolein  produced  from  allyl.    As   propene  is  converted  to  acrolein   this  peak  grows.   υ(C=O)   Acrolein  
  • 33. Propene  and  H2  at  Au/TiO2  (123  K)   33   0.12 0.11 0.10 0.09 0.08 0.07 0.06 0.05 0.04 0.03 0.02 0.01 0.00 ∆Absorbance 4000 3500 3000 2500 2000 1500 1000 Wavenumber / cm -1 5  min.   8  min.   13  min.   17  min.   Propene  on  Au  /  Aerogel  TiO2  (123  K)   Acrolein  Binds  at  Lewis  Acid  Sites  (Ti4+)  and  Reacts  with  Surface  -­‐OH     Acrolein   Hydroxyla'on  of  the  TiO2  surface  by  water   reacts  with  acrolein  to  produce  propenal.     υ(C=O)  at  1682  cm-­‐1  and  δa(CH3)  at  1349   cm-­‐1  are  assigned  to  propenal.     Surface  Science,  2009  vol.  603  (7)  pp.  1010-­‐1017   Propenal   Ti   O   Ti   O   Ti   H2C   C   H   C   O   H   Ti   O   Ti   O   Ti   O   CH2   H3C   C   H   OH  OH   O-­‐   O-­‐   H2O   υ(C=O)   Propenal   Acrolein   δa(CH3)    
  • 34. Propene  and  H2  at  Au/TiO2  (123  K)   34   0.12 0.11 0.10 0.09 0.08 0.07 0.06 0.05 0.04 0.03 0.02 0.01 0.00 ∆Absorbance 4000 3500 3000 2500 2000 1500 1000 Wavenumber / cm -1 5  min.   8  min.   13  min.   17  min.   Propene  on  Au  /  Aerogel  TiO2  (123  K)   Adsorbed  Propenal  Reacts  with  Ladce  Oxygen  to  Yield  CO  and  CO2     CO(g)  is  either  re-­‐adsorbed  to  the   Au/TiO2  as  shown  earlier  or  spilled   over  onto  the  adjacent  TiO2   sample.     CO2(g)  also  either  adsorbs  to  the   Au/TiO2  as  carbonates  or  spills   over  to  the  TiO2  sample.   Propenal   Ti   O   Ti   O   Ti   O   CH2   H3C   C   H   Ti3+   Ti3+   Ti3+   CO   CO2   H2O   (Gaseous  and  Adsorbed)   CO(ads)   CO  Auδ+   CO  Auδ-­‐   CO2(ads)   CO3 2-­‐ (ads)  
  • 35. Summary   •  A  variety  of  decorated  Au  /  Degussa  P25  TiO2   were  prepared,  with  some  catalysts   demonstra'ng  surprising  CO  oxida'on  ac'vity.     •  CO  oxida'on  screening  suggested  Aerogel  oxide   supported  Au/TiO2  catalysts  are  less  ac've  than   their  decorated  counterparts.   •  Aerogel  supported  Au  catalysts  s'll  demonstrate   high  ac'vity  for  H2  dissocia'on  and  propene   oxida'on.   35  
  • 36. Future  Work   •  Further  experimenta'on  with  condi'ons  to   op'mize  decorated  Au/TiO2  catalysts.   •  Study  condi'ons  (if  any)  that  can  cause   Aerogel  Au/TiO2  catalysts  to  selec'vely   epoxidize  propene.   •  Beper  understand  mechanisms  for  propene   oxida'on  and  epoxida'on  on  both  decorated   and  Aerogel  Au/TiO2  catalysts.   36  
  • 37. Acknowledgements   •  Prof.  John  R.  Morris   •  Commipee  Members   –  Prof.  Brian  M.  Tissue   –  Prof.  Karen  J.  Brewer   –  Prof.  Sungsool  Wi   •  Kathy  Lowe  (Veterinary  School)   •  Leslie  Owen   •  Drs.  Jeremy  Pietron  and  Debra  Rolison   (Naval  Research  Laboratories)   •  Army  Research  Office   •  Members  of  the  Morris  Research  Group     37  
  • 38. Acknowledgements   •  Prof.  John  R.  Morris   •  Commipee  Members   –  Prof.  Brian  M.  Tissue   –  Prof.  Karen  J.  Brewer   –  Prof.  Sungsool  Wi   •  Kathy  Lowe  (Veterinary  School)   •  Leslie  Owen   •  Drs.  Jeremy  Pietron  and  Debra  Rolison   (Naval  Research  Laboratories)   •  Army  Research  Office   •  Members  of  the  Morris  Research  Group   –  Dr.  Dimitar  Panayotov  (a.k.a.  Mitko)   38  
  • 41. FTIR  Flow  Cell  Experiments   41  41   Nanopar'cle   sample  pressed   into  tungsten   mesh  
  • 42. CO  Screening:  Linear  Flow  Tube   42  42   6 mm Soft Glass Tube Nanoparticle Film Type K Thermocouple 1/4 - 1/8" OD Steel Tube Union Ceramic Coating Nichrome Heating Element Aluminum Tube Cast Aluminum Enclosure Reactor Heater Nanoparticle Screening Tube •  Mixture  of  7:1  molar  ra'o  O2:CO  passed   through  sample  tube.   •  Sample  tube  temperature  varied  from  200   to  600K.   •  IR  spectra  recorded  from  2600  ~1800  cm-­‐1.     •  CO2  peaks  integrated  from  2395  -­‐  2280   cm-­‐1.   Examples  of  CO  Screening  Tubes  (Au/TiO2)  
  • 43. Sample  Stage  Posi/oning  Precision   43  43   0.25 0.20 0.15 0.10 0.05 0.00 ∆Absorbance 4000 3000 2000 1000 Wavenumber / cm -1 Z = 14.46 mm 10 Spectra RSD = 0.27% @ 2602 cm -1 Z = 23.42 mm 10 Spectra RSD = 0.25% @ 2602 cm -1 9.5% (w/w) Au / TiO2 3.4% (w/w) Au / TiO2 S 0 S 1 S 2 FTIR HeNe Laser Reflection Z = 0 mm Z = 14.16 mm Z = 23.42 mm Z-AxisTranslation
  • 44. Au  Deposi/on  in  Progress…   44  44   S'rrer  Motors   Reflux  Air  Cooling   Reac'on   Tubes  (6)   Heated  Sand  Bath   S'rrer  Controller   Thermocouple   Well   PTFE  S'r  Vane  
  • 45. Post  Au  Deposi/on  Processing   45  45   •  Nanopar'cles  transferred   to  centrifuge  tubes.   •  Centrifuge  and  rinse  un'l   AgNO3  test  shows  no  Cl-­‐   present  (~8  rinses).   •  Rinsed  nanopar'cles  air   dried.   •  All  processing  opera'ons   must  be  conducted  under   darkroom  condi'ons.   •  Au(OH)3  reduced  to  Au0   immediately  prior  to  use.    
  • 46. Au  Assay  by  Atomic  Spectroscopy   46  46   ‘Wet’  Au(OH3)  on  TiO2   Reduced  Au0  on  TiO2   Au0  Dissolu'on   in  HNO3  /  HCl   Heated  Acid  Diges'on  of  Au0   ICP-­‐AES  Analyses  
  • 47. 2-­‐Channel  Gas  Flow  Cell   47  47   N2  Purged   Flexible   Op'cal  Paths   X-­‐Y  Transla'on   Stage   M M M He O2 CO Vent 1 Vent 2 Needle Valve Micrometer Needle Valve NeedleValve Rotometer Low-Flow Rotometer Gas Flow Splitter Gas Flow Splitter F B FTIR 2-Channel Flow Cell Catalyst Screening Tube Vent 3 Total Flow 180 mL/min Total Flow 28 mL/min Gas  Mixing  /  SpliTng  Manifold  
  • 48. Screening  Tube  Temperature  Control   48  48   Catalyst  Screening  Tube   Heaters   Gas  Flow   Subambient   Temperatures   Enclosure   LN2  Fill  
  • 49. Bulb  -­‐  Type  Screening  Tubes   49  49   K-Thermocouple Junction 6 mm OD Tubing 2 cm OD Bulb Glass Wool Packing Gas Expansion Zone •  Original  screening  tubes   were  ‘wet-­‐coated’  along   en're  length.   •  Bulb  modifica'on  tubes   concentrate  nanopar'cles   in  gas  expansion  zone.   •  Nanopar'cles  applied  dry   to  glass  wool.   •  Bulb  and  glass  wool  packing   promote  gas  turbulence,   mixing,  and  contact  with   nanopar'cle  sample.  
  • 50. HV  Chamber  Upgrades   50   Corrugated Steel Flex Line (Swagelok Tube Fittings) Corrugated Steel Flex Line ( VCR Female Fittings) Male - Male VCR Union VCR to Swagelok Union VCR-FVCR-F SS-4BK-VS1 VCR-FVCR-F SS-4BK-VS1 VCR to Swagelok Union VCR to Swagelok Union Swagelok Tee Fitting Swagelok Tee Fitting SS-4H Glass-to-Metal Simulant Bulb SS-4H Glass-to-Metal Simulant Bulb SS-4H Swagelok Tee Fitting SS-4H Swagelok to VCR-F Weldment PBaratron Sensor SS-4H Glass-to-Metal Simulant Bulb VCR to Swagelok Union VCR-FVCR-F SS-4BK-VS1 Swagelok SS-4CS Mini Cylinder SS-4H Swagelok 1/4 - 1/8 Reduncing Union 1/8" Line from Gas Mixing Manifold To Vacuum Pump Vacuum Chamber Manifold Plate Gas  Dosing  Manifold   and  Pressure  Monitoring   Vacuum  Gate  Valves   Pneuma/cs   Pneumatic Gate Valve Manual Gate Valve Chamber Pump Pump Pressure Sensor Pressure Sensor ( Side View )
  • 51. HV  Chamber  Upgrades   51   Detector  Op'cs  FTIR  Source  Op'cs   IR  Op/cs   IR  Beam  Flag  
  • 52. HV  Chamber  Upgrades   52  Sample  Temperature  Control   Soiware-­‐Controlled  Resis've    Hea'ng     LN2  Chamber/ Sample  Cooling  
  • 53. Au/TiO2  Methanol  Treatment   53   0.80 0.75 0.70 0.65 0.60 0.55 0.50 0.45 0.40 0.35 0.30 0.25 0.20 0.15 0.10 0.05 0.00 ∆Absorbance 4000 3500 3000 2500 2000 1500 1000 Wavenumber / cm -1 20  min.   40  min.   50  min.   75  min.   170  min.   200  min.   220  min.   1300  to  1150  cm-­‐1:   adsorbed  carbonates   3900  cm-­‐1:  free  -­‐OH  loss  
  • 54. Propene  Gas-­‐Phase  Spectrum   54   5.00 4.00 3.00 2.00 1.00 0.00 ∆Absorbance 3500 3000 2500 2000 1500 1000 Wavenumber / cm -1 NIST  Reference  Spectrum   Quartz  Flow  Cell  Spectrum  
  • 55. Gas-­‐Phase  Propene  in  Vacuum  Chamber   55   0.01 0.00 ∆Absorbance 4000 3500 3000 2500 2000 1500 1000 Wavenumber / cm -1 Gaseous  CO   Gaseous  Propene  Features   0.9  Torr   1.4  Torr   No  Propylene  (Baseline  W-­‐Mesh  Spectrum)   T  =  293  K  
  • 56. TiO2  Methanol  Treatment   56   0.80 0.75 0.70 0.65 0.60 0.55 0.50 0.45 0.40 0.35 0.30 0.25 0.20 0.15 0.10 0.05 0.00 ∆Absorbance 4000 3500 3000 2500 2000 1500 1000 Wavenumber / cm -1 8  min.   20  min.   30  min.   50  min.   70  min.   170  min.   200  min.   220  min.  
  • 57. Propene  and  H2  at  Au/TiO2  (293  K)   57   0.25 0.20 0.15 0.10 0.05 0.00 ∆Absorbance 4000 3500 3000 2500 2000 1500 1000 Wavenumber / cm -1 10  min.   20  min.   30  min.   40  min.   50  min.   60  min.   70  min.   80  min.   90  min.   1170  cm-­‐1:  adsorbed   bicarbonate  1590  cm-­‐1:  adsorbed   molecular  H2O   loss  of  -­‐CH3   stretches   CO  on  Au  ?