This document summarizes research on nanocrystalline titania powders doped with copper. Key findings include:
- Copper doping affected the phase stability of titania, promoting the rutile phase at higher temperatures.
- The 5% copper-doped titania sample had the largest degradation of methylene orange dye under visible light, indicating better photocatalytic activity than pure titania.
- UV-Vis spectroscopy estimated the band gap of the copper-doped titania to be 1.9-2 eV, lower than pure titania and allowing absorption of visible light.

![Silicon
DOI 10.1007/s12633-015-9356-x
ORIGINAL PAPER
Optical and Structure Properties of Nanocrystalline Titania
Powders with Cu Dopant
Nasrollah Najibi Ilkhechi1 · Behzad Koozegar Kaleji1
Received: 8 December 2014 / Accepted: 11 September 2015
© Springer Science+Business Media Dordrecht 2016
Abstract TiO2 nanopowders doped by Cu were prepared
by the sol–gel method. The effects of Cu doping on the
structural, optical, and photo-catalytic properties of tita-
nia nanopowders have been studied by X-ray diffraction
(XRD), scanning electron microscopy (SEM), transmission
electron microscopy (TEM), and UV–Vis absorption spec-
troscopy. XRD results suggest that adding impurities has
a significant effect on anatase phase stability, crystallinity,
and particle size of TiO2. Titania rutile phase formation in
the system (Ti–Cu) was promoted by Cu2+ doped TiO2. The
photo-catalytic activity was evaluated by photo-catalytic
degradation kinetics of aqueous methylene orange (MO)
under visible radiation. The results show that the photo-
catalytic activity of the 5 %Cu doped TiO2 nanopowders has
a larger degradation efficiency than pure TiO2 under visible
light. Also, the minimum band gap was estimated to be ∼
1.9–2 eV from UV–Vis spectra.
Keywords TiO2 nanocomposite · Sol–gel · Cu dopant ·
Optical properties
1 Introduction
Titania (TiO2) crystallizes in three phases: brookite (rhom-
bohedral, a = 5.43 ˚A; b = 9.16 ˚A; c = 5.13 ˚A), anatase
Nasrollah Najibi Ilkhechi
nasernajibi@gmail.com
Behzad Koozegar Kaleji
b.kaleji@malayeru.ac.ir
1 Department of Materials Engineering, Faculty of Engineering,
Malayer University, P.O. Box: 65719-95863, Malayer, Iran
(tetragonal, a = b= 3.78 ˚A; c = 9.50 ˚A), and rutile
(tetragonal a = b= 4.58 ˚A; c = 2.95 ˚A). The brookite
and anatase crystalline phases, which are stable at lowtem-
peratures, transform into rutile by calcination at higher
temperatures. However, brookite and anatase can be stabi-
lized at high temperatures in the presence of dopants during
synthesis which inhibits their transformation into rutile
[1–4]. Among various phases of titania, anatase shows bet-
ter photocatalytic activity with anti-bacterial performance
[5–9]. A stable anatase phase up to the sintering tempera-
ture of the ceramic substrates is the most desirable prop-
erty for applications of anti-bacterial self cleaning building
materials (e.g., bathroom tile, sanitary wares, etc.) These
applications require high purity titania with a definite phase
composition [10–12].
TiO2 doped with Ce, V, Cu, Sn, Nd, Fe, Cr or Co
shows a red shift of the absorption band compared to pure
TiO2, and considerable photocatalytic activity under vis-
ible light Irradiation [13–19]. Sensitization of Cu doped
TiO2 with eosin improved the photocatalytic activity for
water splitting under visible light irradiation [15]. In this
case, CuO not only brings about the charge separation
but also provides active sites for water splitting. Some
recent studies have revealed that the oxygen deficient sites
play a crucial role in the visible light induced photocat-
alytic activity of TiO2. Ihara et al. [20] have reported
that the low temperature H2 plasma treated TiO2 and
nitrogen doped TiO2 [21] showed visible light photocat-
alytic activity due to the presence of oxygen deficient
sites.
Prokes et al. [22] have proposed that the visible light
absorption of titanium oxynitride is due to the oxygen hole
center created during the surface modification process by
nitrogen near the surface of the nano-colloid. The visible
light photocatalytic activity observed due to the oxygen
Author's personal copy](https://image.slidesharecdn.com/5c617b3b-05d6-4e95-9e4b-06a84e7a7afc-160120183934/85/10-1007_s12633-015-9356-x-3-320.jpg)
![Silicon
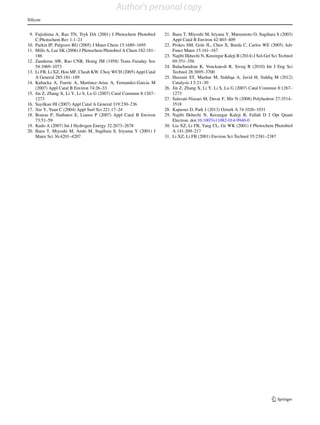
Fig. 1 XRD spectra of the pure and doped TiO2 nanopowders at
500◦C a TiO2 (T), b TiO2-5 %Cu (TC)
vacancies in TiO2 is found to decrease after an optimum
value.
In this paper, TiO2 nanopowders doped by Cu were pre-
pared by the sol–gel method. The effect of the dopant
cations on the stability of the anatase phase and optical
properties at high temperature was studied. The efficiency
of these samples as photocatalysts for degradation of MO,
as an organic compound model, under visible light was
investigated.
2 Experimental Procedures
2.1 Preparation of the Doped Titania Nanopowders
The preparation of the precursor solution for Cu doped TiO2
nanopowder is as follows: TiO2 and CuO sols were prepared
separately. Titanium (IV) butoxide (TBT = Ti(OC4H9)4,
Aldrich) was selected as the titanium source. 10 ml of
ethanol (EtOH, Merck) and 4 ml of ethyl acetoacetate,
which is a sol stabilizer, were mixed, and then 4 ml of
TBT was added at the rate of 1 ml/min to the mixture at
ambient temperature (250C). The solution was continuously
stirred for 1 h, followed by dropping of HNO3 as catalyst
to the solution. Deionized water was added into the solution
Fig. 2 XRD spectra of the T-5 %Cu (TC) nanopowders at different
temperatures a 600◦C, b 700◦C, c 800◦C, d 900◦C, e 1000◦C
slowly to initiate the hydrolysis process. The solution was
aged for 24 h in order to complete all reactions. The chem-
ical composition of the alkoxide solution was TBT: H2O:
HNO3: EAcAc: EtOH = 1: 8: 3: 0.05: 5 in volume ratio. In
order to prepare the CuO sol, Cu(NO3)2.3H2O (Merck) was
dissolved in EtOH with a volume ratio of Cu(NO3)2.3H2O
: EtOH = 1:6 at ambient temperature with continuous
stirring. Cu was doped under continuous stirring at room
temperature for 40 min. The formed gel was dried at 100◦C
for 60 min. Finally, the prepared samples were calcined at
desired temperatures (500, 600, 700, 800, 900, 1000◦C) for 2 h.
2.2 Characterization Methods
Samples were studied using X-ray diffraction analysis
(Philips, MPD-XPERT, λ:Cu Kα = 0.154 nm). The sam-
ples were scanned in the 2θ range of 20◦–60◦. The average
crystallite size of nanopowders (d) was determined from the
XRD patterns, according to the Scherrer equation (1) [23]
d = kλ/β cos θ (1)
where k is a constant (shape factor, about 0.9), λ the X-ray
wavelength (0.154 nm), β the full width at half maximum
(FWHM) of the diffraction peak, and θ is the diffrac-
Table 1 Characterization of
pure and doped TiO2(TC) at
temperature 5000C
Sample ˚A % R % Crystallite a = b c Cell Volume S
Size(nm) ( ˚A) ( ˚A) ( ˚A)3 m2/g
dA dR
TiO2(T) 100 − 9.47 − 3.767 8.944 126.917 183.2
T-5 %Cu (TC) 100 − 8.35 − 3.798 12.086 174.331 208.7
Author's personal copy](https://image.slidesharecdn.com/5c617b3b-05d6-4e95-9e4b-06a84e7a7afc-160120183934/85/10-1007_s12633-015-9356-x-4-320.jpg)
![Silicon
Table 2 Characterization of 5 % Cu doped TiO2(TC) at different temperature
Calcination ˚A R Crystallite a=b c Cell S
temperature % % Size(nm) ( ˚A) ( ˚A) Volume( ˚A)3 m2/g
dA dR
6000C 100 - 10.19 - 3.796 9.431 136.009 150.9
7000C 100 - 13.89 - 3.770 6.019 85.547 110.7
8000C - 100 - 17.93 4.679 2.997 65.613 79.6
9000C - 100 - 24.50 4.681 2.991 65.538 58.3
10000C - 100 - 32.36 4.664 3.000 65.258 44.1
tion angle. The values of β and θ of anatase and rutile
phases were taken from anatase (101) and rutile (110) planes
diffraction lines, respectively. The amount of rutile in the
samples was calculated using the following equation (2)
[23]
XR = (1 + 0.8(IA/IR))−1
(2)
where XR is the mass fraction of rutile in the samples,
and IA and IR are the X-ray integrated intensities of the
(101) reflection of the anatase and (110) reflection of rutile,
respectively. The diffraction peaks of crystal planes (101),
(200), and (105) of the anatase phase in XRD patterns were
selected to determine the lattice parameters of the TiO2
and doped TiO2 nanopowders. The lattice parameters were
obtained by using Eq. 3 [23]
(Bragg’s law) : 2d(hkl)sinθ = λ
(1/dhkl)2
= (h/a)2
+ (k/b)2
+ (l/c)2
where d(hkl) is the distance between the crystal planes of (h
k l); λ is the wavelength of X-ray used in the experiment; θ
is the diffraction angle of the crystal plane (h k l); h k l is the
crystal plane index; and a, b, and c are lattice parameters (in
anatase form, a = b =c).
The morphology of the nanopowder was observed using
a scanning electron microscope (SEM, XL30 Series) with
an accelerating voltage of 10–30 kV. TEM imaging was
carried out using a Zeiss-EM10C-80 kV instrument. FTIR
Fig. 3 FTIR spectra of pure and doped TiO2 nanoparticles calcined at
temperatures 500◦C a T, b TC
absorption spectra were obtained over the range of 4000–
400 cm−1 at room temperature.
2.3 Photo-catalytic Activity Measurement
The photocatalytic activity was evaluated by monitoring the
degradation of MO solution under visible illumination. In
each experiment, 0.08 g standard sample calcined at differ-
ent temperatures was dispersed in 50 mL of MO solutions
with concentration 5 × 10⁻⁶ M. Visible irradiation was pro-
vided by a xenon lamp (500 W) equipped with a cutoff
filter to remove light with wavelength below 400 nm. Before
the test, all powders containing MO solutions were mag-
netically stirred in the dark for 1 h to establish adsorption–
desorption equilibrium. Then, the solutions were irradiated
under visible light with a constant stirring rate of 450 rpm.
After 40 min irradiation, 5 ml of supernatants were taken
from the suspension by a syringe filter unit to scan the UV–
vis absorption spectrum. The UV–vis absorption spectra of
samples were measured between 200 and 1000 nm. The
extent of the methyl orange decomposition was determined
by measuring the value of the absorbance value at 478 nm
(max absorption of MO) using a UV–vis spectrometer. The
degradation rate (η (%)) of methyl orange was calculated by
the following formula: where A0 and At represent the initial
equilibrium concentration and reaction concentration of the
reactant at 478 nm, respectively (3) [23].
η(%) = (A0 − At )/A0 × 100 (3)
3 Results and Discussion
3.1 X-ray Diffraction Studies of the Nanopowders
Figure 1 shows the XRD patterns of pure and doped TiO2
nanopowders with 5 % mol of Cu heat treated at 500 ◦C
for 2 h. The X-ray diffraction peak at 25.3◦ corresponds to
the characteristic peak of the crystal plane (101) of anatase.
According to XRD patterns, the pure and doped TiO2 (T)
consisted of pure anatase phase. No characteristic peaks of
Author's personal copy](https://image.slidesharecdn.com/5c617b3b-05d6-4e95-9e4b-06a84e7a7afc-160120183934/85/10-1007_s12633-015-9356-x-5-320.jpg)
![Silicon
Fig. 4 Tauc plots of T,
T–5 %Cu (TC) nanopowders
calcined at 5000C
CuO were observed in doped TiO2 nanopowders which sug-
gests the incorporation of Cu2+ into the TiO2 lattice [24,
25]. The calculated crystallite sizes of anatase, calculated by
the Scherrer formula, are given in Table 1. The decrease in
crystal size can be attributed to the presence of Cu-O-Ti in
the doped TiO2 nanopowders, which inhibits the growth of
crystal grains. According to Table 1, the crystallite size and
surface area of pure and doped TiO2 nanopowders at a tem-
perature of 500◦C is as follows: dT (nm) > dTC (nm), ST
(m2/g) < STC (m2/g).
The XRD patterns of 5 % mol of Cu doped TiO2,
nanopowders calcined at different temperatures are shown
in Fig. 2. Samples heated at 500 − 700◦C show only the
anatase phase and at 800 − 1000◦C the samples show
the rutile phase. The addition of Cu has a promoting
effect on the transformation of anatase to rutile crystalline
phase [25, 26]. All the samples were identified as the mix-
ture polymorphs of anatase or rutile without any impurity
phase. The ionic radius of the Cu2+ ion (CN: 4, 0.58 ˚A)
approaches that of the Ti4+ ion (CN: 6, 0.66 ˚A) in TiO2
and the Cu2+ ions will replace lattice Ti4+ ions and thus
occupy lattice Ti4+ positions in the doping reactive process.
It is clear from Table 2 that the crystallite size increased
but the surface area decreased with increase of the calci-
nations temperature for anatase (600◦C, 700◦C) and rutile
(800 − 1000◦C) nanoparticles.
3.2 FTIR Analysis of Pure and Doped TiO2 nanopowders
Figure 3 shows the FTIR spectrum of the nanocrystalline
TiO2 powder calcined at temperature 500◦C in the range
of 400-4000 cm−1 Metal oxides generally give absorption
Fig. 5 Tauc plots of Cu doped
TiO2 nanoparticles at different
temperatures
Author's personal copy](https://image.slidesharecdn.com/5c617b3b-05d6-4e95-9e4b-06a84e7a7afc-160120183934/85/10-1007_s12633-015-9356-x-6-320.jpg)
![Silicon
bands in the finger print region below 1000 cm−1 arising
from inter-atomic vibrations. The infrared spectra (Fig. 3)
of pure and doped TiO2 exhibits the following bands:
(i) 3332.02 cm−1 due to intermolecular structure and the
O–H band [27]
(ii) 511.02 cm−1 and 511.04 cm−1 which can be attri-
buted to the Ti-O stretching and Ti-O-Ti binding
stretching modes [28].
(iii) 472.02 cm−1 which can be attributed to the vibrations
of Cu–O [29].
3.3 Photocatalytic Evaluation
The optical band gap (Eg) is calculated using the UV–vis
spectra by [29]:
αhυ = A(hυ − Eg)n
(4)
where hυ is the photon energy, A and n are constants. For
allowed direct transition n = 1/2, direct forbidden transi-
tion n = 3/2 and indirect allowed transition n = 2.The
optical band gap energy (Eg) is found by extrapolating the
straight line portion of (αhυ)1/2 with the abscissa axis (hυ)
in the vicinity of the fundamental optical transition for pure
and doped nanopowders. It can be seen from Tauc plots
(Fig. 4) that the band gap of pure TiO2 nanoparticles is 3.12
eV. Also, the values of the band gap calculated from Tauc
plots are found to be 2.65 for TC at temperature 500◦C. It
indicates a decrease in the energy band gap for Cu doped
samples (inset in Fig. 4). It has been reported that metal dop-
ing could form a dopant energy level within the band gap of
TiO2 [30, 31].
The UV-Vis DRS of TC calcined at 600◦C- 1000◦C are
illustrated in Fig. 5, which shows that the band gap of
Fig. 6 Photocatalytic degradation of MO determined by pure and
doped TiO2 nanopowders after 40 min visible irradiation at different
temperature
samples decreased with the increase of the calcination tem-
perature. The largest reduction band gap is observed for
5 % mol of Cu doped TiO2 at temperature 1000◦C (2 ev).
This large reduction band gap may be attributed to those
impurities incorporated into the host (TiO2) structure which
create extra energy levels within the band gap. When the
calcination temperature is below 700◦C, the red-shift of the
absorption edge wavelength can be attributed to the growth
of TiO2 crystallites. At 800◦C −1000◦C, the red-shift is due
to the increased crystallite size and phase transformation
from anatase to rutile, leading to the decrease of band gap
energy.
Figure 6 shows the results of photo-catalytic decomposi-
tion of MO solution caused by degradation of MO in contact
with nanopowders with Cu dopant at different calcination
temperatures. According to Fig. 6, the order of photo-
catalytic activity of TiO2 nanopowders at 40 min under
the visible irradiation is TC > T, which suggests that the
doping enhances the photo-catalytic activity of TiO2. This
enhanced photocatalytic activity is because of suppressed
recombination of photogenerated electrons and holes.
Figure 6 shows that nearly 72 % of MO was decomposed
in the presence of T-5 %Cu after visible irradiation for 40
min. When Cu is introduced to TiO2 nanopowders, the TiO2
nanocomposite are different from pure TiO2 nanopowders
Fig. 7 SEM images of pure and doped TiO2(TC)nanopowders calci-
nations at 500 ◦C a T, b TC
Author's personal copy](https://image.slidesharecdn.com/5c617b3b-05d6-4e95-9e4b-06a84e7a7afc-160120183934/85/10-1007_s12633-015-9356-x-7-320.jpg)
![Silicon
Fig. 8 EDX images of doped TiO2(TC)nanopowders calcinations at
500 ◦C
in both physical and chemical characteristics, such as phase
types (Figs. 1 and 2), surface areas, crystallite size (Tables 1
and 2), and chemical compositions. An optimum calcina-
tion temperature of doped TiO2 shows higher activity than
pure TiO2. When the calcination temperature of doped TiO2
increases to 700◦C the photo-catalytic reaction rate tends
to increase and then decreases at higher calcination tem-
perature, because at high calcination temperature samples
have a rutile structure and give lower degradation efficiency
compared with the samples calcined at lower temperatures.
Our results are in good agreement with those obtained in
a previous study. On the basis of our previous results, a
nanocomposite of two phases of the same semiconductor
and good crystallization of anatase both lead to an improve-
ment in photo-activity. Thus, the sample calcined at 700◦C
has higher crystallization and intensity of anatase phase due
to the photocatalytic activity increase [29].
3.4 SEM-EDX and TEM Analysis of Pure and Doped
TiO2 nanopowders
Figure 7 shows the surface morphology of the pure and
doped TiO2 nanoparticles at temperature 500◦C. Figure 7b
presents the images of doped TiO2 nanoparticles which
illustrate the small size (100-200 nm) of the undoped parti-
cle. This result confirms that the width of the anatase peak
Fig. 9 TEM micrograph of T,TC calcined at 500 ◦C a) T, b) TC
diffraction from XRD indicates the smaller crystalline size
at 500◦C (Fig. 1). In addition to SEM analysis, EDX anal-
ysis was performed on powders in order to investigate the
chemical structure. The analyses revealed the existence of
Ti as the main element. The EDX data of doped TiO2 in
Fig. 8 shows two peaks around 4.5 keV. The intense peaks
is assigned to the bulk TiO2 and the less intense one to the
surface TiO2. The peaks of Cu are distinct in Fig. 8 at 0-2.6
keV. The less intense peak is assigned to dopant in the TiO2
lattices. These results confirm the existence of cations in the
solid catalysts.
The particle size and shape of pure and doped TiO2
nanoparticles calcined at a temperature of 500◦C were
investigated by TEM and are shown in Fig. 9. The TEM
images illustrate that almost all of the particles are of spher-
ical shape and the effect of doping on particle size is
considerable. A decrease of particle size with doping of Cu
is attributed to inhibition of the crystal growth. The TEM
results are in good agreement with XRD data measured
using Scherrer’s equation and surface area data as presented
in Table 1.
4 Conclusion
This study focused on the effects of calcination tempera-
ture and Cu dopant on phase transformation, crystallite size,
and photo-catalytic activity of titania nanopowders. It was
shown that the crystal phases and crystallite sizes of doped
TiO2 nanopowders. largely depend on the calcinations tem-
perature. Crystalline anatase single phase was found at a cal-
cinations temperature range of 500–700◦C and rutile phase
was formed at a temperature of 800–1000◦C. The photo-
catalytic activity of the doped nanopowders is higher than
that of pure TiO2 nanopowders. Cu2+ substitution for Ti4+
in the TiO2 lattice results in a decrease in the rate of photo-
generated electron–hole recombination that is responsible
for the enhancement in the photo-catalytic degradation rate.
References
1. Gopal M, Chan W, Jonghe L (1997) J Mater Sci 32:6001–6008
2. Mark HF, Othmer DF, Overberger CG, Seaberg GT (eds) (1983),
vol 23. Wiley, New York
3. Weast RC (1984) Handbook of chemistry and physics. CRC Press,
Boca Raton, pp B–154
4. Kostov I (1973) Minerology, 3rd edn. Nauka, Izkustia, Sofia
5. Yang SW, Gao L (2005) J Am Ceram Soc 88:968–970
6. Karakitsou KE, Verykios XE (1993) J Phys Chem B 97:1184–
1189
7. Hu C, Lan Y, Hu X, Wang A (2006) J Phys Chem B 110:4066–
4072
8. Sakatani Y, Grosso D, Nicole L, Boissiere C, Illia S, Sanchez C
(2007) J Mater Chem 16:77–82
Author's personal copy](https://image.slidesharecdn.com/5c617b3b-05d6-4e95-9e4b-06a84e7a7afc-160120183934/85/10-1007_s12633-015-9356-x-8-320.jpg)


![Octahedral rhenium K4[Re6S8(CN)6] and Cu(OH)2cluster modifiedTiO2for the phot...](https://cdn.slidesharecdn.com/ss_thumbnails/appliedcatalysisageneral49920153238-171005000403-thumbnail.jpg?width=640&height=640&fit=bounds)
![Octahedral rhenium k4[re6 s8(cn)6] and](https://cdn.slidesharecdn.com/ss_thumbnails/octahedralrheniumk4re6s8cn6and-200110040250-thumbnail.jpg?width=640&height=640&fit=bounds)


