More Related Content
Similar to Project in Excel 1 (20)
Project in Excel 1
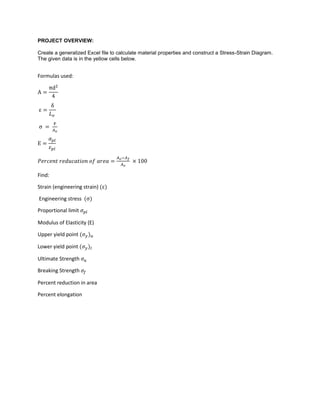
- 1. PROJECT OVERVIEW:
Create a generalized Excel file to calculate material properties and construct a Stress-Strain Diagram.
The given data is in the yellow cells below.
Formulas used:
A =
πd2
4
ε =
δ
𝐿 𝑜
σ =
F
𝐴 𝑜
E =
𝜎 𝑝𝑙
𝜀 𝑝𝑙
𝑃𝑒𝑟𝑐𝑒𝑛𝑡 𝑟𝑒𝑑𝑢𝑐𝑎𝑡𝑖𝑜𝑛 𝑜𝑓 𝑎𝑟𝑒𝑎 =
𝐴 𝑜−𝐴 𝑓
𝐴 𝑜
× 100
Find:
Strain (engineering strain) (ε)
Engineering stress (σ)
Proportional limit 𝜎 𝑝𝑙
Modulus of Elasticity (E)
Upper yield point (𝜎 𝑦) 𝑢
Lower yield point (𝜎 𝑦)𝑙
Ultimate Strength 𝜎 𝑢
Breaking Strength 𝜎𝑓
Percent reduction in area
Percent elongation
- 2. Units
Input data / information in/in
gauge L orig dia final dia area 1/area
final
area
2 0.501 0.331 0.1971 5.073 0.0860
in/in in/in in/in sq in/in
1 / sq
in/in
sq in/in
Table of calculations
kips inches in/in ksi ksi
Load Deformation strain
all stress
values
elastic
region
0.00 0.0000 0.00000 0.0 0.0
1.00 0.0003 0.00015 5.1 5.1
2.00 0.0007 0.00035 10.1 10.1
3.00 0.0011 0.00055 15.2 15.2
4.00 0.0014 0.00070 20.3 20.3
5.00 0.0018 0.00090 25.4 25.4
6.00 0.0021 0.00105 30.4 30.4
7.00 0.0025 0.00125 35.5 35.5
8.00 0.0028 0.00140 40.6 40.6
8.60 0.0035 0.00175 43.6 43.6
8.40 0.0050 0.00250 42.6 42.6
7.80 0.0095 0.00475 39.6 39.6
9.65 0.1000 0.05000 49.0 49.0
11.80 0.2000 0.10000 59.9 59.9
12.25 0.3000 0.15000 62.1 62.1
12.50 0.5000 0.25000 63.4 63.4
12.20 0.6000 0.30000 61.9 61.9
10.20 0.7000 0.35000 51.7 51.7
8.40 0.7200 0.36000 42.6 42.6
Plot on
secondary
axes
Plot on
primary
axes
- 3. Material Properties
a) Proportional Limit 40.6 ksi
b) Modulus of Elasticity 28,697 ksi
c) Upper and lower yield pts 43.6 39.6 ksi
d) Ultimate strength 63.4 ksi
e) Breaking strength 42.6 ksi
f) Precent reduction in area 56.4 %
63.4
42.6
0.0
10.0
20.0
30.0
40.0
50.0
60.0
70.0
0.00000 0.05000 0.10000 0.15000 0.20000 0.25000 0.30000 0.35000 0.40000
0
10
20
30
40
50
60
70
0.0000 0.0010 0.0020 0.0030 0.0040 0.0050
Stress(ksi)[ElasticRegion]
Strain (in/in) [Elastic Region]
Stress-Strain Diagram (steel)
all stress valves
elastic region