Factors Affecting E-Procurement Adoption in Minimizing Risks in the Supply Ch...
Paper 1
1. 1
Does public enforcement against copyright
infringement necessarily improve innovation?
Dyuti BANERJEE a
and Sougata PODDAR b
Abstract:
We characterize the equilibrium enforcement polices for different levels of piracy and
study their impact on innovation. The social welfare maximizing enforcement polices
induces deterrence of piracy. However, innovation falls for initial increases in piracy,
beyond which, the enforcement policies maintain innovation at a constant level.
Under the innovation maximization objective, no enforcement and tolerating piracy
up to a certain level is optimal (though innovation falls), before resorting to the
enforcement policies that induces deterrence of piracy and maintains innovation at the
constant level. Up to the tolerance level of piracy there is a trade-off between social
welfare and innovation.
JEL Classification: D21, D43, L13, L21, L26, O3.
Keywords: Commercial piracy, strategic entry deterrence, fine, innovation objective,
monitoring, quality of innovation, social welfare objective
a Department of Economics, Monash University, Clayton, VIC 3800, Australia
Email: dyuti.banerjee@buseco.monash.edu.au
b Department of Economics, Southern Methodist University, Dallas, USA and Auckland University of
Technology, Auckland 1010, New Zealand
E-mail: spoddar@aut.ac.nz
2. 2
1. Introduction
A renewed interest in research on intellectual property right (IPR) protection
comes at a time when we are observing a steady growth of the digital economy and
proliferation of digital products worldwide. Along with digital growth comes digital
piracy. Its implications for the economy and society is a major concern for both
developed and developing countries. IPR laws and copyright protections play a major
role in controlling piracy in order to nurture the technological progress and
innovation. Copyright protection is necessary to get sufficient returns from
investments on new innovations, which then funds future innovation. While it is true
that new innovations need such protections but the question is, can strict copyright
enforcement policies by a government necessarily stimulate innovation?
In light of this, the broad purpose of this paper is to re-examine the conventional
view that stricter copyright protection is conducive to innovation by bringing in
several important issues. In particular, we analyse how the copyright enforcement
policies, which are endogeneously determined in this paper, respond to increases in
the level of piracy or the threat of piracy. This allows us to seek answers to two main
questions. One, whether the equilibrium enforcement policies are successful in
deterring piracy? Two, what is the effect of such policies on the quality of innovation?
These questions are studied by analysing the government’s social welfare maximizing
objective and the innovation maximizing objective which in turn allows us to
understand whether there is any trade-off between social welfare and innovation. This
is relevant in the following broader context.
Recent quantitative and qualitative studies indicate that China and the U.S. are
at crossroads with respect to IPR. Intellectual property cases indicate that China is
moving to embrace strong IPR protection, while the U.S. is moving towards a weaker
intellectual property rights regime. Historically, U.S. has always positioned herself as
a country with strong intellectual property protections and enforcement systems.
However, the strong protection regime for intellectual property rights is losing steam
due to criticism that the protection has gone too far. On the other hand, experts on
Chinese piracy problem agree that China’s piracy issue lies in its failure to recognize
(or its lack of respect for) private intellectual property rights and the absence of a
3. 3
strong enforcement mechanism. However, new data reveals that China has started to
accelerate its embrace of intellectual property as an important asset and in the U.S.
commentators urge that the Congress must immediately champion for weaker patent
rights. These contrasting evidences are shown in Tables 1 and 2. 1
Table 1: Annual change in patent, trademark and copyright case filed in U.S.
district courts durinf fiscal years 2002-2007
Fiscal Year Patent Cases Trademark Cases Copyright Cases
2002 - - -
2003 108 (4%) 199 (5.8%) 364 (17.5%)
2004 267 (9.6%) -161 (-4.4%) 559 (22.8%)
2005 -349 (-11.4%) 161 (4.6%) 2789 (92.8%)
2006 101 (3.7%) 78 (2.1%) -852 (-14.7%)
2007 71 (2.5%) 252 (-6.7%) -544 (-11%)
Average 1.7% 0.3% 21.5%
Table 2: Total intellectual property cases in China
Fiscal Year Total Cases
Filed
Total Percent
Increase
Total Disposed
Cases
2004 12205 31.7% 11113
2005 16583 35.9% 16453
2006 16947 2.2% 16750
2007 20781 23% 20310
Table 1 shows the percentage change for each fiscal year in cases filed for
patents, trademarks and copyrights. Overall, we see the number of intellectual
property litigation cases in the U.S. from 2002-2007 remained relatively flat in both
trademark and patent areas. There are more litigation activities in the copyright cases,
however, in 2006 and 2007 the number of cases filed significantly decreased clearly
1
Source: Table 1: Admin Office of the U.S. Courts (2007); Table 2: Ministry of Commerce of China,
China’s Intellectual Property Protection in 2007. Also see Nguyen (2011) for further evidence.
4. 4
indicating a possible emerging trend of a weaker copyright protection (i.e. patent
owner have fewer rights, hence less litigations filed) regime in the US.2
On the other
hand, Table 2 clearly indicates a rise in the IPR litigation cases filed in China over the
recent years, marking an emerging trend of having a stricter copyright protection
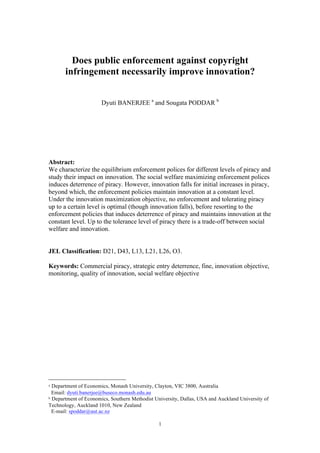
regime. This is also consistent with the data from Business Software Alliance (2010),
presented in Figure 1, which shows that from 2003 till 2009 piracy rates have dropped
from around 91% to below 80% in China while the same in the U.S has remained
steady around the 20% level.
Figure 1: Piracy rates in China and USA.3
Our paper seeks to provide a theoretical explanation to the above mentioned
transition or direction of changes in IPR laws in countries like China and the U.S. We
consider a model of commercial piracy where a predatory firm (pirate) competes with
a copyright holder (monopolist) by selling unauthorized copies of the monopolist’s
product. The government is responsible for the anti-piracy enforcement policies
which consist of detecting (monitoring) and penalizing the pirate. The monopolist can
choose a quality and a price that either allows or deters the pirate’s entry. The product
2 The sudden growth in the number of cases filed in 2005 was mainly due to the concerted actions by
the music industry to slow down online music piracy during that period.
3 This graph is adopted from http://chinatrack.typepad.com/blog/2010/12/the-ny-times-ipr-theft-and-
software-piracy-data.html
5. 5
quality is a measure of the degree of innovation and the pirate’s product is an inferior
substitute of the monopolist’s product.4
We show that an increase in the piracy rate unambiguously reduces the
monopolist’s product quality for both entry-allowing (ea) and entry-deterring (ed)
strategies. However, the product quality for the ea-strategy falls at a slower rate than
that for the ed-strategy. This is because under the ea-strategy since the pirate
competes with the monopolist in the market, it is optimal for the latter to maintain a
relatively higher level of product differentiation. On the contrary, ed-strategy being a
limit quality strategy, requires a relatively higher level of lowering of quality in order
to deter the pirate’s entry. Using these results we provide a complete characterization
of the government’s equilibrium enforcement policies for different levels of piracy.
Under the social welfare objective, for any level of piracy, the government’s
optimal enforcement policy induces the monopolist to choose the ed-strategy. Thus
there is no tolerance for piracy, which is always deterred in equilibrium. However, the
enforcement policies cannot prevent the fall in the quality for initial increases in the
threat of piracy beyond which these policies allow the quality to be maintained at a
constant level.
On the contrary, under the innovation objective it is optimal for the government
not to implement any enforcement policy up to some level of piracy, which induces
the monopolist to choose the ea-strategy. Thus piracy is tolerated up to a certain level.
Beyond this level the optimal enforcement policies induce the monopolist to choose
the ed-strategy and allow the quality to be maintained at the previously mentioned
constant level. In this case the equilibrium outcomes coincide with that under the
social welfare objective.
The above results show that under both objectives there is a fall in the product
quality for increases in piracy up to a certain level beyond which the enforcement
policies restrict this fall and maintain the quality at a constant level. These findings
imply that stricter enforcement policies, which are the equilibrium outcomes under
the social welfare objective, do not necessarily stimulate innovation and can at best
restrict its fall.
4
The inferior quality can be viewed as the present discounted value of future service and updates that
are available at a lower price and only come with the purchase of a legitimate product. The qualitative
difference is intended to capture these aspects and is assumed to be common knowledge. See Besen
and Kirby (1989), Takeyama (1994), Banerjee (2003), Lahiri and Dey (2012), Lu and Poddar (2012)
for similar assumption.
6. 6
Furthermore, up to the tolerance level of piracy, the equilibrium quality under
the innovation objective is higher than that under the social welfare objective. This
ensues from the result that the equilibrium quality for the ea-strategy decreases at a
lower rate than that for the ed-strategy. However, for the same range of piracy social
welfare under the innovation objective is less than that under the social welfare
objective. This follows from the trade-off between the welfare gain from a higher
quality and a welfare loss from the higher quality via a higher price.
These findings can explain the decline in copyright cases in the U.S as opposed
to its rise in China as shown in Tables 1 and 2. Since piracy rate is significantly low in
the U.S it perhaps has adopted the innovation objective approach with less stringent
enforcement policy. In contrast China having a much larger piracy rate perhaps has
adopted the social welfare objective approach with a low tolerance for piracy, which
justifies the reduction of piracy rate in China in recent years as shown in Figure 1. 5
2. Literature Review
In a recent paper, Lahiri and De (2012) in the context of end-user piracy shows
that under certain situations lower enforcement increases the incentive to innovate.
This is because end-users faces a constant copying cost that is unresponsive to
changes in the copyright holder’s price and quality, and copyright enforcement policy
is treated as a parameter and used for comparative static analysis. Thus, an increase in
the quality of the copied product forces the copyright holder to innovate more to
create a higher product differentiation and distance it self from the copiers. On the
contrary, the pirating firm in our model reacts positively to any reduction of price and
quality by the innovating firm since the two firms are competitors. Further, we
endogenize the copyright enforcement policy and show how its reponse to increases
in the piracy rate (that is captured by the increase in the quality of the pirated product)
influences the copyright holder’s choice of product quality and hence his incentive to
innovate. Thus our model provides explicit policy recommendation that is required to
incentivise the copyright holder for innovation.
In the context of technological and market uncertainty, Banerjee and Chatterjee
(2010) show that if two firms differ significantly with respect to their R&D
5 As Maskus and Penubarti (1995) and Kim (2004) asserts that Intellectual Property Right protection is
successful in spurring economic growth only after a country has acquired sufficient human capital and
have become significant producers of new technologies.
7. 7
efficiency, then piracy increases the R&D investment of the less efficient firm and
reduces that of the more efficient firm. However, the results in their analysis only
address the private incentives for profitable innovation of a firm.
Jaisingh (2009) finds that piracy generally harms innovation, but in some cases
a stricter copyright protection may also reduce the product quality of the original firm.
Yao (2005) analyses a model of IPR enforcement with an innovating firm and many
commercial pirates. In contrast to our welfare maximizing result where the optimal
enforcement policies always deter piracy, Yao (2005) finds that monitoring is not
necessary for lower level of piracy but is needed to limit piracy when piracy rate
increases. Further, the effectiveness of enforcement on the innovation incentive is not
explicitly studied which is an important contribution of our paper.
In other related studies, Novos and Waldman (1984), in the context of end-user
piracy, find that the adverse effect of piracy causes the innovating firms to spend
more on copyright protection resulting in product quality choices below the socially
optimal level. In a similar vein, Bae and Choi (2006) consider limit pricing (that
deters copying) and copying regimes, and show that the presence of piracy lowers the
quality created by the software developer; and in the copying regime increased
copyright protection reduces social welfare. Qiu (2006) shows that a weak copyright
protection regime results in the development of customized rather than general
software products. In empirical studies, Park and Ginarte (1997), and Ding and Liu
(2009) show that under weak IPR regimes piracy dissuades the innovation firms from
continuing research on the development of new technologies. Thus, all these above
studies broadly suggest although a strict IPR protection is necessary to induce
innovation but it may actually reduce overall welfare of the society. In contrast to this,
our analysis shows while strict IPR protection improves social welfare for a certain
range of piracy but the quality of innovation is compromised.
3. The Model
We consider the market for a digital/information good. There is a single
innovating firm (monopolist), who invests in R&D to develop a product of quality Q
at a cost . The quality of the product is a measure of the degree ofc(Q) =
Q2
2
8. 8
innovation. There is a continuum of consumers whose valuation of the product is
indexed by , which is assumed to follow a uniform distribution and lies in the
interval . Each consumer is assumed to buy at most only one unit of a
product. Using this framework we first discuss the pure monopoly case and then
introduce illegal competition in the form of commercial piracy defined later in the
relevant section. We will use the results for monopoly case when needed in the
analysis later.
3.1. Monopoly results
Using pm to represent the monopolist’s price, utility of a type-θ consumer is,
U(!) =
!Q ! pm, if the consumer buys the product,
0, otherwise.
"
#
$
%$
(1)
The monopolist faces the demand where is the marginal
consumer indifferent between buying and not buying. The monopolist’s profit
function is which on maximization with respect to and Q
yields the following monopoly results.
, , , SW monopoly
= 0.0625 (2)
3.2. Commercial piracy
Let us now consider the situation where there is a firm (pirate) who copies the
monopolist’s product and illegally sells it in the market thereby competing with the
monopolist. This we refer to as commercial piracy.6
The quality of the pirated
product, which is assumed to be an inferior substitute of the monopolist’s product, is
where .7
The government is responsible for the anti-piracy enforcement
policies that consist of monitoring and penalizing the illegal activities of the pirate.
The monitoring rate ! is the probability of detecting the pirate and the monitoring
6
Note that assuming more than one commercial pirate is not going to the change the results
qualitatively as long as pirates are going to respond to the price set by the copyright holder. Assuming
one pirate simplifies the analysis.
7
q can be interpreted as an exogenous index of the poor quality of the pirated product. We set this
bound to ensure that the profits are not indeterminate.
!
! ! [0,1]
Dm =1!!1 =1!
pm
Q
!1
!m = pm !
pm
2
Q
"
#
$
%
&
'!
Q2
2
pm
pm
monopoly
=
1
8
Qmonopoly
=
1
4
!m
monopoly
=
1
32
qQ )1,0(∈q
9. 9
cost is c(!) =
!2
2
. Detection takes place after the pirate has sold his good. The
penalty on the pirate is the fine F. We consider the following sequential game.
Stage 1: The government chooses a monitoring rate ! and a fine F.
Stage 2: The monopolist chooses either an entry-allowing (ea) or an entry-deterring
(ed) price-quality pair, represented by (pm
i
,Qi
) where i = ea, ed .
Stage 3: The pirate makes its entry decision. If it enters then it chooses a price pc .
Stage 4: The consumers make their buying decision.
A consumer enjoys !Q from the consumption of the monopolist’s product and
q!Q from the consumption of the pirated product. Thus the utility of a type-θ
consumer is as follows.
U(!) =
!Q ! pm, if the consumer buys the monopolist's product,
q!Q ! pc, if the consumer buys the pirated product,
0, otherwise.
"
#
$$
%
$
$
(3)
Consumer’s Decision Problem. Consumers choose to buy either the
monopolist’s or the pirate’s product depending on the individual rationality (IR) and
incentive compatibility (IC) constraints. A consumer buys the monopolist’s product if
the following IR and IC conditions are satisfied.
(IR-M)
(IC-M)
Similarly, a consumer buys the pirated product if the following IR and IC conditions
hold.
(IR-C)
(IC-C)
There are two possibilities.
(1) The inequality holds. This implies that that the effective price of the
monopolist’s product !1 =
pm
Q
!
"
#
$
%
& exceeds the effective price of the pirated product
!Q ! pm " 0 #! "
pm
Q
=!1
!Q ! pm " q!Q ! pc #! "
pm ! pc
Q(1! q)
=!2
q!Q ! pc " 0 #! "
pc
qQ
=!3
!Q ! pm < q!Q ! pc "! <
pm ! pc
Q(1! q)
=!2
!1 >!3
10. 10
!3 =
pc
qQ
!
"
#
$
%
&. Now which means . The market is thus
shared between the monopolist and the pirate. Their demand functions are given in
equation (4).
(4)
(2) The inequality holds, which implies that . Thus no one buys the
pirated product, that is, . The demand for the monopolist’s product is given in
equation (5).
(5)
Combining equations (4) and (5) we can write the demand for the monopolist’s
product as
(6)
Suppose the inequality holds, which implies that the market can
be potentially shared between the monopolist and the pirate. In this case we define
piracy (or the rate of piracy) as the pirate’s share of the market, which is .
Lemma 1 summarizes the relationship between q and s and the proof is provided in
the Appendix. Note that proofs of all lemmas and propositions are given in the
Appendix unless mentioned otherwise.
Lemma 1. For any given prices and quality Q, s is increasing in q.
Lemma 1 can be intuitively explained as follows. From the expression of in
the (IC-M) constraint it is evident that is increasing in q. Consequently, there is a
decrease in Dm. From the expression for in the (IR-C) constraint it is evident that
is decreasing in q. Thus !2 !!3 increases, resulting in an increase in Dc . Since an
!1 >!3 ! pm "
pc
q
!2 >!1 >!3 > 0
Dm =1!!2 =1!
pm ! pc
Q(1! q)
Dc =!2 !!3 =
qpm ! pc
qQ(1! q)
!1 !!3 pm !
pc
q
Dc = 0
Dm =1!!1 Dc=0 =1!
pm
Q
Dm =
1!!2 =1!
pm ! pc
Q(1! q)
, if !1 "!3,
1!!1 =1!
pm
Q
, if !1 #!3.
$
%
&
&
'
&
&
!2 >!1 >!3 > 0
s =
Dc
Dc + Dm
!2
!2
!3
!3
11. 11
increase in q reduces Dm and increases Dc hence, the pirate’s market share s is
monotonically increasing in q. This positive monotonic relationship allows us to refer
to an increase in q as an increase in piracy.
In the next section we analyse the ea and ed strategies. In that context we also
show that in the case of commercial piracy it is only possible to have , that is,
!1 >!3 in equilibrium.
4. Analysis of ea and ed strategies
We first determine the monopolist’s equilibrium ea and ed-strategies and then
perform the comparative static analyses, which are used for determining the optimal
enforcement policies and the impact on the quality of innovation.
4.1. Analysis of ea-strategy
In this case the monopolist behaves as a first mover and commits to a price and
quality. From the demand functions given in equation (4) we get the profit functions
as follows.
(7)
Substituting the pirate’s reaction function pc =
qpm
2
in the monopolist’s profit
function and maximizing it with respect to Q and yields the equilibrium price and
the quality for the ea-strategy, which are,
(pm
ea
, Qea
) =
(1! q)2
2(2 ! q)2
,
(1! q)
2(2 ! q)
"
#
$
%
&
' . (8)
Observe from equation (8) that pm
ea
= 2(Qea
)2
.
The pirate’s equilibrium price is pc
ea
=
q(1! q)2
4(2 ! q)2
. From the expressions of pm
ea
and pc
ea
observe that the conditions and !2 >!3 !
qpm " pc
qQ(1" q)
> 0
pm !
pc
q
!m = pmDm !c Q( )= pm !
pm
2
! pm pc
Q(1! q)
!
Q2
2
!c = pcDc !"F =
qpm pc ! pc
2
c
qQ(1! q)
!"F
pm
!1 >!3 ! pm >
pc
q
12. 12
always hold in equilibrium. This is because positively adjusts to changes in
following the reaction function. The pirate’s profits is,
!c
ea
=
q(1! q)2
8(2 ! q)2
!"F . (9)
Using equation (9) we now discuss the following two types of entry deterrence.
(i) Policy Induced Blocked Entry: The pirate will not enter for a given q and F, if
. So is the policy induced
blocked entry condition.
(ii) Blockaded Entry: This means that the monitoring rate and fine are such that the
monopolist can choose the monopoly quality and price without any threat of entry.
Using and from equation (2) and substituting it in the
pirate’s reaction and profit functions we get and So for
any q and F, the blockaded entry condition is !c =
q
64(1! q)
!"F " 0 which on
rearrangement yields ! !!max =
q
64(1" q)F
.
Now !max >! because 0
)2)(1(64
)2)(1(6
3
3
max >
−−
−−+
=−
qqF
qqqq
αα . For the rest of the
analysis we will only consider the monitoring rate in the range because
monitoring beyond does not change the monopoly outcome.
In the monitoring rate range ! ! [0,!) the pirate enters and the market is
shared between the two competitors. Therefore, the monopolist’s and the pirate’s
demand functions are Dm =1!!2 =1!
pm
ea
! pc
ea
Qea
(1! q)
and Dc =!2 !!3 =
qpm
ea
! pc
ea
qQea
(1! q)
. In the
range though there is policy induced blocked entry but it is not optimal
for the monopolist to charge the monopoly price and produce the monopoly quality
because then the pirate will enter. Therefore, in this monitoring rate range the
monopolist’s price and product quality are the same as given in equation (8). So his
demand function is Dm =1!!1 =1!
pm
ea
Qea
and Dc = 0 . Using these demand functions
pc pm
!c =
q(1! q)2
8(2 ! q)3
!"F " 0 # ! !! =
q(1" q)2
8F(2 " q)3
! !!
pm
monopoly
=
1
8
Qmonopoly
=
1
4
pc =
q
16
!c =
q
64(1! q)
!"F.
! ! [0,!max ]
!max
! ! [!,!max )
13. 13
we get the monopolist’s and the pirate’s profits for the ea-strategy which are given in
equations (10) and (11).
!m
ea
=
!m
ea
(" <") =
(1! q)2
8(2 ! q)2
, for " " [0,"),
!m
ea
(" #") =
(1! q)2
(2 + q)
8(2 ! q)2
, for " " [","max ).
$
%
&
&
'
&
&
(10)
!c
ea
=
!c
ea
(" <") =
q(1! q)2
8(2 ! q)3
, for " " [0,"),
!c
ea
(" #") = 0, for " " [","max ).
$
%
&&
'
&
&
(11)
Observation1. !m
ea
(" !") is greater than !m
ea
(" <") (!m
ea
(" !") > !m
ea
(" <") ).
The proof follows from equation (10), which shows !m
ea
(" !") = (2+ q)!m
ea
(" <") .
The consumer surplus for the ea strategy is
in
the range and (!Qea
! pm
ea
)d! =
Qea
2!1
1
" ! 2(Qea
)2
+ 2(Qea
)3
in the range
),[ maxααα ∈ . So the consumer surplus for the range [ ]max,0 αα ∈ is given in equation
(12) and this we will need for the social welfare analysis in Section 5.
CSea
=
(3+ q)Qea
8
!
(2 + q)(Qea
)2
2
+
q(Qea
)3
2
, for ! " [0,!),
Qea
2
! 2(Qea
)2
+ 2(Qea
)3
, for ! " [!,!max ).
#
$
%
%
&
%
%
(12)
An important implication of commercial piracy is that the pirate’s price
positively adjusts to changes in the monopolist’s price following the reaction
function, hence we see that the condition !1 >!3 always hold in equilibrium. This is
in contrast to end-user piracy where the end-user incurs a fixed copying cost r that do
not respond to changes in , as shown in Lahiri and De (2012). This allows the
monopolist to choose a price such that which deters copying. However, this is
CSea
= (!Qea
!2
1
! " pm
ea
)d! + (q!Qea
!3
!2
! " pc
ea
)d! =
(3+ q)Qea
8
!
(2 + q)(Qea
)2
2
+
q(Qea
)3
2
! ! [0,!)
pc
pm
pm
!1 !!3
14. 14
not possible in the case of commercial piracy, therefore entry-deterrence is executed
differently as discussed in the next subsection.
4.2. Analysis of ed-strategy
The ed-strategy is a limit price or a limit quality strategy such that the pirate
cannot enter. This is achieved in the following manner. By substituting the pirate’s
reaction function in his own profit function (!c ), the monopolist chooses (or Q)
such that for any given Q (or ), the pirate’s profit is zero (!c = 0 ), which prevents
his entry. This process yields . Being the sole supplier, the
monopolist’s profit function is !m = (1!"1)pm = 1!
pm
Q
"
#
$
%
&
' pm . Substituting the
expression for Q in this profit function and maximizing it with respect to gives us
the equilibrium price quantity pair for the ed-strategy as given in equation (13).
(pm
ed
,Qed
) =
2(1! q)
2
3
!
2
3
2
3
F
2
3
q
2
3
,
(1! q)
1
3
!
1
3
F
1
3
q
1
3
"
#
$
$$
%
&
'
''
(13)
Notice that pm
ed
= 2(Qed
)2
and at we get .
That is at the monopoly outcome is restored. Using 2
)(2 eded
m Qp = we can write
the monopolist’s profit and the consumer surplus ( ) for the ed-strategy as;
(14)
Lemma 2 summarizes the properties of Qed
and with respect to and F.
Lemma 2. For any q, Qed
is increasing in and F. For any q and F, is
monotonically increasing and concave in in the interval . For any
given q and ! , !m
ed
is increasing in F.
pm
pm
Q =
qpm
2
4!F(1! q)
pm
!max =
q
64F(1! q)
Qed
= Qmonopoly
=
1
4
!max
CSed
!m
ed
=
3(Qed
)2
2
! 4(Qed
)3
,
CSed
= ("Qed
"1
ed
1
" ! pm
ed
)d" =
Qed
2
! 2(Qed
)2
+ 2(Qed
)3
.
!m
ed
!
! !m
ed
! ! ! [0,!max ]
15. 15
Intuitively, an increase in the monitoring rate or the fine raises the pirate’s entry cost,
which reduces the threat of entry. Consequently, the monopolist produces a higher
quality product and sells it at a higher price, which in turn increases the profit.
4.3. Comparative static analysis
In this section we perform several comparative static analysis beginning with
and with respect to and F. From equation (10) we see that is
independent of ! because and are independent of since detection takes
place after the sell of the pirated good. From Observation 1 we know
!m
ea
(" !") > !m
ea
(" <") . Let and be the monitoring rates at which
!m
ea
(" <") = !m
ed
( ˆ"1) and !m
ea
(" !") = !m
ed
( ˆ"2 ) . For any q and F, a ranking of ,
and Qed
evaluated at ˆ!1 , ! , and ˆ!2 , ( , , and ) are given in
Lemma 3. This helps us to rank ˆ!1 , ! , and ˆ!2 which will be used in determining the
monopolist’s dominant strategies in the different monitoring rate ranges. Lemma 3
also summarises the comparative static analysis of ˆ!1 , ! , ˆ!2 and !max with respect
to F.
Lemma 3
(i) Comparing to which is evaluated at ˆ!1 , ! , and yields
. The inequality holds.
(ii) , , and are decreasing in F.
Lemma 3 can be intuitively explained as follows.
1. Since is increasing in in the range , (Lemma 2) and
!m
ea
(" !") > !m
ea
(" <") , hence, intersects !m
ea
(" !") at a higher monitoring
rate than the one at which intersects !m
ea
(" <") . This explains . From
Lemma 2 we know that Qed
is increasing in ! . Hence, Qed
( ˆ!2 ) > Qed
( ˆ!1) .
!m
ea
!m
ed
! !m
ea
Qea
pm
ea
!
ˆ!1
ˆ!2
Qea
Qed
( ˆ!1) Qed
(!) Qed
( ˆ!2 )
Qea
Qed
ˆ!2
Qea
= Qed
( ˆ!2 ) = Qed
(!) > Qed
( ˆ!1) ! = ˆ!2 > ˆ!1
ˆ!1 ! = ˆ!2 !max
!m
ed
! ! ! [0,!max ]
!m
ed
!m
ed
ˆ!2 > ˆ!1
16. 16
2. At the monopolist’s market for the ed-strategy (1!!1 ) exceeds that for the ea-
strategy (1!!2 ) since !2 >!1 .8
So for the equality !m
ea
(" <") = !m
ed
( ˆ"1) to hold it
must be that at ˆ!1 , . Hence, at is less than .
3. By definition ! is the lower bound for the policy induced blocked entry and at ,
!m
ea
(" !") = !m
ed
( ˆ"2 ) . Thus at ! and at , the monopolist’s market for both ea and
ed strategies is 11 θ− . Hence, !m
ea
(" !") = !m
ed
( ˆ"2 ) = !m
ed
("). This explains the
equality ! = ˆ!2 . Since the market coverage and the profits are equal hence the
qualities are also the same that is, Qed
( ˆ!2 =!) = Qea
.
4. An increase in F increases the pirate’s entry cost, which allows the monopolist to
deter the entry at a higher price and quality thereby generating a higher profit. So an
increase in F shifts up the thereby reducing , , and .
We now use Lemmas 2 and 3 to characterise the equilibrium price and
quality . This result is summarized in Proposition 1.
Proposition 1
The equilibrium price-quality pair for any q and F is
The proof of Proposition 1 follows from in Lemma 3(i), and being
increasing in ! as mentioned in Lemma 2. The monopolist’s profit functions for the
ea and ed strategies are diagrammatically represented in Figure 2 using the inequality
. From Figure 2 we see that for ea-strategy is dominant and
hence the equilibrium price-quality combination is (pm
*
,Q*
) = (pm
ea
,Qea
). For
ed- strategy is weakly dominant and so the equilibrium price-quality
combination is .
8
Note that 31 θθ > implies 12 θθ > .
ˆ!1
pm
ea
> pm
ed
( ˆ!1) Qed
ˆ!1 Qea
ˆ!2
ˆ!2
!m
ed
ˆ!1 ! = ˆ!2 !max
pm
*
Q*
(pm
*
,Q*
) =
(pm
ea
, Qea
) for ! ! [0, ˆ!1),
(pm
ed
, Qed
) for ! ! [ ˆ!1,!max ].
"
#
$
%$
! = ˆ!2 > ˆ!1
!m
ed
! = ˆ!2 > ˆ!1 ! ! [0, ˆ!1)
! ! [ ˆ!1,!max ]
(pm
*
,Q*
) = (pm
ed
, Qed
)
17. 17
,
!m
monopoly
Figure 2. Diagrammatic representation of and using
Having characterised the equilibrium price-quality combination let us now
proceed with some of the comparative static analysis on the equilibrium quality Q*
and the monopolist’s profits. These results are summarized in Proposition 2.
Proposition 2
(i) An increase in piracy (increase in q) reduces the incentive to innovate, that is,
reduces Q*
. Qea
decreases at a decreasing rate while Qed
decreases at an increasing
rate as q increases.
(ii) An increase in q reduces the monopolist’s profits namely , and .
To understand the intuition for Proposition 2 let us consider the monopolist’s
and pirate’s demand which are Dm
ea
=
1
2
and Dc
ea
=
1
2(2 ! q)
evaluated at .
The monopolist’s demand is invariant to changes in q, while pirate’s demand is
increasing in q. So the monopolist’s optimal response to an increase in q is to reduce
!m
ea
!m
ed
!m
ed
!m
ea
(" !")
!m
ea
(" <")
ˆ!1
ˆ!2 = ! !max !
!m
ea
!m
ed
! = ˆ!2 > ˆ!1
!m
ea
(" <") !m
ed
(pm
ea
,Qea
)
18. 18
Qea
at a decreasing rate that maintains the demand at Dm
ea
=
1
2
and at the same time
creates sufficient product differentiation.
For the ed-strategy, the monopolist’s demand is ededed
m QD 211 1 −=−= θ . An
increase in q increases the possibility of the pirate’s entry due to a higher demand for
its product. Thus entry deterrence requires the monopolist to expand his market share
by lowering !1
ed
which is achieved by a lowering of Qed
at an increasing rate. Thus
the product differentiation in the case of ed-strategy is lower than that for ea-strategy.
Proposition 2 suggests that an increase in the piracy rate unambiguously reduces
the monopolist’s incentive to innovate. In contrast, Lahiri and Dey (2012) in the
context of end-user piracy shows a higher rate of piracy increases the incentive to
innovate when pirates are accommodated.9
In their model, the copying cost is fixed.
Thus, an increase in the piracy rate forces the copyright holder to innovate more to
create a higher product differentiation and distance itself from the copiers, so that it
can recover some of its loss in profit from piracy.
5. Social welfare analysis
Social welfare, defined as the sum of the profits of the monopolist and the
pirate, the consumer surplus and the revenue from monitoring is,
SWi
= !m
i
+!c
i
+CSi
+"F !
"2
2
where i ! {ea, ed}. (15)
The term !F !
!2
2
is the expected revenue from monitoring.
From Proposition 1 and Figure 2 we know that for any q and F, ea is the
dominant strategy in the interval and ed is the weakly dominant strategy
in the interval . Correspondingly, we have and as the two
social welfare functions for the intervals and . So the social
welfare function (SW) for the monitoring rate range is,
SW =
SW ea
, for ! ! [0, ˆ!1),
SW ed
, for ! ! [ ˆ!1,!max ].
"
#
$
%$
(16)
9
In Lahiri and Dey (2012) the rate of piracy increases due to the reduction in enforcement.
! ! [0, ˆ!1)
! ! [ ˆ!1,!max ] SW ea
SW ed
! ! [0, ˆ!1) ! ! [ ˆ!1,!max ]
! ! [0,!max ]
19. 19
We analyse two kinds of government objectives. One, the government chooses
the enforcement policy that maximizes social welfare. We refer to this as the social
welfare objective. Two, the government chooses the enforcement policy that supports
the “best” possible environment for innovation. We refer to this as the innovation
objective. We then compare the results for these two objectives to understand their
contribution in reducing copyright violation and the incentive to innovate. This
requires an analysis of the various properties of and functions that are
presented in the next two subsections.
5.1. Analysis of
The relevant components of that is defined over the interval
are, , , , and . Using equations (10), (11)
and (12) and from the definition of as given in equation (15) we get,
SW ea
(!) =
q3
+ 2q2
!11q+8
16(2 ! q)3
!
!2
2
. (17)
Let !ea*
denote the monitoring rate that maximizes . The results for !ea*
and the property of SW ea
(!ea*
) with respect to q are summarized in Lemma 4.
Lemma 4
(i) !ea*
= 0 maximizes .
(ii) SW ea
(!ea*
= 0) is strictly concave with respect to q and is maximized at
. SW ea
(!ea*
= 0,q = 0.1569297) = 0.0631604 and
.
The intuition follows from the fact that the monopolist’s profit, consumer
surplus and the pirate’s revenue are independent of because and are
independent of since detection takes place after the sell of the pirated good. The
expected penalty being a transfer payment is absent in . So appears
in only through the monitoring cost thereby making a decreasing
function of . This explains the result in !ea*
= 0 . Now a change in q has two
SW ea
SW ed
SW ea
SW ea
! ! [0, ˆ!1)
!m
ea
(" <") !c
ea
(" <") CSea
(! <!) !F !
!2
2
SWi
SW ea
SW ea
(!)
q = 0.1569297
Qea
(q = 0.1569297) = 0.2287135
! Qea
pm
ea
!
(!F) SW ea
(!) !
SW ea
(!) SW ea
(!)
!
20. 20
opposing effects on . A fall in q lowers (Proposition 2) resulting in a
welfare loss. However, a fall in q also lowers resulting in a welfare gain via a
higher consumer surplus. These two opposing effects explain the concavity of
which attains its highest value at .
5.2. Analysis of
In case of the ed-strategy the pirate cannot enter, hence the pirate’s profit and
the government’s revenue are and respectively. Substituting the
expressions for and from equation (14) and using equation (15) we get
. (18)
Let !ed
be the solution to
dSW ed
d!
= 0 . Using
dQed
d!
=
1
3!
(1! q)!F
q
"
#
$
%
&
'
1
3
=
Qed
3!
, we get,
dSW ed
(!)
d!
=
1
2
!Qed
! 6(Qed
)2"
#
$
%
&
'
dQed
d!
!! =
1
2
!Qed
! 6(Qed
)2"
#
$
%
&
'
Qed
3!
!! = 0 . (19)
From equation (19) observe that
1
2
!Qed
! 6(Qed
)2
> 0 , that is Qed
< 0.21713
must hold for the first order condition to be satisfied. Recall that at ,
Qed
= 0.25 which implies that because is monotonically increasing in
in the interval . The condition Qed
(!ed
) < 0.21713 also ensures that
the second order condition,
d2
SW ed
(!)
d!2
= !1!12Qed
( ) dQed
d!
"
#
$
%
&
'
2
+
1
2
!Qed
! 6(Qed
)2"
#
$
%
&
'
d2
Qed
d!2
!1< 0,
is satisfied at !ed
because !1!12Qed
( )< 0 ,
1
2
!Qed
! 6(Qed
)2
> 0 , and
d2
Qed
d!2
< 0 .
Using equation (19) we get
(!ed
)2
=
1
2
!Qed
! 6(Qed
)2"
#
$
%
&
'
Qed
3
. (20)
Substituting this in equation (18) we get the value of SW ed
at !ed
which is,
SW ed
(!ed
) =
5Qed
! 4(Qed
)2
!12(Qed
)3
12
. (21)
SW ea
(!) Qea
pm
ea
SW ea
(!ea*
= 0) q = 0.1569297
SW ed
!c
ed
= 0
!!2
2
!m
ed
CSed
SW ed
= CSed
+!m
ed
!
"2
2
=
Qed
2
!
(Qed
)2
2
! 2(Qed
)3
!
"2
2
! =!max
!ed
<!max Qed
! ! ! [0,!max ]
21. 21
We next perform the comparative static analysis of , , , and
with respect to F. This will allow us to determine how , the peak of
the curve given by , and the optimal quality level at given by
responds to changes in F. The result is summarized in Lemma 5.
Lemma 5. An increase in F:
(i) increases for Qed
< 0.21713 and decreases for Qed
> 0.21713;
(ii) increases for Qed
(!ed
) < 0.21713 ;
(iii) increases !ed
for Qed
< 0.1201265 and decreases !ed
for Qed
> 0.1201265 ;
(iv) increases since at Qed
(!ed
) < 0.21713 .
Intuitively, an increase in F increases Qed
(Lemma 2) and hence pm
ed
. While the
higher quality results in a welfare gain, the higher price results in a welfare loss via a
lower consumer surplus. This explains the concavity of with respect to
and explains parts (i) and (ii). Part (iii) follows from Lemma 2 that Qed
is increasing
in ! and F. When Qed
is rather low, then an increase in F has a positive effect on
!ed
in order to boost Qed
. Once the critical level Qed
= 0.120126527778 is reached
then further increase in F affects !ed
inversely. Part (iv) can be explained using part
(iii). If the effect of an increase in F on !ed
is positive, then clearly Qed
increases
because the latter is increasing in both ! and F. Suppose the effect of an increase in
F on !ed
is negative. Then the direct positive effect of an increase in F on Qed
outweighs the indirect negative effect on Qed
via the decrease in !ed
resulting in an
overall increase in Qed
.
An important implication of Lemma 5 is that the highest possible Qed
that can
be sustained by !ed
is strictly less than 0.21713, that is Qed
= 0.21713!! . For purely
expositional simplicity instead of considering Qed
= 0.21713!! we assume that
Qed
= 0.217 . The results are qualitatively unaffected by this assumption. We will use
this assumption to characterise the monitoring rate that maximizes SW ed
.
SW ed
!ed
SW ed
(!ed
)
Qed
(!ed
) SW ed
SW ed
SW ed
(!ed
) !ed
Qed
(!ed
)
SW ed
SW ed
SW ed
(!ed
)
Qed
(!ed
) !ed
SW ed
Qed
22. 22
Recall that SW ed
is defined for the interval and we have shown
that !ed
<!max . Now !ed
maximizes SW ed
only if the inequality !max >!ed
! ˆ!1
hold. If the inequality !ed
< ˆ!1 <!max hold then ˆ!1 maximizes SW ed
. A complete
characterization of !ed*
, the monitoring rate that maximizes SW ed
, is provided in
Lemma 6.
Lemma 6
(i) For any q that satisfies qq ˆ0 << , where ˆq = 0.047117375 , !ed*
= ˆ!1 . For a given
q, an increase in F has no effect on Qed
( ˆ!1) and increases SW ed
( ˆ!1) only through
the reduction in ˆ!1 .
(ii) For any q that satisfies q ! ˆq, !ed*
=!ed
= 0.005805802 is the unique monitoring
rate that maximizes SW ed
.
By definition, ˆ!1 is the monitoring rate that satisfies !m
ea
(" <") = !m
ed
. Thus for
every q, there is a unique Qed
that satisfies this equality because for any given q there
is a unique value of !m
ea
(" <") since !m
ea
(" <") =
(1! q)2
8(2 ! q)2
.10
Then using the
expression for Qed
as given in equation (13) we can solve for ˆ!1 once a fine F is
specified. An increase in F only reduces ˆ!1 but has no effect on as shown in
Lemma 3 because for any given q, since !m
ea
(" <") is fixed hence the Qed
, which
solves !m
ea
(" <") = !m
ed
, is also fixed. Intuitively, the increase in Qed
due to an
increase in F is outweighed by the decrease in Qed
due to a fall in ˆ!1 . Now for q < ˆq ,
Qed
( ˆ!1) exceeds Qed
= 0.217 which is the highest quality that can be sustained by
!ed
as shown in Lemma 5. This means that ˆ!1 exceeds !ed
because Qed
is
increasing in ! as shown in Lemma 2. Hence ˆ!1 maximizes SW ed
because it is
monotonically decreasing in ! when ! exceeds !ed
.
At q = ˆq, Qed
= 0.217 is the solution to the equality !m
ea
(" <") = !m
ed
. This
means ˆ!1 becomes equal to !ed
and hence for q ! ˆq , is maximized at !ed
10 We use the expression for !m
ed
as given in equation (14) to solve for Qed
.
! ! [ ˆ!1,!max ]
Qed
SW ed
23. 23
because it satisfies the inequality ˆ!1 !!ed
<!max . From Lemma 5 we know that SW ed
attains it’s highest value when Qed
= 0.217 . Substituting this in the expression for
!ed
as given in equation (20) gives us !ed
= 0.005805802. So for any increase in q in
excess of ˆq , the fine also increases to preserve Qed
= 0.217 and !ed
= 0.005805802
by following the expression for Qed
as given in equation (13).
5.3. Optimal enforcement policies
We first analyse the social welfare objective and then the innovation objective.
We then compare the results for the above two objectives to understand their
contribution in reducing copyright violation and the incentive to innovate.
5.3.1. Social Welfare Objective
From Lemmas 4 and 6 which characterises the monitoring rates that maximizes
and we see that the government’s choice is between and
for any q that satisfies where . For any q that
satisfies the choice is between and . A
complete characterization of the optimal enforcement policy consisting of a
monitoring rate (!SW
) and a fine, F under the social welfare objective is summarized
in Proposition 3.
Proposition 3
(i) For any q that satisfies 0 < q < ˆq where 047117375.0ˆ =q , the socially optimal
enforcement policy is the monitoring rate !SW
=!ed*
= ˆ!1(q) and a fine F in excess of
F(q) which satisfies );0())(),(ˆ( *
1 qSWqFqSW eaeaed
== αα . In this case the ed-
strategy with quality )ˆ( 1αed
Q is the equilibrium and )ˆ( 1αed
Q <
)2(2
1
q
q
Qea
−
−
= .11
11 If q is “very small”, specifically 00000001.0<q , the optimal monitoring rate is 0*
== eaSW
αα ,
)2(2
1
q
q
Qea
−
−
= . For very low level of piracy ( 0000001.0<q ) the outcomes for the ea and ed
strategies are almost same as the monopoly outcome in the absence of piracy (see section 2.1 for pure
monopoly outcome). The presence of monitoring cost makes ed
SW to be less than ea
SW resulting in
no monitoring as the socially optimal outcome and there is piracy in equilibrium.
SW ea
SW ed
!ea*
= 0
!ed*
= ˆ!1 q < ˆq ˆq = 0.047117375
q ! ˆq !ea*
= 0 !ed*
=!ed
= 0.005805802
24. 24
(ii) If qq ˆ≥ then the socially optimal monitoring rate is 005805802.0*
== edSW
αα .
In this case ed-strategy with the quality 217.0=ed
Q is equilibrium. For each q there
is a unique F that maintains the equilibrium pair 005805802.0=SW
α and
Qed
= 0.217 ; and 06450202.0)217.0,005805802.0( *
=== ededed
QSW α .
Proposition 3(i) can be explained as follows. An increase in piracy up to ˆq
causes Qea
to fall from 0.249999999 to 0.243968277 and Qed
to fall from
0.249999999 to 0.217. This is consistent with Proposition 2, which shows that an
increase in piracy reduces Qed
at a faster rate than Qea
. In the range 0 < q < ˆq , SW ea
is increasing in q (Lemma 4) and SW ed
is increasing in Qed
for Qed
< 0.217 (Lemma
5). However, the increase in SW ed
is higher than the increase in SW ea
because at ˆq ,
Qea
= 0.243968277 is relatively closer to the monopoly quality level compared to
Qed
. This implies that the impact of piracy on SW ea
via the pirate’s profit and the
consumer surplus is relatively quite low. Thus, CSed
exceeds CSea
+!c
ea
thereby
leaving room for the government to choose an F and ˆ!1 such that SW ed
exceeds
SW ea
. 12
From Lemma 6 we know that for a given q an increase in F only reduces ˆ!1
but has no effect on )ˆ( 1αed
Q which means that there is no effect on !m
ed
( ˆ"1) and
CSed
( ˆ!1). Thus an increase in F increases SW ed
only by reducing the monitoring
cost. So for any q there is a fine F(q) at which ˆ!1 is such that the two social welfares
are equal. Hence, any fine in excess of F(q) will result in SW ed
dominating SW ea
.
Proposition 3(ii) considers the range qq ˆ≥ where we know from Lemma 6 that
!ed*
=!ed
= 0.005805802 is attainable and Qed
can be maintained at the level
Qed
= 0.217 . Substituting these in the expression for SW ed
as given in equation (18)
we get SW ed
( Qed
= 0.217,!ed*
= 0.005805802) = 0.06450202 which exceeds the
highest possible value of SW ea
which is SW ea
(!ea*
= 0,q = 0.1569297) = 0.0631604.
12 Since at ˆ!1 the profits for the ea and ed strategies are the same hence, we only need to consider
CSea
+!c
ea
and CSed
!
ˆ!1
2
2
to compare SW ea
and SW ed
.
25. 25
As q increases in this range we know from Lemma 6 that F must also increase to
maintain !ed*
=!ed
= 0.005805802 and Qed
= 0.217 .
Proposition 3 implies that almost for the entire range of q, the socially optimal
enforcement policies induces the monopolist to choose the ed-strategy that deters
piracy. However, these policies cannot prevent the fall in the optimal quality for
initial increases in the piracy, beyond which the enforcement qualities maintain the
quality at a constant level. On the contrary, optimal social welfare SW ed
increases as
q increases till ˆq and thereafter remains at the constant level SW ed
= 0.06450202 .
This is because from Lemma 4 we know that for 0 < q < ˆq , SW ea
is increasing in q
and from Proposition 3 (i) we know that in this range SW ed
exceeds SW ea
. The
explanation for when q ! ˆq, follows from the result that the quality and the
monitoring rate are maintained at a constant level. This behaviour of SW ed
is
diagrammatically represented in Figure 3. SW ed
is the optimal social welfare as
indicated by the bold curve dominates SW ea
which is represented by the dotted curve.
SW SW ed
SW ea
SW ed
= 0.06450202
SWea
(!ea*
= 0) =
0.0631604
q
Figure 3: Optimal social welfare and piracy rate
Equating Qea
=
1! q
2(2 ! q)
to Qed
= 0.217 yields q = ˆˆq = 0.233. Since Qea
is
decreasing in q hence, Qea
> Qed
= 0.217 for q < ˆˆq = 0.233. An important implication
of this is that though social welfare is maximized by choosing ˆ!1 (for q < ˆq) and
!ed*
= 0.005805802 (for q ! ˆq) and pirate’s entry is deterred, but the quality of
SW ed
ˆq q = 0.1569297
26. 26
innovation is compromised till q = ˆˆq = 0.233. That is, the quality of innovation for the
ea-strategy exceeds that for the ed-strategy till the piracy level reaches q = ˆˆq = 0.233.
Thus there is a trade-off between social welfare maximization and innovation up to a
certain level of piracy. This motivates us to analyse the innovation objective of the
government, which is presented in the next subsection.
5.3.2. Innovation objective and comparison with social welfare objective
Let us consider the situation where the government’s objective is to choose a
monitoring rate denoted as !Q
and a fine F that maximizes innovation. The result is
summarized in Proposition 4. The proof follows from the discussion at the end of the
previous subsection.
Proposition 4
(i) If , then Qea
=
(1! q)
2(2 ! q)
is the socially optimal quality, !Q
=!ea*
= 0 is
the optimal monitoring rate, and there is piracy in equilibrium.
(ii) If , then Qed
= 0.217 is the socially optimal quality,
!Q
=!ed*
= 0.005805802 is the optimal monitoring rate, and there is no piracy in
equilibrium. For each q there is a unique F that maintains the equilibrium pair
!Q
= 0.005805802 and Qed
= 0.217 .
The following explanation offers an intuition for Proposition 4. As observed
previously in Proposition 2, although Qea
falls with increase in piracy, but it falls at a
decreasing rate. Thus enough innovation still happens in the presence of low levels of
piracy, hence enforcement is not necessary. However, when the piracy rate exceeds a
certain level, then not monitoring results in a continuous decrease in innovation. To
arrest this decline in innovation, it becomes optimal for the government to have
enforcement policies that deter piracy and maintains the quality at a certain level.
Comparing Propositions 3 and 4 we see that for q ! ˆˆq = 0.233 the equilibrium
enforcement policies and its outcome are identical for the social welfare objective and
innovation objective. However, under the social welfare objective in general piracy is
q < 0.233
q ! 0.233
27. 27
not at all tolerated. In contrast, under the innovation objective, piracy is tolerated for
q < ˆˆq = 0.233, and there is no monitoring. In this case while welfare is compromised
but a higher level of innovation is preserved. These findings are summarized in
Proposition 5 and diagrammatically presented in Figure 4.
Proposition 5
While piracy is generally never tolerated under the social welfare objective, there is
tolerance of piracy up to q < ˆˆq = 0.233 under the innovation objective. This results in
a higher quality of innovation compared to that under the social welfare objective.
Social welfare and innovation objectives result in identical outcomes only when the
piracy level satisfies q ! ˆˆq = 0.233.
Q Qed
(!SW
= ˆ!1) Qea
(!Q
= 0)
Qed
(!SW
=!ed*
) = 0.217
Qed
(!SW
=!Q
=!ed*
) = 0.217
047117375.0ˆ =q ˆˆq = 0.233 q
Figure 4: Quality comparison under social welfare and innovation objectives
In Figure 3, the blue and the green curves show the equilibrium quality under the
social welfare objective. Up to ˆq the equilibrium monitoring rate is !SW
= ˆ!1 and the
equilibrium quality is Qed
(!SW
= ˆ!1). Beyond ˆq the equilibrium monitoring rate is
!SW
=!ed*
and the equilibrium quality is Qed
(!SW
=!ed*
) = 0.217 . Under the
innovation objective the equilibrium quality up to ˆˆq is Qea
(!Q
= 0) as indicated by
28. 28
the red curve. There is no monitoring up to ˆˆq beyond which the outcomes for the two
objectives are identical as indicated by the green segment. The convex blue and the
concave red curves reflect that Qed
falls at an increasing rate while Qea
falls at a
decreasing rate as q increases which is consistent with Proposition 2.
6. Conclusion
In this paper, we used a strategic entry deterrence framework to study how
equilibrium enforcement policies respond to changes in the level of piracy, and their
effects on innovation. These were examined under the government’s social welfare
maximizing objective and innovation maximizing objective and outcomes for these
two objectives were compared. The incentive to innovate is measured by the quality
of the monopolist’s product and copyright enforcement policy is captured by the
government’s monitoring of piracy and the penalty it imposes on the pirating firm.
We show that the piracy rate or the incidence of piracy monotonically increases
as the quality of the pirated good improves. This monotonic relationship allowed us to
proxy the quality of the pirated good for piracy rate. An increase in piracy
unambiguously reduced the incentive to innovate and the decrease in the quality of
innovation under the entry-deterrence strategy is faster than that under the entry-
allowing strategy.
Under the government’s social welfare objective we showed that it is optimal
not to tolerate piracy and the equilibrium enforcement policies induce the monopolist
to choose the entry-deterrent strategy. These policies are ineffective in preventing the
fall in innovation for initial increases in piracy, beyond which innovation is
maintained at a constant level and its fall is arrested. While piracy is never tolerated
under the social welfare objective, the innovation objective allowed piracy up to a
critical level before resorting to the enforcement strategy that induces entry-
deterrence and restricts any further fall in innovation.
We find that only for higher levels of piracy both social welfare and innovation
objectives yield identical results in the sense that both quality and social welfare are
maintained at a constant level. But for lower levels of piracy, there is a clear trade-off
between the two objectives. Specifically, up to the level where piracy is tolerated,
social welfare is lower but quality is higher under the innovation objective compared
to that under the social welfare objective.
29. 29
References
Bae, S. H. and Choi, J. P., (2006), “A model of piracy,” Information Economics and
Policy, 18 (3), 303-320.
Banerjee, D. S., (2003), “Software piracy: a strategic analysis and policy
instruments,” International Journal of Industrial Organization, 21, 97-127.
Banerjee, D. S. and Chatterjee, I., (2010), “The impact of piracy on innovation in the
presence of technological and market uncertainty” Information Economics and
Policy, 22, 391–397
Besen, S.M. and Kirby, S. N., (1989), “Private copying, appropriability, and optimal
copying royalties,” Journal of Law and Economics, 32; 255-280.
BSA, (2011) Global Software Piracy Study, Business Software Alliance (BSA).
Ding, C.G. and Liu, N., (2009), “Productivity changes of Asian economies by taking
into account software piracy”, Economic Enquiry 47 (1), 135-145.
Jaisingh, J. (2009), “Impact of piracy on innovation at software firms and implications
for piracy policy”, Decision Support Systems, 46, 763–773.
Kim, L., (2004), “The multifaceted evolution of Korean technological capabilities and
its implications for contemporary policy”, Oxford Development Studies, 323,
341-363.
Lahiri, A., and Dey, D., (2012), “Effects of Piracy on Quality of Information Goods”,
Management Science, 59, 245-264.
Maskus, K.E., and Penubarti, M., (1995), “How trade related are intellectual property
rights?, “Journal of International Economics”, 39, 227-248.
Novos, I. and M. Waldman, (1984), “The effects of increased copyright protection: an
analytical approach,” Journal of Political Economy, 92, 236-246.
Nguyen, X. T., (2011), “The China we hardly know: revealing the new china’s
intellectual property regime”, Saint Louis University Law Journal, 55, 773-810.
Park, W. G. and Ginarte, J. C., (1997), “Intellectual Property Rights and Economic
Growth”, Contemporary Economic Policy, Vol. XV, July, 51-61.
Qiu, L.D., (2006), A general equilibrium analysis of software development:
implications of copyright protection and contract enforcement, European
Economic Review, 50, 1661-1682.
30. 30
Lu, Y. and Poddar, S., (2012), “Accommodation or Deterrence in the Face of
Commercial Piracy: the Impact of Intellectual Property Rights (IPR)
Protection”, Oxford Economic Papers, 64, 518-538.
Takeyama, L., (1994), “The welfare implications of unauthorized reproduction of
intellectual property in the presence of network externalities”, Journal of
Industrial Economics, 62, 155-166.
Yao, J.-T., (2005), “Counterfeiting and an optimal monitoring policy”, European
Journal of Law and Economics, 19, 95-114.
Appendix
Proof of Lemma 1. Using equation (4) we get .
because
. Q.E.D.
Proof of Lemma 2.
dQed
d!
=
(1! q)
1
3
!
!
2
3
F
1
3
q
1
3
=
Qed
3!
> 0 and
dQed
dF
=
(1! q)
1
3
!
1
3
F
!
2
3
q
1
3
=
Qed
3F
> 0. . Since hence,
for . .
Now . So . So is increasing and concave in
the range is . because in the interval
, and
dQed
dF
> 0. Q.E.D.
Proof of Lemma 3. (i) Substituting in the expression for as
given in equation (13) we get . At
s =
qpm ! pc
(1! q)(qQ ! pc )
ds
dq
=
qQ(qpm ! pc )+ pc (Q(1! q)!(pm ! pc ))
(1! q)2
(qQ ! pc )2
> 0
1>!2 =
pm ! pc
Q(1! q)
" Q(1! q) > pm ! pc
d!m
ed
d"
= 3Qed
(1! 4Qed
)
dQed
d"
dQed
d!
> 0
d!m
ed
d"
! 0 Qed
!
1
4
= Qmonopoly d2
!m
ed
d"2
= (3!8Qed
)
dQed
d"
"
#
$
%
&
'+3Qed
(1! 4Qed
)
d2
Qed
d"2
d2
Qed
d!2
=
!2Qed
9!2
d2
!m
ed
d"2
=
!4(Qed
)3
9"2
< 0 !m
ed
! ! [0,!max ]
d!m
ed
dF
=
2
2
3Qed
(1! 4Qed
)
dQed
dF
" 0
! ! [0,!max ] Qed
! Qmonopoly
=
1
4
! =
q(1! q)2
8F(2 ! q)3 Qed
Qed
(!) =
1! q
q
"
#
$
%
&
'
1
3 q(1! q)2
8F(2 ! q)3
"
#
$
%
&
'
1
3
F
1
3
=
1! q
2(2 ! q)
= Qea
31. 31
, where holds, the pirate cannot enter for both the ea and ed
strategies because for the ea-strategy there is policy induced blocked entry in the
range . Hence, in both cases only the monopolist exists in the market facing the
demand and since it implies ( )2
ˆαed
m
ea
m pp =
hence ( )2
ˆαedea
QQ = . Since at also therefore,
. From Lemma 2 we know that is monotonically increasing in in the range
. So there can only be a unique point of intersection between and
. further implies that . Let us now consider
. Suppose at , . Substituting this in as given in
equation (14) we get The difference between this
expression and !m
ea
(" <") yields !m
ea
!!m
ea
(" <") =
q(1! q)2
4(2 ! q)3
. But at ,
which means . Further since
it means that the equality holds only for . Thus
.
(ii) and are decreasing in F follows from the fact that and
are invariant to changes in F and . The expression for also
supports this fact. That is decreasing in F is evident from its expression
!max =
q
64(1! q)F
. Q.E.D.
Proof of Proposition 2. (i) and .
0
)2(
2
32
2
<
−
−
=
qdq
Qd ea
and
d2
Qed
dq2
=
2!
1
3
F
1
3
(2 ! q)
9q
7
3
(1! q)
2
3
> 0 .
ˆ!2 !m
ed
( ˆ"2 ) = !m
ea
(" !")
! !!
Dm =1!!1 =1!
pmc
Q
!m
ed
( ˆ"2 ) = !m
ea
(" !")
! Qed
(!) = Qea
Qed
(!) = Qed
( ˆ!2 ) = Qea
!m
ed
!
! ! [0,!max ] !m
ed
!m
ea
(" !") Qed
(!) = Qed
( ˆ!2 ) = Qea
! = ˆ!2
ˆ!1
ˆ!1 Qed
( ˆ!1) = Qea
=
1! q
2(2 ! q)
!m
ed
!m
ed
=
3(1! q)2
8(2 ! q)2
!
4(1! q)3
8(2 ! q)3
.
ˆ!1
!m
ed
( ˆ"1) = !m
ea
(" <") Qed
( ˆ!1) ! Qea
=
1" q
2(2 " q)
dQed
d!
> 0
Qed
(!) = Qea
=
1! q
2(2 ! q)
! > ˆ!1
ˆ!1 <
! = ˆ!2
ˆ!1 ! = ˆ!2 !m
ea
(" <")
!m
ea
(" !")
d!m
ed
dF
! 0 !
!max
dQea
dq
=
!1
(2 ! q)2
< 0
dQed
dq
=
!1
3q2
1! q
q
"
#
$
%
&
'
!
2
3
< 0
32. 32
(ii) ,
because , and because
and . Q.E.D
Proof of Lemma 5. (i)
dSW ed
(!)
dF
=
1
2
!Qed
! 6(Qed
)2"
#
$
%
&
'
dQed
dF
=
1
2
!Qed
! 6(Qed
)2"
#
$
%
&
'
Qed
3F
which is positive for
Qed
< 0.21713 and negative for Qed
> 0.21713. The expression for
dSW ed
(!)
dF
is
written using
dQed
dF
=
1
3F
2
3
(1! q)!
q
"
#
$
%
&
'
1
3
=
1
3F
(1! q)!F
q
"
#
$
%
&
'
1
3
=
Qed
3F
.
(ii)
dSW ed
(!ed
)
dF
=
dSW ed
(!ed
)
d!ed
d!ed
dF
+
dSW ed
(!ed
)
dF
=
dSW ed
(!ed
)
dF
> 0 since
dSW ed
d!ed
= 0 , and from part (i) we know that SW ed
is increasing in F for
which is necessary for the first order condition to be satisfied.
(iii) The total differentiation of with
respect to and F yields,
.
The denominator is the second order condition, which can be rewritten as
d2
SW ed
(!)
d!ed2
= !1!
Qed
(1!Qed
)
9!ed2
= !
2.5! 4Qed
!18(Qed
)2
9!ed2
using
dQed
d!
=
Qed
3!
,
d2
Qed
d!2
= !
2Qed
9!2
and (!ed
)2
=
1
2
!Qed
! 6(Qed
)2"
#
$
%
&
'
Qed
3
from equation (20).
d!m
ea
(" <")
dq
=
!(1! q)
4(2 ! q)3
< 0
d!ea
(" !")
dq
=
"2(1" q)(2+ q)
8(2 " q)3
+
q(2 " q)(1" q)2
8(2 " q)3
< 0
2(1! q)(2 + q) > q(2 ! q)(1! q)2 d!m
ed
dq
= 3Qed
(1! 4Qed
)
dQed
dq
< 0
(1! 4Qed
) " 0
dQed
dq
< 0
Qed
< 0.21713
dSW ed
d!
=
1
2
!Qed
! 6(Qed
)2"
#
$
%
&
'
dQed
d!
!! = 0
!ed
!
!"ed
dSW ed
d"ed
!
"
#
$
%
&d"ed
+
!
!F
dSW ed
d"ed
!
"
#
$
%
&dF = 0 '
d"ed
dF
= (
!
!F
dSW ed
d"ed
!
"
#
$
%
&
!
!"ed
dSW ed
d"ed
!
"
#
$
%
&
33. 33
.
Therefore, . Now 1! 4Qed
!36(Qed
)2
" 0 for
Qed
! 0.1201265 and 5!8Qed
!36(Qed
)2
" 0 for Qed
! 0.27778 which means that
5!8Qed
!36(Qed
)2
> 0 for the entire range of Qed
which is Qed
! 0.25 . Therefore,
d!ed
dF
! 0 for Qed
! 0.120126527778 and
d!ed
dF
< 0 otherwise.
(iv) . Now and
. Substituting the expressions for , , and
we get, . Equating
yields and equating yields . Recall
from the first order condition that at , . Since both the expressions
2
)(72126 eded
QQ −− and are positive for at ,
hence . Q.E.D.
Proof of Lemma 6. (i) Using !m
ed
=
3
2
(Qed
)2
! 4(Qed
)3
from equation (14) we get
!m
ed
(Qed
= 0.217) = 0.029760248. Now at ˆ!1 , !m
ea
= !m
ed
. However, !m
ea
=
(1! q)2
8(2 ! q)2
is
decreasing in q. Thus there is a unique q, which is, ˆq = 0.047117375 at which
!m
ed
(Qed
= 0.217) = 0.029760248 = !m
ea
=
(1! q)2
8(2 ! q)2
. Since !m
ea
=
(1! q)2
8(2 ! q)2
is decreasing
in q hence, !m
ea
> !m
ed
(Qed
= 0.217) for q < ˆq , and !m
ea
! !m
ed
(Qed
= 0.217) for q ! ˆq.
Consider any q such that q < ˆq. In this case, !m
ea
> 0.029760248 . Hence to maintain
the equality !m
ea
= !m
ed
, which occurs at ˆ!1(q < ˆq), it must be the case that Qed
> 0.217
because !m
ed
=
3
2
(Qed
)2
! 4(Qed
)3
is increasing in Qed
for Qed
!
1
4
. However, from
!
!F
dSW ed
d"
!
"
#
$
%
& =
1
2
' 2Qed
'18(Qed
)2!
"
#
$
%
&
1
3"
!
"
#
$
%
&
dQed
dF
=
1
2
' 2Qed
'18(Qed
)2!
"
#
$
%
&
1
3"
!
"
#
$
%
&
Qed
3F
d!ed
dF
=
1! 4Qed
!36(Qed
)2
( )
5!8Qed
!36(Qed
)2
!ed
F
dQed
(!ed
)
dF
=
dQed
(!ed
)
d!ed
d!ed
dF
+
dQed
(!ed
)
dF
dQed
(!ed
)
d!ed
=
Qed
3!ed
dQed
(!ed
)
dF
=
Qed
3F
dQed
(!ed
)
d!ed
dQed
(!ed
)
dF
d!ed
dF
dQed
(!ed
)
dF
=
Qed
3F
6 !12Qed
! 72(Qed
)2
( )
5!8Qed
!36(Qed
)2
( )
"
#
$
$
%
&
'
'
6 !12Qed
! 72(Qed
)2
= 0
Qed
= 0.217 5!8Qed
!36(Qed
)2
= 0 Qed
= 0.27778
!ed
Qed
< 0.217
5!8Qed
!36(Qed
)2
Qed
< 0.217 !ed
dQed
(!ed
)
dF
> 0
34. 34
Lemma 5 we know that the highest quality level that !ed
can sustain is Qed
= 0.217 .
So Qed
at ˆ!1(q < ˆq) exceeds 0.217 and since Qed
is increasing in ! therefore,
ˆ!1(q < ˆq) must be greater than !ed
. For any given q, !m
ea
=
(1! q)2
8(2 ! q)2
and
Qea
=
(1! q)
(2 ! q)
are constant. This means for any given q the equality !m
ea
= !m
ed
can be
maintained only for a specific Qed
. Now an increase in F reduces ˆ!1 and increases
Qed
. The increase in Qed
due to an increase in F is outweighed by the decrease in
Qed
via the decrease in ˆ!1 . Since Qed
is unaffected by any change in F for a given q,
hence !m
ed
( ˆ"1) and CSed
( ˆ!1) also remains unaffected. Therefore, an increase in F
only reduces ˆ!1 which in turn increases SW ed
( ˆ!1) .
(ii) Consider any q such that q ! ˆq . In this case since !m
ea
! !m
ed
(Qed
= 0.217) hence
!ed
that can sustain Qed
= 0.217 denoted by )217.0( =eded
Qα satisfies
)ˆ(ˆ)217.0( 1 qqQeded
≥≥= αα . Now from Lemma 5 we know that SW ed
attains its
highest value when 217.0=ed
Q . So for any q that satisfies q ! ˆq the fine F and
consequently !ed
be such that Qed
= 0.217 is sustained. Substituting 217.0=ed
Q in
equation (20) we get !ed*
= 0.005805802. From the expression for Qed
which is
Qed
=
(1! q)
1
3
!
1
3
F
1
3
q
1
3
we see that for a given monitoring rate and quality, F is
increasing in q. This means that an increase in piracy in the range q ! ˆq needs to
countered by an increase in F in order to maintain Qed
= 0.217 and
!ed*
= 0.005805802. This will maintain the highest possible SW ed
for !ed*
which is
SW ed
( Qed
= 0.217,!ed*
= 0.005805802) = 0.06450202 . This we get by substituting
Qed
= 0.217 in the expression for SW ed
(!ed
) as given in equation (21). Q.E.D.
Proof of Proposition 3. (i) In the range q < ˆq the choice is between !ea*
= 0 and
!ed*
= ˆ!1 . SWea
(!ea*
= 0;q) = "m
ea
(!ea*
= 0;q)+"c
ea
(!ea*
= 0;q)+CSea
(!ea*
= 0;q) For a
given q, ˆ!1 which solves !m
ed
= !m
ea
("ea*
= 0) , depends only on F because the latter
determines the position of !m
ed
as seen from Figure 1. Thus using !m
ed
= !m
ea
("ea*
= 0)
35. 35
which is
3
2
(Qed
)2
! 4(Qed
)3
=
(1! q)2
8(2 ! q)2
we can solve for Qed
for a given q which
when substituted in the expression for SW ed
as given in equation (18) yields
SW ed
( ˆ!1(q), F) = "m
ed
(Qed
( ˆ!1(q), F))+CSed
(Qed
( ˆ!1(q), F))!
ˆ!1
2
2
. Let
!SW " SW ed
( ˆ!1(q), F)# SW ea
(!ea*
= 0;q) which using !m
ed
= !m
ea
("ea*
= 0) can
rewritten as !SW = CSed
(Qed
( ˆ!1(q), F))"CSea
(!ea*
= 0;q)""c
ea
(!ea*
= 0;q)"
ˆ!1
2
2
If CSed
(Qed
( ˆ!1;q))!CSea
(!ea*
= 0;q)!"c
ea
(!ea*
= 0;q) > 0 then we can solve for an ˆ!1
such that !SW = 0 . We then plug this ˆ!1 in the expression Qed
=
(1! q)
1
3 ˆ!1
1
3
F
1
3
q
1
3
and
solve for F, which we denote as F(q) . From Lemma 6 we know that an increase in F
do not affect Qed
( ˆ!1) and hence, !m
ed
( ˆ"1) and CSed
( ˆ!1) but increases SW ed
due to a
fall in ˆ!1 , for a given q. So a fine in excess of F(q) will reduce ˆ!1(q) such that Qed
remains unaffected but increases SW ed
. Using this methodology we see that except
for a very low q which is q < 0.0000001 at which practically the monopoly outcome
prevails and hence no enforcement is necessary, we find that as q increases up to ˆq
CSed
(Qed
( ˆ!1;q))!CSea
(!ea*
= 0;q)!"c
ea
(!ea*
= 0;q) > 0 . This means we can solve for
a positive ˆ!1 such that !SW = 0 and also determine F(q) . Thus the optimal pair is
( ˆ!1(q),F ! F(q)) which result’s in the monopolist choosing the ed-strategy with
Qed
( ˆ!1(q), F ! F(q)) as the equilibrium quality. Thus piracy is deterred but
Qed
( ˆ!1(q), F ! F(q)) is less than Qea
=
1! q
2(2 ! q)
. This follows from Lemma 3.
(ii) From Lemma 6 we know that for q ! ˆq, !ed*
= 0.005805802 maximizes SW ed
and Qed
= 0.217 . SW ed
( Qed
= 0.217,!ed*
= 0.005805802) = 0.06450202 exceeds the
highest possible value of SW ea
which is SW ea
(!ea*
= 0,q = 0.1569297) = 0.0631604.
At !ed*
= 0.005805802 we know from Proposition 1 that
!m
ea
! !m
ed
(Qed
= 0.217,"ed*
= 0.005805802) . Therefore, ed-strategy is the equilibrium
and hence, piracy is deterred. Q.E.D.