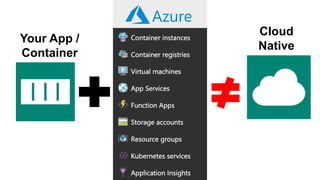
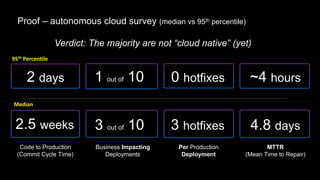
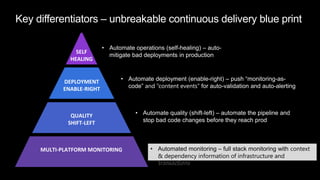
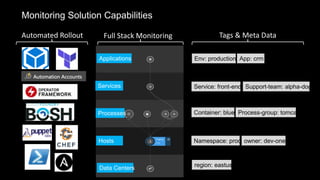
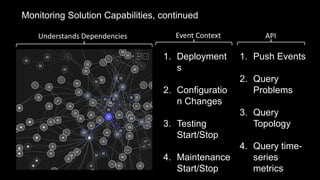
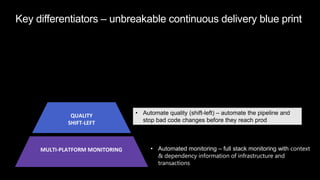
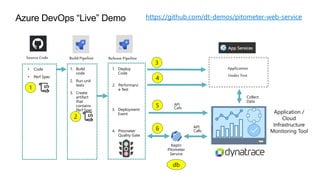
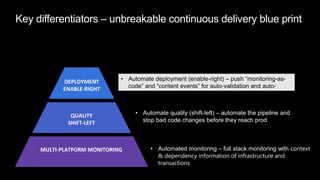
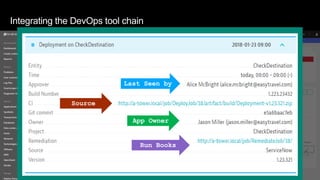
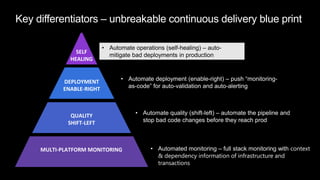
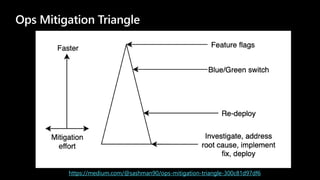
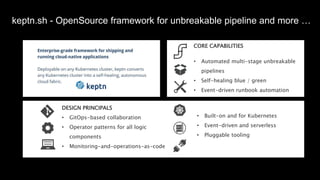
The document discusses cloud native applications and continuous delivery pipelines. It summarizes the results of a survey that found the majority of applications are not fully cloud native yet. It then outlines several capabilities needed for cloud native applications and continuous delivery pipelines, including automated operations, deployment, quality processes, and monitoring across platforms and environments. The key differentiators are described as an "unbreakable continuous delivery blue print" with automated monitoring, deployment, quality processes, and self-healing capabilities.


![1 3 5Staging
CI CD
Code / Config
Change
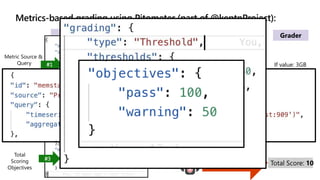
{
"lowerBound": 100,
"upperBound": 1000,
"_comment": "global configuration environment-wide",
"timeseries": [
{
"timeseriesId": "service.responsetime",
"aggregation": "avg",
"entityIds": "SERVICE-3211ABE8813B9239",
"lowerBound": 20,
"upperBound": 300
}
]
}
Monitoring
Spec
Monitoring2 4 End Users
YES / NO ?](https://image.slidesharecdn.com/msbuild-usingaiandautomationtobuildresiliencyintoazuredevops-190705183112/85/Using-ai-and-automation-to-build-resiliency-into-azure-dev-ops-11-320.jpg)

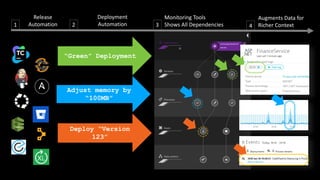
![2
Self-healing
Automation1
User Impact
Problem Evolution
1 CPU Exhausted? Add a new service instance!
2 High Garbage Collection? Adjust/Revert Memory Settings!
3 Issue with BLUE only? Switch back to GREEN!
Hung threads? Restart Service!4
Impact Mitigated??
5 Still ongoing? Initiate Rollback!
? Still ongoing? Escalate
Mark Bad Commits
Update Tickets
2:00 a.m. Alert?
Auto-mitigate! …
Application / Cloud
Infrastructure Monitoring Tool
Add new metric to quality
gate – think automation
here, too!
{
"lowerBound": 100,
"upperBound": 1000,
"_comment": "global configuration
environment-wide",
"timeseries": [
{
"timeseriesId":
"service.responsetime",
"aggregation": "avg",
"entityIds": "SERVICE-
3211ABE8813B9239",
"lowerBound": 20,
"upperBound": 300
}
]
}
…
…
…](https://image.slidesharecdn.com/msbuild-usingaiandautomationtobuildresiliencyintoazuredevops-190705183112/85/Using-ai-and-automation-to-build-resiliency-into-azure-dev-ops-19-320.jpg)


![The Selfish Stack [FutureStack16 NYC]](https://cdn.slidesharecdn.com/ss_thumbnails/selfishstackpresentationfinal1-160815212335-thumbnail.jpg?width=640&height=640&fit=bounds)


