Gender Diversity And Head Count Recruitment Dashboard
•
0 likes•105 views

"You can download this product from SlideTeam.net" Presenting this set of slides with name - Gender Diversity And Head Count Recruitment Dashboard. This is a two stage process. The stages in this process are Staffing Plan, Recruitment, Staff Management. https://bit.ly/33aK4oK
Report
Share
Report
Share
Download to read offline

Recommended
Recommended
More Related Content
What's hot
What's hot (20)
Communicating the ROI of UX from The Enterprise to The Streets (JD Buckley at...
Communicating the ROI of UX from The Enterprise to The Streets (JD Buckley at...
Financial Performance KPI Dashboard Showing Payroll Headcount Ratio Cost Per ...
Financial Performance KPI Dashboard Showing Payroll Headcount Ratio Cost Per ...
How to Adopt a Servant Leadership Mindset at Your Organization
How to Adopt a Servant Leadership Mindset at Your Organization
Digital Business Transformation Ppt Summary Structure
Digital Business Transformation Ppt Summary Structure
Recruitment Funnel And Application Source Dashboard
Recruitment Funnel And Application Source Dashboard
Sales Strategy Secrets And Tips Powerpoint Presentation Slides
Sales Strategy Secrets And Tips Powerpoint Presentation Slides
Similar to Gender Diversity And Head Count Recruitment Dashboard
Similar to Gender Diversity And Head Count Recruitment Dashboard (20)
KPI Dashboard Showing Employee Churn Key Metrics And Open Positions
KPI Dashboard Showing Employee Churn Key Metrics And Open Positions
Risk Management Kpi Dashboard Showing Open Issues And Control Performance
Risk Management Kpi Dashboard Showing Open Issues And Control Performance
Compliance And Legal KPI Dashboard Showing High Priority Violations
Compliance And Legal KPI Dashboard Showing High Priority Violations
Call Center KPI Dashboard Showing Total Calls Average Answer Speed Abandon Rate
Call Center KPI Dashboard Showing Total Calls Average Answer Speed Abandon Rate
Project Status KPI Dashboard Showing Completed Tasks And Task In Progress
Project Status KPI Dashboard Showing Completed Tasks And Task In Progress
Risk Management KPI Dashboard Showing Overall Security Risk And Regulatory Co...
Risk Management KPI Dashboard Showing Overall Security Risk And Regulatory Co...
Compliance And Legal KPI Dashboard Showing Compliance Issues And Resolution Time
Compliance And Legal KPI Dashboard Showing Compliance Issues And Resolution Time
Audit KPI Dashboard Showing Audit Status Auditable Entry Risk Rating
Audit KPI Dashboard Showing Audit Status Auditable Entry Risk Rating
Project Status KPI Dashboard Showing Project Timeline And Budget
Project Status KPI Dashboard Showing Project Timeline And Budget
Marketing KPI Dashboard Showing Lead Funnel Traffic Sources Key Metrics
Marketing KPI Dashboard Showing Lead Funnel Traffic Sources Key Metrics
Data Visualization For Website Visits Using Creative Pie Chart
Data Visualization For Website Visits Using Creative Pie Chart
More from SlideTeam
More from SlideTeam (20)
Customer Support And Services Guide Powerpoint Presentation Slides
Customer Support And Services Guide Powerpoint Presentation Slides
Word Of Mouth WOM Marketing Strategies To Build Brand Awareness Powerpoint Pr...
Word Of Mouth WOM Marketing Strategies To Build Brand Awareness Powerpoint Pr...
Strategic Staff Engagement Action Plan Powerpoint Presentation Slides
Strategic Staff Engagement Action Plan Powerpoint Presentation Slides
Traditional Marketing Channel Analysis Powerpoint Presentation Slides Mkt Cd
Traditional Marketing Channel Analysis Powerpoint Presentation Slides Mkt Cd
Integrating Asset Tracking System To Enhance Operational Effectiveness Comple...
Integrating Asset Tracking System To Enhance Operational Effectiveness Comple...
Designing And Implementing Brand Leadership Strategy Powerpoint Presentation ...
Designing And Implementing Brand Leadership Strategy Powerpoint Presentation ...
How Amazon Generates Revenues Across Globe Powerpoint Presentation Slides Str...
How Amazon Generates Revenues Across Globe Powerpoint Presentation Slides Str...
Guide For Effective Event Marketing Powerpoint Presentation Slides Mkt Cd
Guide For Effective Event Marketing Powerpoint Presentation Slides Mkt Cd
Managing Business Customers Technology Powerpoint Presentation Slides
Managing Business Customers Technology Powerpoint Presentation Slides
Unearthing Apples Billion Dollar Branding Secret Powerpoint Presentation Slid...
Unearthing Apples Billion Dollar Branding Secret Powerpoint Presentation Slid...
Developing Flexible Working Practices To Improve Employee Engagement Powerpoi...
Developing Flexible Working Practices To Improve Employee Engagement Powerpoi...
Product Corporate And Umbrella Branding Powerpoint Presentation Slides Brandi...
Product Corporate And Umbrella Branding Powerpoint Presentation Slides Brandi...
Communication Channels And Strategies For Shareholder Engagement Powerpoint P...
Communication Channels And Strategies For Shareholder Engagement Powerpoint P...
Responsible Tech Playbook To Leverage Business Ethics Powerpoint Presentation...
Responsible Tech Playbook To Leverage Business Ethics Powerpoint Presentation...
Generating Leads Through Targeted Digital Marketing Campaign Powerpoint Prese...
Generating Leads Through Targeted Digital Marketing Campaign Powerpoint Prese...
Boosting Profits With New And Effective Sales Strategic Plan Powerpoint Prese...
Boosting Profits With New And Effective Sales Strategic Plan Powerpoint Prese...
Methods To Implement Traditional Marketing Powerpoint Presentation Slides Mkt Cd
Methods To Implement Traditional Marketing Powerpoint Presentation Slides Mkt Cd
Comprehensive Guide To Sports Marketing Strategy Powerpoint Presentation Slid...
Comprehensive Guide To Sports Marketing Strategy Powerpoint Presentation Slid...
Global Shift Towards Flexible Working Powerpoint Presentation Slides
Global Shift Towards Flexible Working Powerpoint Presentation Slides
Recently uploaded
VIP Call Girls Napur Anamika Call Now: 8617697112 Napur Escorts Booking Contact Details WhatsApp Chat: +91-8617697112 Napur Escort Service includes providing maximum physical satisfaction to their clients as well as engaging conversation that keeps your time enjoyable and entertaining. Plus they look fabulously elegant; making an impressionable. Independent Escorts Napur understands the value of confidentiality and discretion - they will go the extra mile to meet your needs. Simply contact them via text messaging or through their online profiles; they'd be more than delighted to accommodate any request or arrange a romantic date or fun-filled night together. We provide –(Anamika) VIP Call Girls Napur Call Now 8617697112 Napur Escorts 24x7
(Anamika) VIP Call Girls Napur Call Now 8617697112 Napur Escorts 24x7Call Girls in Nagpur High Profile Call Girls
Recently uploaded (20)
Eluru Call Girls Service ☎ ️93326-06886 ❤️🔥 Enjoy 24/7 Escort Service
Eluru Call Girls Service ☎ ️93326-06886 ❤️🔥 Enjoy 24/7 Escort Service
Call Girls Jp Nagar Just Call 👗 7737669865 👗 Top Class Call Girl Service Bang...
Call Girls Jp Nagar Just Call 👗 7737669865 👗 Top Class Call Girl Service Bang...
Call Girls In Panjim North Goa 9971646499 Genuine Service
Call Girls In Panjim North Goa 9971646499 Genuine Service
Falcon's Invoice Discounting: Your Path to Prosperity
Falcon's Invoice Discounting: Your Path to Prosperity
Call Girls in Delhi, Escort Service Available 24x7 in Delhi 959961-/-3876
Call Girls in Delhi, Escort Service Available 24x7 in Delhi 959961-/-3876
Call Girls From Pari Chowk Greater Noida ❤️8448577510 ⊹Best Escorts Service I...
Call Girls From Pari Chowk Greater Noida ❤️8448577510 ⊹Best Escorts Service I...
FULL ENJOY Call Girls In Majnu Ka Tilla, Delhi Contact Us 8377877756
FULL ENJOY Call Girls In Majnu Ka Tilla, Delhi Contact Us 8377877756
FULL ENJOY Call Girls In Mahipalpur Delhi Contact Us 8377877756
FULL ENJOY Call Girls In Mahipalpur Delhi Contact Us 8377877756
Business Model Canvas (BMC)- A new venture concept
Business Model Canvas (BMC)- A new venture concept
The Path to Product Excellence: Avoiding Common Pitfalls and Enhancing Commun...
The Path to Product Excellence: Avoiding Common Pitfalls and Enhancing Commun...
Quick Doctor In Kuwait +2773`7758`557 Kuwait Doha Qatar Dubai Abu Dhabi Sharj...
Quick Doctor In Kuwait +2773`7758`557 Kuwait Doha Qatar Dubai Abu Dhabi Sharj...
(Anamika) VIP Call Girls Napur Call Now 8617697112 Napur Escorts 24x7
(Anamika) VIP Call Girls Napur Call Now 8617697112 Napur Escorts 24x7
Uneak White's Personal Brand Exploration Presentation
Uneak White's Personal Brand Exploration Presentation
Call Girls In Noida 959961⊹3876 Independent Escort Service Noida
Call Girls In Noida 959961⊹3876 Independent Escort Service Noida
Insurers' journeys to build a mastery in the IoT usage
Insurers' journeys to build a mastery in the IoT usage
Gender Diversity And Head Count Recruitment Dashboard
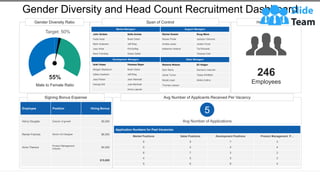
- 1. Gender Diversity Ratio Span of Control Headcount This graph/chart is linked to excel, and changes automatically based on data. Just left click on it and select “Edit Data”. Gender Diversity and Head Count Recruitment Dashboard 55% Target: 50% Male to Female Ratio Market Managers John Groban Sofia Annise Huda Asad Noah Green Mark Anderson Jeff Bing Joey West Phil Buffay Nora Tremblay Grace Geller Support Managers Rachel Dosset Doug Mann Rowan Poole Jackson Clemons Amelia Jones Jordan Foust Katherine Holland Tia Richards Teressa Cole Development Managers Isiah Heyes Vanessa Bayer Morgan Blackburn Noah Green Gillian Anaheim Jeff Bing Jess Parker Jean Marshall George Bitt Julie Marshall Amos Laporte Sales Managers Rehema Wasem Eli Helgen Sam Rains Damarco malcolm Jamal Turner Tessa Whitfeild Nicole Lloyd Alisha Collins Thomas Lawson 246 Employees Signing Bonus Expense Avg Number of Applicants Received Per Vacancy Employee Position Hiring Bonus Henry Douglas Director of growth $5,000 Renee Frances Senior UX Designer $6,000 Anna Theroux Product Management Director $4,000 $15,600 5 Avg Number of Applications Application Numbers for Past Vacancies Market Positions Sales Positions Development Positions Product Management P… 6 5 7 3 5 4 4 4 6 7 3 2 4 5 5 3 5 6 6 4
- 2. Instructions To Edit This Slide This slide has been made in PowerPoint using basic PowerPoint shapes, and all graphics are 100% editable in PowerPoint. You can change color, size and orientation of any element to your liking, and add/edit any piece of text anywhere.
- 3. All images are 100% editable in PowerPoint Change color, size and orientation of any icon to your liking”
- 4. 1. Select the Graph and right click -> Select "Edit Data" 2. An excel matrix will automatically show up 3. Enter the values based on your requirements and hit enter 4. The Graph/Chart shape will automatically adjust according to your data, and anytime you can go and change the value again Edit Excel-linked Chart This is a Data Driven Chart/Graph and the shape automatically adjusts according to your data 1 2 3
- 5. Edit Color 1. Select the shape to change the color and Right click the object( click any object which you want to change color) 2. Choose Format Data Series in the dialog box. 3. Choose “Fill” in the Format Shape box then “Solid” or “Gradient” depending on the appearance of the object. Change colour as shown in the picture. 1 2 3
- 6. Select From Thousands Of Editable Icons On Every Topic These icons are available at the Icons section on www.slideteam.net