
Recommended
Recommended
More Related Content
What's hot
What's hot (17)
Viewers also liked
Viewers also liked (14)
Similar to DecreasingTechnicalLossesDistributionNetwork2004
Similar to DecreasingTechnicalLossesDistributionNetwork2004 (20)
DecreasingTechnicalLossesDistributionNetwork2004
- 1. Siniša Spremić, ED "Subotica", Segedinski put 22-24, 24000 Subotica (sinisa.spremic@su.ev.co.yu) TECHNOECONOMIC ANALYSIS FOR DECREASING TECHNICAL LOSSES AT DISTRIBUTION NETWORK OVERHEAD LINES WITH MINIMAL INESTMENT BY INCREASING CONDUCTORS CROSS-SECTION S. Spremić, EPS - J.P. "Elektrovojvodina" - Elektrodistribucija "Subotica", Serbia and Montenegro INTRODUCTION In 2000. Elektrovojvodina brought "Program of measures for decreasing electric energy losses (in following text: Program) which, with some changes for improvement, is in use until today. In May 2003. EPS brought "Unique operative program for decreasing non-technical losses of electric energy at distributive sector of J.P. EPS" (in following text: UOP). Program and UOP are primary dealing with decreasing non-technical losses of electric energy. Besides measures for decreasing non-technical losses, it is necessary not to disregard technical losses. The biggest part of total technical losses of electric energy in distribution network is in lines, especially overhead lines, and investment in increasing overhead lines conductors cross-section has the biggest influence in decreasing technical losses. Underground cable lines are, regardless of voltage level, mostly made with cross-section for copper of 95 mm 2 and for aluminum of 150 mm 2 , and built costs are high, so they are not considered in this paper. Technical documentation costs, differences in amortization and maintenance costs, additional costs and influence of using dismantled conductors (by selling as row material or mantling it somewhere else) are not considered in this analysis. Conductor costs, work costs and other costs are considered in this analysis, according to mantle price list EPS - J.P. Elektrovojvodina dated 03.11.2003. INCOME DATA Calculation of technical losses for 0,4 kV, 10 kV and 20 kV overhead lines (for different cross-section AlFe lines and different load current with power factor cos = 1 on 1 km lines) was made for consideration year level technical losses (see TABLE 1 and TABLE 2). Load current mean maximal current (peak load reached in year). Chosen current range for 0,4 kV voltage level is between 40 A and 240 A. Chosen current range for 10 kV and 20 kV voltage levels is between 40 and 240 A. Maximal current values are values of safe current with which is possible permanent loading of determined conductors cross-section (except for cross-sections of 70 mm 2 and 95 mm 2 where was as upper limit chosen lower current than safe current, because higher values of currents are not reached in practice) on temperature of calm air of 40 o C or a little higher currents because at the time of peak loads (winter period with significant lower temperatures) conductors could be loaded more. Parameters used for calculations for 10 kV and 20 kV voltage levels are that: peak load duration of 3700 h and duration of maximal losses of 2200 h. 0,4 kV voltage level parameters used for calculations are: peak load duration of 2800 h and duration of maximal losses of 1500 h. Calculation
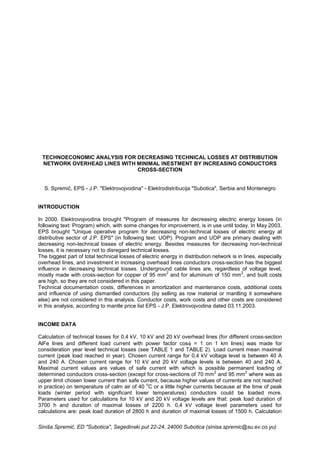
- 2. Siniša Spremić, ED "Subotica", Segedinski put 22-24, 24000 Subotica (sinisa.spremic@su.ev.co.yu) program uses 380 V for calculation for 0,4 kV voltage level. For average price for 1 kWh of electric energy (incorporated prices for active power and reactive electric energy) is chosen 2 dinars (1 Euro is about 71 dinars). Conductors costs, work costs and other costs were used from mantle price list dated 03.11.2003. brought by EPS - J.P. "Elektrovojvodina", and can be seen at TABLES 3 and 4. cross- sections (mm 2 ) Year losses on 1 km (kWh/km*year) for given currents and voltages 10 kV and 20 kV 40 A 60 A 80 A 100 A 120 A 140 A 160 A 180 A 200 A 220 A 240 A 25 12978 29201 51913 81114 116804 158983 207652 35 9525 21432 38101 59532 85726 116683 152402 192884 50 6790 15278 27160 42438 61111 83178 108641 137499 169752 70 4710 10597 18839 29436 42388 57695 75356 95373 117744 142470 95 3485 7841 13939 21780 31363 42689 55757 70567 87120 105415 124453 TABLE 1 - YEAR LOSSES ON 1 KILOMETRE FOR GIVEN CURRENTS AND VOLTAGES 10 kV AND 20 kV cross- sections (mm 2 ) Year losses on 1 km (kWh/km*year) for given currents and 0.4 kV voltage 40 A 60 A 80 A 100 A 120 A 140 A 160 A 180 A 200 A 220 A 240 A 25 8849 19910 35395 55305 79640 108398 141582 35 6494 14613 25977 40590 58450 79556 103911 131511 50 4630 10417 18518 28935 41667 56712 74074 93749 115740 70 3211 7225 12845 20070 28901 39901 51380 65027 80280 97138 95 2376 5346 9504 14850 21384 29106 38016 48114 59400 71874 85536 TABLE 2 - YEAR LOSSES ON 1 KILOMETRE FOR GIVEN CURRENTS AND 0.4 VOLTAGE Conductor Costs (din./km) AlFe 3x25 mm 2 66020 AlFe 3x35 mm 2 88970 AlFe 3x50 mm 2 116810 AlFe 3x70 mm 2 159760 AlFe 3x95 mm 2 209740 TABLE 3 - CONDUCTOR, WORK AND OTHER COSTS ON 1 KILOMETRE Conductor Costs (din./km) AlFe 4x25 mm 2 87700 AlFe 4x35 mm 2 118180 AlFe 4x50 mm 2 155160 AlFe 4x70 mm 2 197450 AlFe 4x95 mm 2 266520 TABLE 4 - CONDUCTOR, WORK AND OTHER COSTS ON 1 KILOMETRE RESULTS In former chapter were given income data for losses of electric energy for specified cross-sections and conductors mantling costs (conductors, work and other costs). Repayment in years means in which period (in years) will repay conductors, work and other costs throughout losses difference in existing conductors and new mantled conductors, depending on load currents. Repayment in years is the result of dividing conductors mantling costs with losses difference in existing conductors with smaller cross-section and new mantled conductors with bigger cross-section, given in dinar values. Figures 1, 2, and 3 shows repayment in years for changing conductors cross-sections for specified currents, on figure 1 for 10 kV and 20 kV voltage levels, and figures 2 and 3 for 0,4 kV voltage level.
- 3. Siniša Spremić, ED "Subotica", Segedinski put 22-24, 24000 Subotica (sinisa.spremic@su.ev.co.yu) FIGURE 1 - Repayment in years for conductors replacement for 10 kV and 20 kV voltage levels FIGURE 2 - Repayment in years for conductors replacement for 0.4 kV voltage level Repayment in years included conductor, work and other costs, depending on current loads, for 10 kV i 20 kV voltage levels 0 1 2 3 4 5 6 7 8 9 10 40 60 80 100 120 140 160 180 200 Current I (A) Repaymentinyears cross-section change from 25 to 35 cross-section change from 25 to 50 cross-section change from 25 to 70 cross-section change from 25 to 95 cross-section change from 35 to 50 cross-section change from 35 to 70 cross-section change from 35 to 95 cross-section change from 50 to 70 cross-section change from 50 to 95 cross-section change from 70 to 95 Repayment in years included conductor, work and other costs, depending on current loads, for 0.4 kV voltage level 0 1 2 3 4 5 6 7 8 9 10 40 60 80 100 120 140 160 180 200 Current I (A) Repaymentinyears cross-section change from 25 to 35 cross-section change from 25 to 50 cross-section change from 25 to 70 cross-section change from 35 to 50 cross-section change from 35 to 70 cross-section change from 50 to 70
- 4. Siniša Spremić, ED "Subotica", Segedinski put 22-24, 24000 Subotica (sinisa.spremic@su.ev.co.yu) FIGURE 3 - Repayment in years for conductors replacement for 0.4 kV voltage level PRACTICAL DATA DETERMINATION FOR CALCULATIONS AND PRACTICAL CALCULATIONS For 10 kV and 20 kV voltage levels there are existing data about maximal loads at feeder starts (monthly reading). It has to be noticed that some of measure units are defective and take count of fact that sometimes sectioning (among feeders), new built-in objects (transformer substations) in the meantime, appearance of new consumers, etc, changes maximum load values. Program and UOP predicted that all consumers will be joined to their transformer substations (in following text: TS) 10(20)/0,4 kV (what is almost done). With this, there were possibilities to find out realised electric energy at TS 10(20)/0,4 kV, on feeders 10 kV and 20 kV and at transformer stations high voltage/medium voltage and medium voltage 1/medium voltage 2. For the purpose of calculation, realised electric energy should be increased for estimated losses (technical and non-technical), and this value of electric energy with maximal load will be used to determine loads and energy flows through feeder sections. In addition, this data will be used to determine peak load duration and duration of maximal losses. Losses will be calculated for elected sections. Calculations could be accomplished manual or with using some of computer programs. For 0,4 kV voltage level there are existing data about maximal year loads at TS 10(20)/0,4 kV. It has to be noticed that some of measure units are defective, and take count of fact that sometimes sectioning (among TS 10(20)/0,4 kV), appearance of new consumers, etc, changes maximum load values. Program and UOP predicted that all consumers would be joined to their TS 10(20)/0,4 kV (what is almost done), so there is possibility to find out realised electric energy at TS 10(20)/0,4 kV. For the purpose of calculation, realised electric energy should be increased for estimated losses (technical and non-technical) and this value of electric energy with maximal load will be used to determine loads and energy flows through 0,4 kV feeders. In addition, this data will be used to determine peak load duration and duration of maximal losses. Losses will be calculated for elected sections. Calculations could be accomplished manual or with using some of computer programs. Program and UOP predicted bringing to function (repair, accuracy checking, built-in...) units for measuring (active) electric energy flow through TS 10(20)/0,4 kV and maximal current loads, which will give exact data for calculation. At low voltage overhead lines, for detailed analysis is necessary to know consumers distribution, because in most cases consumers distribution is uneven. Repayment in years included conductor, work and other costs, depending on current loads, for 0.4 kV voltage level 0 1 2 3 4 5 6 7 8 9 10 40 60 80 100 120 140 160 180 200 Current I (A) Repaymentinyears cross-section change from 25 to 95 cross-section change from 35 to 95 cross-section change from 50 to 95 cross-section change from 70 to 95
- 5. Siniša Spremić, ED "Subotica", Segedinski put 22-24, 24000 Subotica (sinisa.spremic@su.ev.co.yu) PROCEDURE FOR SECTION DETERMINATION WITH REPAYABLE INVESTMENT Energetic service (at energetic department or at distribution network management department) on the base of technical data (lines, loads, energy flows, realised electric energy, number of consumers...), on site data (consumers distribution), development plans and maintenance plans are looking for sections which are acceptable for analysis, making analysis and delivering request for checking the possibility for mantling conductors with bigger cross-section than the present with corresponding scheme in attachment. Checking the possibility for mantling conductors with bigger cross-section than the present is job of investment service (construction and machine experts). They must establish possibility for mantling conductors with bigger cross-section according to higher mechanical loads on present objects (transformer substation, poles, consoles, isolation...). If it is possible to mantle new conductors on present objects, investment service give a report, and if it is not possible they give corresponding report in which they give necessary works with material specification. According to report, energetic service makes technical solution and delivering it to investment service. Investment service make cost assessment and deliver it to technical director, which will bring decision (together with technical service managers) about performing works given at analysis. Affirmative decision starts procedure for performing works and during works shall consider state of dismantled conductors with decision to selling it as raw material or mantling it somewhere else. Additional influences on costs which should be (if possible) incorporate in every single analysis are: -Technical documentation costs (increasing costs), -Differences in amortization and maintenance costs (increasing costs), -Additional costs which considered dismantling present feeder conductors and dismantling and mantling consumers connections with material (increasing costs) and -Using dismantled conductors by selling it as raw material or mantling it somewhere else (decreasing costs). Additional works with influence in decreasing electrical energy losses: -During the works make even distribution of mono-phase consumer connections on phases at low voltage overhead lines. ASSESSMENT OF INFLUENCE ON LOSSES DECREASMENT FOR ELEKTRODISTRIBUCIJA "SUBOTICA" Elektrodistribucija "Subotica" has approximately 1900 km of low voltage overhead lines and around 900 km of 10 kV and 20 kV lines. It also has about 1000 own distribution transformer substations. If we assume there are around 200 distribution transformer substations with mainly cable feeders, add that each of them has 4 to 8 low voltage feeders (for collective and single residential objects), than there are around 800 distribution transformer substations with mainly overhead feeders (assessed to approximately 3 feeders per transformer substation). The assessment further gives that each low voltage overhead feeder is approximately 700 m long (with side branches included). If each of 200 distribution transformer substations with mainly cable feeders has 200 consumers connected, that makes total of 40000 consumers. Than on the rest of distributive transformer substations with mainly overhead feeders there are 70000 consumers connected (average number of 90 consumers per distributive transformer substation or 30 consumer per low voltage feeder). The short analysis applied to Novi Zhednik proved this assessment (77 consumers and 2.5 feeders per distributive transformer substation or 30 consumers per low voltage feeder). It is necessary to mention that Novi Zhednik has (optional) even consumer distribution, considering the placement of distribution transformer substations and the adjoined area. The analysis of realised electric energy gives that the overlapping peak power for a residential consumer is about 2.3 kW what gives average maximal power of 70 kW at the beginning of an average low voltage overhead feeder, what correspond to current of approximately 100 A (with 400 V). The previous paragraphs gave assessed average values. There is a big number of low voltage overhead feeders which length are bigger than the average, or which have the number of consumers connected to it bigger than average, or which have the load bigger than the average and some of feeders have all three parameters bigger than average. The overhead lines operating on 10 kV and 20 kV voltage level are mainly with conductors AlFe 3x50 mm 2 , while there is also a significant presence of conductors AlFe 3x95 mm 2 (especially at the beginnings of feeders, at the major sections and sections connected two feeders). AlFe 3x25 mm 2 conductors are less present and conductors AlFe 3x35 mm 2 even lesser. AlFe 3x70 mm 2 conductors are most frequently present in the sections of former 35 kV lines. Copper conductor lines are the least
- 6. Siniša Spremić, ED "Subotica", Segedinski put 22-24, 24000 Subotica (sinisa.spremic@su.ev.co.yu) present. New lines operating on 10 kV and 20 kV voltage level build with AlFe 3x50 mm 2 or bigger cross-sections. 0.4 kV voltage level overhead lines are mainly with AlFe 4x50 mm 2 . AlFe 4x25 mm 2 conductors are present lesser and AlFe 4x35 mm 2 even lesser. AlFe 4x70 mm 2 conductors are mainly present at the beginnings of 0.4 kV feeders, but generally with rare presence. Cooper conductor lines are the least present. New 0.4 kV overhead lines (solo or as parts of mixed lines) are mostly built with conductors AlFe 4x50 mm 2 or, but lesser AlFe 4x70 mm 2 . At 10 kV and 20 kV overhead lines conductor replacement with bigger cross-section would be repayable in period up to 10 years in all sections with the present AlFe 3x50 mm 2 or lesser cross- section and where the current loads are bigger than 80 amperes. Even the replacement of sections with less current loads would be repayable in the period up to 10 years depending on present cross- section. It is assessed that the replacement with conductors with bigger cross-section repayable in terms up to 10 years is possible at the 15 % of total of 900 km, what makes 135 km of 10 kV and 20 kV overhead lines. Speaking of the replacing conductors, it is necessary to take replacement with maximum possible cross-section. In the low voltage sections, the replacement with bigger cross-section is repayable at the beginnings of feeders (because the load gradually decreased towards the end of feeder). Assessment is that the replacement with conductors with bigger cross-sections repayable in terms up to 10 years is possible at the 25 % of the total of 1800 km, what makes 450 km of low voltage overhead lines. Speaking of the replacing conductors, it is necessary to take replacement with maximum possible cross-section. The assessment is that the replacement with bigger cross-section would decrease losses of approximately 20000 kWh per kilometre in a year period, what makes decrease in losses of 40000 dinars per kilometre in a year. That means the investment will be repay in approximately 5 years. The replacement will be first in the sections with the quickest repayment. Further calculation based on the previous assessments, gives that the replacement with bigger cross- sections applied on all 450 km + 135 km = 585 km, with losses decrease of 20000 kWh per kilometre yearly, would lead to decrease in technical losses of 11700 MWh yearly, what makes 1.05 % of the total consumption of Elektrodistribucija "Subotica". The assessment is that the technical losses in 0.4 kV, 10 kV and 20 kV overhead lines in Elektrodistribucija "Subotica" are 5.4 %, so that the previous calculations would give the losses decrease of about 20 % in 0.4 kV, 10 kV and 20 kV overhead lines. The effect in technical losses decrease made on 0.4 kV overhead lines is far bigger, but that made on 10 kV and 20 kV should also not be disregarded. If the assumed pace of replacement is 100 km per year, with the average price of 200000 dinars per kilometre (for 0.4 kV AlFe 4x70 mm 2 and for 10 kV and 20 kV AlFe 3x95 mm 2 ) it should be invested 20000000 dinars per year, what means 117000000 dinars for all 585 km, according to the present price list. CONCLUSION Distributors of electric energy have paid attention to the technical losses decrease, beside the measures for the non-technical losses decreasing. The biggest percentage of the technical losses in the distribution network is in the overhead lines and we can influence them mostly through investments in the replacement with bigger conductor cross-sections. The distribution network, when the low voltage overhead lines are considered, were mostly built before 20 years and more when the loads were far lesser. The building elements of the network were, corresponding to that (primary thinking about conductor cross-sections), fully satisfying at that time. Appearance and availability of different home apparatus significantly increased electric energy consumption what was causer of significantly increased technical losses (cross-section are mostly satisfying regarding to loads, but they are not satisfying regarding to significant technical losses of electric energy). Repayment in years will have bigger value if we count in influence of technical documentation costs, differences in amortization and maintenance costs and additional costs, but it will have smaller value if we count in influence of possibility to use dismantled conductors. Influence of possibility to use dismantled conductors is bigger than influences of technical documentation costs, differences in amortization and maintenance costs and additional costs. On specified sections repayment in years will be in period shorter than 10 years, even in case that there is need of additional investment at building new poles or in partly reconstruction. Additional advantages are, beside decrease of technical losses, improvement of voltage (especially at longer and more loaded low voltage feeders), monophase consumers will be distributed evenly on phases (unbalanced load is cause of additional losses) and updating of technical documentation. Further consideration should determine influences in differences in amortization and maintenance
- 7. Siniša Spremić, ED "Subotica", Segedinski put 22-24, 24000 Subotica (sinisa.spremic@su.ev.co.yu) costs for replacement with bigger cross-section. Possibility of building new low voltage and low and medium (mixed) voltage overhead lines, or mantling on existing lines new conductors AlFe 4x95 mm 2 at low voltage and possibility of building new medium voltage and mixed voltage overhead lines or mantling on existing lines new conductors AlFe 3x150 mm 2 at 10 kV and 20 kV voltage level (taking in count parameters of poles, consoles, isolation...) should be considered, too. During the work on technical solutions, loads and energy flows planning shall consider, with aim to give optimal conductor cross-section because other elements of overhead line must have respective mechanical parameters and this increases costs. Regardless of the fact that replacement with bigger cross-sections need big investment, I consider that we should immediately find out necessary financial support and make respective work organisation because this investment is repayable. Same analysis for 35 kV overhead lines is easier than for 0.4 kV, 10 kV and 20 kV voltage levels overhead lines. LITERATURE 1. Radne grupe, 2001, "Zbirka tehničkih preporuka ED Srbije", Tehnički savet EPS-a - Direkcija za distribuciju 2. Dragan Đapić, 2002, Program za računanje gubitaka u ED, Fakultet tehničkih nauka Novi Sad 3. J.P. Elektrovojvodina, 1992, Paket računarskih programa za izračunavanje gubitaka u elementima mreže, J.P. Elektrovojvodina