2. et al., 2013). Visible (VIS), NIR and SWIR sensitivity to variations in soil
moisture, leaf water content and bidirectional reflectance distribution
function (BRDF) for vegetated surfaces has been studied using radiative
transfer models (Jacquemoud et al., 2009; Latifovic, Cihlar, & Chen,
2003; Wang, Qu, Hao, & Zhu, 2008). However, the effect of bidirectional
reflectance factor (BRF) variations on EO-based vegetation indices is
currently not well documented for different plant functional types
and ecosystems. There is a need for ground-based continuous multi-
angular measurements suitable for a direct comparison and validation
of EO data products from polar orbiting instruments with sensors
influenced by day-to-day variations in sun-target-sensor geometry
impacting on the derived vegetation products (Fensholt, Huber,
Proud, & Mbow, 2010; Fensholt, Sandholt, Proud, Stisen, & Rasmussen,
2010) or products that provide a characterization of surface anisotropy
used to both determine global land surface albedos and nadir view-
angle-corrected reflectance (MODIS Surface Reflectance BRDF/Albedo)
(Lucht, Schaaf, & Strahler, 2000).
In this paper we present data and the setup of an automated
multi-angular field spectrometric system situated in the semi-arid
Senegalese Sahel. Unique to this system is that it provides regular
spectral measurements of a region with only sparse ground data coverage
and that not only VIS and NIR but also the SWIR spectral range is
measured. The semi-arid Sahel is characterized by extreme inter-annual
variability in rainfall (Nicholson, Dezfuli, & Klotter, 2012) thereby posing
one of the biggest obstacles to the achievement of food security in the
region (Kandji, Verchot, & Mackensen, 2006). Due to the highly variable
climate in the Sahel, temporal continuity in spectro-directional
measurements is important to get representative measures on the one
hand and to capture key transitions in ecosystem behavior associated
with disturbance and stress on the other hand (Gamon, Cheng, Claudio,
MacKinney, & Sims, 2006; Gamon, Rahman, Dungan, Schildhauer, &
Huemmrich, 2006).
The objective of this paper is twofold: (1) to outline the measurement
scheme and set up of the automated multi-angular field spectrometric
system and (2) to present first analyses of spectral anisotropy in the
spectral range from VIS to SWIR. Two different seasons were analyzed
to investigate the impact of anisotropic data on the use of two
well-known vegetation indices covering together both VIS/NIR/SWIR
wavelengths.
2. Materials and Methods
2.1. The Dahra field site
The field spectrometer system has been installed at the Dahra field
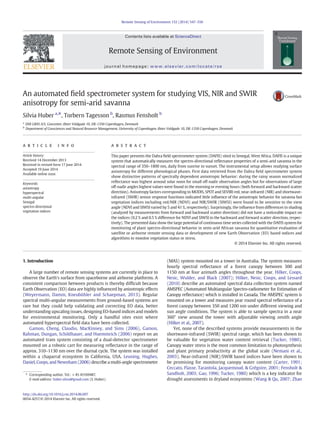
site in the semi-arid northern part of Senegal (15.40° N, 15.43° W)
(Fensholt & Sandholt, 2005; Fensholt, Sandholt, & Stisen, 2006)
(Fig. 1). The savanna ecosystem found at the area is similar to many
other parts of the Sahel (Hanan, Prevost, Diouf, & Diallo, 1991).
Fine-leaved annual grasses with a maximum height of 60 cm, such as
Schoenefeldia gracilis, Dactyloctenium aegupticum, Aristida mutabilis, and
Cenchrus bifloures dominate the herbaceous layer in the region
(Valenza & Diallo, 1972), but widely spaced perennial grasses with a
maximum height of 80 cm can also be found (Ridder, Stroosnijder,
Cisse, & van Kelulen, 1982). Tree and shrub canopy cover generally do
not exceed 5% and are dominated by two species: Balanites aegyptiaca
and Boscia senegalensis (Diallo, Diouf, Hanan, Ndiaye, & Prévost, 1991).
The soil type can be characterised as poorly developed formed on
sandy parent material of dunes or fluvial deposits (less than 3% clay).
The rainy season stretches from July to October and precipitation is
sparse and intermittent with annual totals ranging from 300 to
500 mm and is thus typical for the Sahelian environment. The Dahra
site, where measurements of climate, radiometry and fluxes have
been recorded since 2002, is characterized by a uniform vegetation
cover (Fig. 1) within a radius of at least 3 km from the fieldwork site
to reduce uncertainty in the point to pixel comparison (Fensholt,
Huber, Proud, & Mbow, 2010; Fensholt, Sandholt, Proud, Stisen, &
Rasmussen, 2010; Fensholt et al., 2006).
2.2. The Dahra field spectrometer system (DAFIS)
The DAFIS was installed in 2011 and consists of two ASD FieldSpec3®
spectrometers (ASD Inc., Colorado, USA). While one is mounted on a 12 m
mast pointing to the land surface (ASD-FStarget), the other one is mounted
on a 2 m high stand pointing to a Spectralon panel under a glass
dome (ASD-FSref) (Labsphere Inc., New Hampshire, USA) (Fig. 2).
Measurements are acquired at 15-minute intervals (corresponding to
the Meteosat Second Generation (MSG) acquisition scheme) from
sunrise to sunset and over the entire calendar year. The instruments are
Fig. 1. Location of the Dahra field site (Senegal) in the semi-arid Sahel. The north-southern boundaries of the Sahel can be defined by the 100 mm and 600–800 mm isohyets, respectively.
Photographs show the grassland savanna at the Dahra site (taken from south) in the dry season (upper photograph, taken on July 1, 2013) and at the very beginning of the rainy season
(lower photograph, taken on August 1, 2013) showing predominantly annual grasses and a tree cover of less than 5 %.
548 S. Huber et al. / Remote Sensing of Environment 152 (2014) 547–556
3. controlled by custom-made Matlab scripts. The Matlab code controls the
movement of the Trinamic (TMCM-1110) motor and saves the recorded
ASD data. The TMCM-1110 is a stepper motor controller module that can
be setup with a TMCL (TrinamicMotionControlLanguage) firmware
(TMCLTM
firmware manual). To move the motor to the seven positions,
we use the ROR (rotate right) command and the MVP (move to position)
command to move the motor back to the original position. All the
commands are sent via the Matlab code to the motor controller by the
serial port (COM1) in binary mode.
2.2.1. Radiometer setup for target measurements
The radiometer mounted on the mast (ASD-FStarget) provides
radiance measurements from the land surface from seven different
viewing zenith angles (nadir, 15°, 30°, 45° in eastern and western
directions) with viewing azimuth angles of 270° and 90°, respectively.
The stepper motor is designed to control the positioning of the optical
fiber (Fig. 2a). With the radiometer having a 25° instantaneous field of
view (IFOV) and being mounted at 10.5 m height, the corresponding
ground instantaneous field of view (GIFOV) at nadir is circular with a
radius of 2.34 m. The sampled area is ca. 17 m2
. For off-nadir observation
angles the sensor's footprint becomes elliptical (Table 1).
2.2.2. Radiometer setup for white reference measurements
A Reflective Cosine Receptor (RCR, no.A124700) is used to measure
full-sky-irradiance (Fig. 2c). The RCR includes a white Spectralon
panel (Labsphere Inc., New Hampshire, USA), a fiber optic mount
assembly and a protective dome of 22 cm in horizontal diameter.
The RCR assembly is a commercial product designed for long-term
installation (Analytical Spectral Devices Inc., 1999). The Spectralon
measurements are used as an irradiance reference for calculating
reflectance.
2.2.3. Measurement sequence and protocol
Each measurement sequence starts with the ASD-FSref from which an
optimization is conducted followed by a dark current (DC) measurement.
Optimization adjusts the sensitivity of the ASD detectors according to the
specific illumination conditions at the time of measurement to avoid
saturation of the detectors due to changing levels of downwelling
irradiance. Dark current is the measurement noise stemming from a
relatively small electric current generated by the thermal electrons
within the ASDs that flows through the devices even when no photons
Fig. 2. Mast at the Dahra field site with the position of (a) the stepper motor controlling the optical fiber for multi-angular target measurements, (b) one of the two ASD field spec and
(c) the Spectralon panel under the glass dome for white reference measurements.
Table 1
Change of the ground instantaneous field of view (GIFOV) relative to the observation
angle. Note that the major half axis of the GIFOV is changing asymmetrically in the
along (east-west) and across direction from the center point.
Observation
angle [°]
Major half axis
along sensor
track [m]
Major half axis
across sensor
track [m]
Sampled
area [m2
]
0 2.34 2.34 17.22
15 2.67 2.37 18.52
30 3.58 2.77 23.34
45 6.02 3.83 36.22
549S. Huber et al. / Remote Sensing of Environment 152 (2014) 547–556
4. are entering the devices. Therefore, DC has to be measured and subtracted
from the measurements at 350-1000 nm on a band-by-band basis while
the SWIR array (1000–1800 nm) has an automatic DC correction (each
radiometer consists of two detectors, one array in the visible-NIR domain
(350–1000 nm) and a second array in the SWIR range (1000–1800 nm)).
After the DC of ASD-FSref is determined, the white reference is measured.
Then, the ASD-FStarget radiometer is optimised and subsequently the DC
current is measured, followed by target measurements from seven
different viewing zenith angles. Finally, the ASD-FSref is again optimised,
the DC current measured and a white reference measurement taken.
For both radiometers, 30 scans are averaged to one measurement to
improve the signal-to-noise ratio (white reference, DC and at each of
the seven target measurements). Remaining poor quality measurements
caused by unfavorable weather conditions or irregular technical issues
were filtered by summing total solar irradiance in the range 350–1800
nm, calculating the fraction between the total solar irradiance in the
beginning and the end of the measurement sequence, and rejecting all
measurements with a fraction range outside of 0.95–1.05. Completion
of a measurement sequence takes less than a minute in total. Data are
stored as Digital Numbers (DNs) on a field computer and can be later
converted into physical values following the method in Analytical
Spectral Devices Inc. (1999).
2.3. Data handling
2.3.1. Sensor calibration
Before and after each rainy season the two ASD instruments are
calibrated against each other. Both fiber optic cables are aligned
pointing to a Spectralon panel so that both sensors measure incoming
irradiance. Following Hilker et al. (2010), corrected reflectance (ρ) can
be estimated from:
ρ ¼ ρraw
Eirradiance
Econtrol
ð1Þ
where ρraw is raw reflectance, Eirradiance is the Spectralon irradiance
measured with the ASD-FStarget, Econtrol is the Spectralon irradiance
measured with the ASD-FSref.
2.3.2. Temperature effects on the measured reflectance
We tested the sensitivity of the instrument to temperature by
altering the temperature inside the ASD box during DOY 13 and 15 in
2013. While altering the temperature, we did a similar relative sensor
calibration setup as described above. The measurements were conducted
in 5 minute intervals under clear sky conditions; the illumination
conditions did not change during the inter-calibration procedure.
Then the reflectance of the Spectralon panel was measured. Also offset
dependency on temperature between instruments was checked by
taking measurements in complete darkness. During the measurements,
the temperature in the boxes containing each of the two ASDs was
altered by placing buckets with ice and boiling water inside the boxes
for 2 hours, to cover most of the temperature range (30–50 °C)
observed at the Dahra site.
We did not see any sensitivity to temperature for the ASD set up
(Fig. 3). The measured variability is within the measurement error of
the ASD instruments (Analytical Spectral Devices Inc., 1999). Additionally,
there were no temperature effects for the offset of the ASD instruments,
while the average offset range was very small (b0.0003 W m-2
) (Fig. 3
b). It was not possible to alter the temperature inside the ASD box during
the temperature experiment to cover the full range at which the ASDs
operate. However, we captured the majority of the range where we
expect the measurements to be sensitive to temperature. Mainly the
lower temperatures were not captured, but those conditions mirror
the “normal” operation range of the ASDs. In the VNIR range the ASD
instruments work with silicon detectors which were reported to be
very stable with respect to temperature (Walthall, Roujean, & Morisette,
2000) and the SWIR InGaAs photodiodes are thermoelectrically cooled
(Analytical Spectral Devices Inc., 1999).
2.4. Data analysis
2.4.1. Normalized reflectance
We investigated the spectral anisotropic behavior of the savanna for
the rainy and the dry season to assess the influence of the canopy
structure on reflectance signatures and vegetation indices calculated
from VIS, NIR and SWIR information. Fifteen days at the peak of the
rainy season in 2011 (DOY 237–251) and during the dry season in
2012 (DOY 71–85) were selected. Only days with full data coverage
were used to prevent bias in the results from including days with an
incomplete dynamic range of measurements. The median reflectance
was extracted for every 15 minutes, each measured angle and wavelength.
Then, the ratio between the median reflectance for each wavelength and
the daily average reflectance for each wavelength was calculated. This
gives a fraction of how the reflectance spectra vary over the day in
relation to the daily average (in the following referred to as the normalized
reflectance).
2.4.2. Anisotropy factor
In order to assess the influence of the satellite spectral bandwidth
upon the target's anisotropy we spectrally resampled the original ASD
spectra to approximate the response of MODIS, SEVIRI (aboard MSG)
and SPOT Vegetation sensors by using their spectral response functions
(Fig. 4).
The bandwidths of the three sensors' Red, NIR and SWIR bands are
shown in Table 2.
These three sensors were selected because they all cover the VIS, NIR
and SWIR spectral range and data from these sensor systems are widely
used. We have chosen to calculate the anisotropy factor (ANIF) (Eq. (2))
Fig. 3. The temperature effect on the reflectance spectra from measurements done at DOY 13 and 15, January 2013; a) average reflectance 350–1800 nm of a Spectralon panel against
temperature inside the ASD box, and b) average radiance during complete dark conditions against temperature inside the ASD box.
550 S. Huber et al. / Remote Sensing of Environment 152 (2014) 547–556
5. from the resampled spectra to compare anisotropy between the different
sensors. The ANIF can be defined as the portion of radiation reflected into
a specific view direction relative to the nadir reflectance (Sandmeier,
Muller, Hosgood, & Andreoli, 1998):
ANIF λ; θs; φs; θv; φvð Þ ¼
ρ λ; θs; φs; θv; φvð Þ
ρ0 λ; θs; φsð Þ
dimensionless½ Š; ð2Þ
where, ρ = bi-directional reflectance factor, ρ0 = nadir reflectance
factor, λ = wavelength, θ = zenith angle, = azimuth angle, s = illumi-
nation direction, and v = viewing direction.
3. Results and Discussion
3.1. Reflectance measurements
The grassland savanna at the Dahra field site has a pronounced
seasonality, which is also reflected in the selected spectral signatures
(Fig. 5). The average spectrum for the rainy season shows the typical
features of green vegetation with a prominent green peak, increased
chlorophyll absorption at 680 nm and increased reflectance in the NIR
wavelengths and a peak at about 1600 nm. The reflectance spectrum
of the dry season compares rather with a signature measured for soil,
illustrating that no green vegetation remained (no green peak). The
higher reflectance between 1400 and 1800 nm for the dry season as
compared to the rainy season shows that plant water is a good absorber
of SWIR energy: the higher the leaf water content, the lower the SWIR
reflectance because of fewer interfaces of intercellular spaces where
incident energy is scattered (Zarco-Tejada, Rueda, & Ustin, 2003).
3.2. Normalized reflectance
The spectro-directional behavior of the vegetation cover during the
rainy season is shown in Fig. 6. The figure shows distinctively that
anisotropic effects are wavelength dependent and more pronounced
with increasing observation angles. The noise visible at 1190 and
1450 nm is related to the atmospheric water absorption bands.
The anisotropy found in the data of the nadir, 15ºW and 15ºE
observations is similar, with highest normalized reflectance at around
13:00 (local solar noon) in the VIS and SWIR range (Fig. 5). In these
high absorbing spectral ranges (e.g., blue and red wavelengths) less
radiation is available for further scattering which tends to reduce the
contrast between shadowed and illuminated areas within the canopy
and hence BRDF effects (Hapke, DiMucci, Nelson, & Smythe, 1996;
Kimes, 1983). In contrast, the NIR range shows a rather isotropic behavior
due to increased multiple scattering (Kimes, 1983). The high normalized
reflectance for nadir observations at solar noon for VIS and SWIR is
related to the relatively sparse fractional green vegetation cover. Well
visible when looking from nadir is the soil background and dry plant
material (characterized by higher reflectance values in the VIS and the
SWIR as compared to photosynthetic active material, see Fig. 5) thereby
increasing the measured signal for low solar zenith angles around local
solar noon.
With increasing off-nadir viewing angles the highest normalized
reflectance is measured in the morning (45°W) and evening hours
(45°E) because in erectophile canopies only the illuminated top part
of the canopy can be seen while the amounts of shadowed fractions of
lower canopy components are hidden (Kimes, 1983). This phenomenon
is visible in Fig. 5 (30°E/W and 45°E/W). It is particularly so when
viewed from the direction of illumination (Kimes, 1984), e.g, in the
morning hours for a westward looking sensor when the sensor
measures back-scattered light. The solar zenith angle reaches 45°
degrees shortly before 10 and after 16 o'clock (local solar time),
respectively, leading to a hotspot situation around those times for the
most extreme off-nadir angles. For larger off-nadir viewing angles,
anisotropy was also observed for NIR in contrary to the nadir and
15°E/W observations.
Interestingly, our observations revealed very high forward scattering
(exceeding the normalized reflectance values observed for the
backward scattering) in particular for 30° and 45° westward-looking
off-nadir angles for evening hours (also data from the eastward-looking
angles show forward scattering in the morning hours, but with lower
normalized reflectance values). Possibly, the waxy coatings of the plants
seen under these specific angles lead to extreme specular (mirror-like)
surface reflectance which substantially enhances forward scattering
(Govaerts, Jacquemoud, Verstraete, & Ustin, 1996; Grant, 1987). Also
diffuse irradiance is causing higher forward scattering (Privette &
Vermote, 2004) which corresponds well with general high loads of
aerosols and water vapor in the semi-arid Sahel causing significant
diffuse irradiance for increased solar zenith angles (longer path through
SEVIRIMODIS
SPOT
Fig. 4. Spectral response functions of MODIS, SEVIRI and SPOT for red, NIR and SWIR wavelength ranges.
Table 2
Red, near infrared (NIR) and shortwave infrared (SWIR) bandwidths for MODIS, SEVIRI
and SPOT, respectively.
Sensor Red [nm] NIR [nm] SWIR [nm]
MODIS 620-670 (50) 841-876 (35) 1628-1652 (24)
SEVIRI 560-710 (150) 740-880 (140) 1500-1780 (280)
SPOT 610-680 (70) 780-890 (110) 1580-1750 (170)
551S. Huber et al. / Remote Sensing of Environment 152 (2014) 547–556
6. Rainy season
Dry season
Fig. 5. Mean nadir spectra for the rainy season 2011 (DOY 237–251), the dry season 2012. (DOY 71–85) and dry soil 2013 (DOY 14).
Fig. 6. Normalized reflectance (fraction of the time-specific reflectance spectra divided by the daily average) for the rainy season 2011 (DOY 237–251) measured from sunrise to sunset
(solar noon is around 13:00). At the upper right corner of each figure the sensor view angle is indicated (e.g., 45° W: sensor measuring 45° off-nadir towards west). In the first three figures
(15–45° W angles), in the morning, only back-scattered radiation reaches the sensor (solar irradiance from east) while forward-scattered radiation is measured by the sensor in the
evening hours (solar irradiance from West). In the last three figures (15–45° E angles) the constellation is the other way round.
552 S. Huber et al. / Remote Sensing of Environment 152 (2014) 547–556
7. the atmosphere in the morning and the evening hours). This
phenomenon is less evident in the data of the eastward-looking angles
and is likely to be caused by shading from clumping of a group of trees
(Acacia Senegal) located east of the tower (visible in the right part of the
photo of Fig. 1). Another possible explanation could be diurnal changes
within the atmosphere causing changes in the diffuse/direct radiation
ratio. This has been reported for Senegal (Drame, Bilal, Camara,
Sambou, & Gaye, 2012) where a strong diurnal fluctuation in the
diffuse/direct radiation ratio (the diffuse radiation increasing in the
afternoon) during the rainy season is observed due to the presence of
cloud droplets. Finally, it could also be caused by heterogeneous ground
vegetation affecting the reflectance measurements differently east and
west of the tower.
Measurements during the dry season reveal much less anisotropic
behavior as compared to the rainy season and more symmetric patterns
regarding the eastward and westward-looking geometry, respectively
(Fig. 7). The plants appear brownish and dry (Fig. 5) and accordingly
the optical properties are completely changed. Only little irradiance is
absorbed and therefore more radiation is available for scattering
(Kimes, 1983) causing the surface reflectance to appear more isotropic.
Also, the scattering processes are mainly affected by the canopy
architecture which is assumed to be spectrally independent
(Camillo, 1987) thereby producing wavelength independent normalized
reflectance patterns over the course of the day. Only for the 30 and 45°
off-nadir viewing angles pronounced forward scattering was measured
in the morning and evening hours for eastward and westward looking
directions, respectively. The geometric condition together with the
waxy coatings of the plants might explain the extreme specular
(mirror-like) surface reflectance observed in the data. The forward
scattering is most distinctive in the VIS-NIR range, but also existent in
the SWIR range.
3.3. Influence of spectral bandwidth on anisotropy of red, NIR and SWIR
bands
In order to assess the influence of the spectral bandwidth on the
target's anisotropy we compared the response of MODIS, SEVIRI and
SPOT Vegetation sensors (resampled from ASD data). As can be seen
in table 2, the bandwidths among the sensors vary considerably, with
SEVIRI having the broadest bandwidths. However, there is almost no
difference between the ANIFs for the different sensors (Fig. 8). For
observations made during the rainy season (Fig. 8a), only SEVIRI's red
band has slightly higher ANIF values for measurements for observation
angles of 30° or larger as compared to MODIS and SPOT. This difference
might be related to the bandwidth for red of SEVIRI which is much
broader (150 nm) than for MODIS (50 nm) and SPOT (70 nm)
Fig. 7. Same as Fig. 5 but for the dry season 2012 (DOY 71–85) measured from sunrise to sunset (solar noon is around 13:00).
553S. Huber et al. / Remote Sensing of Environment 152 (2014) 547–556
8. (Table 2). Yet, a distinct difference in the general pattern appears for the
rainy and dry season: during the rainy season, the ANIFs for the red and
the SWIR bands show a similar shape since photosynthetically active
leaves absorb irradiance in both wavelengths (chlorophyll and water
respectively) while the NIR irradiance is mostly reflected or transmitted
in the mesophyll of the plant material.
For the dry season observations (Fig. 8b), the ANIFs of all wavebands
follow the same pattern; since there is no water and chlorophyll in the
senescent plant material (limited absorption), the red and SWIR
wavebands show the same pattern as the NIR. ANIFs are increasing
with sensor viewing angle since more top of the vegetation canopy is
viewed and soil and shading effects decreases (Kimes, 1983). However,
at the 45° angle, the ANIFs are decreasing as compared to the ANIFs at
30°. It is clear in the ANIFs of both the dry and the rainy season that
the patterns are not following the same shape in the eastern and the
western direction as was also the case for the normalized reflectance
in Figs. 6 and 7 which is likely to be caused by the distribution of trees
and shrubs in the vicinity of the sensor field of view not being 100%
uniform (natural savanna).
3.4. Influence of scattering direction on the reflectance of red, NIR and SWIR
bands
In order to assess the influence of forward and backward scattering
directions for the red, NIR and SWIR bands upon the target anisotropic
behavior we analyzed the reflectance for these bands with a MODIS
sensor configuration (resampled from ASD data) using median
measurements from 9:00–10:00 for the dry (DOY 71–85) and rainy
(DOY 237–251) seasons (Fig. 9) (also afternoon measurements could
have been used). During morning hours forward and backward scattering
is occurring for the measurements in the eastern and western directions,
respectively (as shown in the normalized reflectance plots in Figs. 6
and 7). For all three spectral bands, higher reflectance was observed in
the backward scattering direction as compared to the forward scattering
direction, due to shading effects in the latter (Fig. 9). Also the characteris-
tic bowl-shaped reflectance pattern as a function of the sensor viewing
angle is present for all wavelengths during both the dry and rainy season
as also found in (Deering, Eck, & Banerjee, 1999; Holben & Fraser, 1984;
Huete, Hua, Qi, Chehbouni, & Vanleeuwen, 1992; Jin et al., 2002). Howev-
er, this pattern is less distinctive for the SWIR during the rainy season as
compared to red and NIR.
The effect of spectrally dependent anisotropic behavior of the savanna
(Fig. 9) on vegetation indices like the Normalized Difference Vegetation
Index (NDVI = NIR-Red/NIR + Red) and Shortwave Infrared Water
Stress Index (SIWSI = NIR-SWIR/NIR + SWIR) is analyzed for the rainy
season. As can be seen in Fig. 10, viewing angles have a strong impact
on both vegetation indices with increasing index values for larger
off-nadir viewing angles. The band specific reflectance differences for
off nadir/nadir viewing geometry (red: 0.31–0.23 = 0.08; NIR: 0.57–
0.43 = 0.13; SWIR: 0.31–0.23 = 0.08) produce different index values
for off nadir/nadir viewing geometry (5 % difference for NDVI and 41 %
for SIWSI). The especially pronounced view angle dependency for the
SIWSI can be explained by the smaller difference in absolute reflectance
values between the bands (NIR and SWIR). In the case of a vegetation
cover that still allows the soil to be seen from the sensor, another
contributing factor could be that the difference in SWIR reflectance
between soil and vegetation is more pronounced than for red reflectance
(Fig. 5). These findings are important for the evaluation of satellite based
measurements where the disentangling between the impact from both
viewing angle and the atmosphere can only be conducted from radiative
transfer models (Holben & Fraser, 1984).
Fig. 8. Anisotropy factors for MODIS, SPOT and SEVIRI, respectively, obtained between 12:00 and 14:00: a) during the rainy season (DOY 237–251 2011) and b) during the dry season (DOY
71-85 2012).
Fig. 9. Red, NIR and SWIR band reflectance (using the MODIS sensor configuration) for
different viewing geometry obtained during the dry season (DOY 71-85 2012) (left) and
rainy season (DOY 237-251 2011) (right). Values are calculated from the median of
measured reflectances between 9:00 and 10:00 for the dry and rainy seasons, respectively.
554 S. Huber et al. / Remote Sensing of Environment 152 (2014) 547–556
9. Many satellite remote sensing based studies have pointed out the
problem of band specific differences in the BRF causing NDVI to increase
in the forward scatter direction because of shading effects being more
pronounced in the red part of the spectrum as compared to NIR (e.g.,
Cihlar, Manak, & Voisin, 1994; Fensholt, Huber, Proud, & Mbow, 2010;
Fensholt, Sandholt, Proud, Stisen, & Rasmussen, 2010; Gao, Jin, Schaaf,
& Strahler, 2002) when using a maximum compositing approach
(Holben, 1986) and for an erectophile canopy structure like savanna
in particular (Goel & Kong, 1989). Also in situ based measurements
from semi-arid grassland (Huete et al., 1992) have shown NDVI
sensitivity to directional effects. Surprisingly, Fig. 10 shows that both
NDVI and SIWSI produce similar index values in the eastern (forward
scatter) and western (backward scatter) direction, indicating that the
band specific effects of backward and forward scattering (Fig. 9) cancel
out during the index calculations. The observed difference between
forward and backward scatter direction reflectance (in Fig. 9) is
compensated for in the index calculation by the band specific differences
in the absolute level of reflectance values, thereby producing almost
identical NDVI and SIWSI index values in the forward and backward
scatter direction (0.2 % NDVI difference and 0.5 % SIWSI difference
between forward and backward scatter directions (avg. of 15, 30 and
45° angles)).
4. Conclusions/Outlook
First data from the Dahra field spectrometer system reveal significant
differences between measurements taken during the rainy and dry sea-
son. We observed much more pronounced anisotropy for measurements
taken above a green vegetation canopy as compared to the dry season.
The complex radiative processes within a green canopy with absorption,
reflection, multiple scattering led to distinctive patterns for the VIS, NIR
and SWIR. We found most pronounced patterns for the VIS and SWIR
ranges, where green plants (chlorophyll and water) absorb large parts
of the incoming radiation as compared to a dry vegetation canopy.
When comparing reflectance data resampled to MODIS, SPOT and
SEVIRI sensor configurations, the ANIFs per band were very similar for
the different sensors, indicating that differences in spectral bandwidths
do not influence much the anisotropic behavior of savanna. Yet, satellite
based measurements from different sensors also imply changing GIFOVs
which influence the measured reflectance. Vegetation indices including
red/NIR (NDVI) and NIR/SWIR (SIWSI) were found to be sensitive to
the view angle with the influence on NIR/SWIR being most severe (5 %
difference for NDVI and 41 % for SIWSI). However, for savanna no
influence on vegetation indices was found as a function of forward vs.
backwards scatter directions (0.2 % and 0.5 % difference for NDVI and
SIWSI, respectively).
Ground-based measurements of wavelength-dependent anisotropy
of surface reflectance for a savanna landscape during different
phenological stages are crucial for understanding the accuracy/uncer-
tainty related to traditional EO-based vegetation indices but also for
the development of new indices and algorithms e.g. including SWIR
based water stress. Foreseen is also research related to upscaling studies
including spectroradiometers mounted on Unmanned Aerial Vehicles
for inter-comparison of hyperspectral reflectance data with carbon
flux measurements conducted at the Dahra site. The optical data mea-
sured at 15-minute time intervals are very well suited to be compared
with highly variable water and carbon fluxes between the biosphere
and the atmosphere that are typical for tropical water limited savanna
landscapes.
At present very few radiometers on the market cover wavelengths
beyond NIR because of the different instrumental requirements for
SWIR. The ASD instruments used at the Dahra site covering VIS/NIR/
SWIR are very costly and actually not designed for fully automatic
continuous outdoor recordings. Measurements at the Dahra site were
initiated in 2011 and the remote controlling of the instruments using
scripting language causes no problems. However, several periods of
ASD malfunctioning have encountered over the three years of operation.
Occasionally, the problem could be solved from local support (computer
restarting etc.), but shipping of the instruments to the manufacturer was
also frequently required being time consuming; in general, the ASD based
system has shown to be quite costly. The environment in which the
DAFIS is operating is very harsh with highly variable temperatures and
high loads of dust in the atmosphere during the dry season. Considering
this challenge, a more low-tech, reliable and cheaper system providing
the same spectral configuration would be preferable.
Acknowledgments
We are thankful to the three reviewers for their helpful comments
which contributed to improve this manuscript. We would also like to
thank all the individuals involved in the field campaigns in Senegal as
well as the maintenance and management of the Dahra field station.
This research is part of the project entitled Earth Observation based
Vegetation productivity and Land Degradation Trends in Global
Drylands. The project is funded by the Danish Council for Independent
Research (DFF) Sapere Aude program.
References
Analytical Spectral Devices, Inc. (ASD) (1999). Technical Guide. In David C. Hatchell (Ed.),
Analytical Spectral Devices, Inc (4th ed.). CO, USA: Boulder.
Camillo, P. (1987). A Canopy Reflectance Model Based on an Analytical Solution to the
Multiple-Scattering Equation. Remote Sensing of Environment, 23(3), 453–477.
Carter, G. A. (1991). Primary and Secondary Effects of Water-Content on the Spectral
Reflectance of Leaves. American Journal of Botany, 78(7), 916–924.
Ceccato, P., Flasse, S., Tarantola, S., Jacquemoud, S., & Grégoire, J. -M. (2001). Detecting
vegetation leaf water content using reflectance in the optical domain. Remote
Sensing of Environment, 77(1), 22–33.
Cihlar, J., Manak, D., & Voisin, N. (1994). AVHRR bidirectional reflectance effects and
compositing. Remote Sensing of Environment. http://dx.doi.org/10.1016/0034-
4257(94)90116-3.
Deering, D. W., Eck, T. F., & Banerjee, B. (1999). Characterization of the reflectance anisot-
ropy of three Boreal forest canopies in spring-summer. Remote Sensing of
Environment, 67, 205–229. http://dx.doi.org/10.1016/S0034-4257(98)00087-X.
Diallo, O., Diouf, A., Hanan, N. P., Ndiaye, A., & Prévost, Y. (1991). AVHRR monitoring of
savanna primary production in Senegal, West Africa: 1987–1988. International
Journal of Remote Sensing. http://dx.doi.org/10.1080/01431169108929725.
Drame, M., Bilal, B. O., Camara, M., Sambou, V., & Gaye, A. (2012). Impacts of aerosols on
available solar energy at Mbour, Senegal. Journal of Renewable and Sustainable
Energy, 4.
Fensholt, R., Huber, S., Proud, S. R., & Mbow, C. (2010). Detecting Canopy Water Status
Using Shortwave Infrared Reflectance Data From Polar Orbiting and Geostationary
Platforms. IEEE Journal of Selected Topics in Applied Earth Observations and Remote
Sensing. http://dx.doi.org/10.1109/JSTARS.2010.2048744.
Fensholt, R., & Sandholt, I. (2003). Derivation of a shortwave infrared water stress index
from MODIS near- and shortwave infrared data in a semiarid environment. Remote
Sensing of Environment, 87(1), 111–121.
Fensholt, R., & Sandholt, I. (2005). Evaluation of MODIS and NOAA AVHRR vegetation
indices with in situ measurements in a semi-arid environment. International Journal
of Remote Sensing, 26, 2561–2594. http://dx.doi.org/10.1080/01431160500033724.
Fensholt, R., Sandholt, I., Proud, S. R., Stisen, S., & Rasmussen, M. O. (2010). Assessment of
MODIS sun-sensor geometry variations effect on observed NDVI using MSG SEVIRI
Fig. 10. (a) The Normalized Difference Vegetation Index (NDVI) and (b) the Shortwave
Infrared Water Stress Index (SIWSI) for different sensor viewing geometries. Red, NIR
and SWIR band reflectance (using the MODIS sensor configuration) for different viewing
geometry obtained during the rainy season (DOY 237-251 2011). Values are calculated
from the median of measured reflectances between 9:00 and 10:00.
555S. Huber et al. / Remote Sensing of Environment 152 (2014) 547–556
10. geostationary data. International Journal of Remote Sensing. http://dx.doi.org/10.1080/
01431160903401387.
Fensholt, R., Sandholt, I., & Stisen, S. (2006). Evaluating MODIS, MERIS, and VEGETATION —
Vegetation indices using in situ measurements in a semiarid environment. IEEE
Transactions on Geoscience and Remote Sensing, 44(7), 1774–1786. http://dx.doi.org/
10.1109/tgrs.2006.875940.
Gamon, J. A., Cheng, Y. F., Claudio, H., MacKinney, L., & Sims, D. A. (2006). A mobile tram
system for systematic sampling of ecosystem optical properties. Remote Sensing of
Environment, 103(3), 246–254. http://dx.doi.org/10.1016/j.rse.2006.04.006.
Gamon, J. A., Rahman, A. F., Dungan, J. L., Schildhauer, M., & Huemmrich, K. F. (2006).
Spectral Network (SpecNet) — What is it and why do we need it? Remote Sensing
of Environment, 103(3), 227–235. http://dx.doi.org/10.1016/j.rse.2006.04.003.
Gao, B. C. (1996). NDWI — A normalized difference water index for remote sensing of
vegetation liquid water from space. Remote Sensing of Environment, 58(3), 257–266.
Gao, F. G. F., Jin, Y. J. Y., Schaaf, C. B., & Strahler, A. H. (2002). Bidirectional NDVI and
atmospherically resistant BRDF inversion for vegetation canopy. IEEE Transactions
on Geoscience and Remote Sensing, 40. http://dx.doi.org/10.1109/TGRS.2002.800241.
Goel, N. S., & Kong, J. A. (1989). Inversion of Canopy Reflectance Models for Estimation of
Biophysical Parameters from Reflectance Data. In G. Asrar (Ed.), Theory and Applications
of Optical remote Sensing (pp. 205–251). Washington, D.C.: Wiley.
Govaerts, Y. M., Jacquemoud, S., Verstraete, M. M., & Ustin, S. L. (1996). Three-dimensional
radiation transfer modeling in a dicotyledon leaf. Applied Optics, 35(33), 6585–6598.
http://dx.doi.org/10.1364/Ao.35.006585.
Grant, L. (1987). Diffuse and specular characteristics of leaf reflectance. Remote Sensing of
Environment, 22(2), 309–322. http://dx.doi.org/10.1016/0034-4257(87)90064-2.
Hanan, N. P., Prevost, Y., Diouf, A., & Diallo, O. (1991). Assessment of desertification
around deep wells in the Sahel using satellite imagery. Journal of Applied Ecology,
28, 173–186. http://dx.doi.org/10.2307/2404123.
Hapke, B., DiMucci, D., Nelson, R., & Smythe, W. (1996). The cause of the hot spot in
vegetation canopies and soils: Shadow-hiding versus coherent backscatter. Remote
Sensing of Environment, 58(1), 63–68.
Hilker, T., Coops, N. C., Nesic, Z., Wulder, M. A., & Black, A. T. (2007). Instrumentation and
approach for unattended year round tower based measurements of spectral reflec-
tance. Computers and Electronics in Agriculture, 56(1), 72–84. http://dx.doi.org/10.
1016/j.compag.2007.01.003.
Hilker, T., Nesic, Z., Coops, N. C., & Lessard, D. (2010). A new, automated, multiangular
radiometer instrument for tower-based observations of canopy reflectance (AMSPEC
II). Instrumentation Science and Technology, 38(5), 319–340.
Holben, B. (1986). Characteristics of maximum-value composite images from temporal
AVHRR data. International Journal of Remote Sensing, 7(11), 1417–1434. http://dx.
doi.org/10.1080/01431168608948945.
Holben, B., & Fraser, R. S. (1984). Red and near-infrared sensor response to off-nadiir
viewing. International Journal of Remote Sensing, 5(1), 145–160. http://dx.doi.org/10.
1080/01431168408948795.
Huete, A. R., Hua, G., Qi, J., Chehbouni, A., & Vanleeuwen, W. J. D. (1992). Normalization of
Multidirectional Red and Nir Reflectances with the Savi. Remote Sensing of
Environment, 41(2–3), 143–154.
Jacquemoud, S., Verhoef, W., Baret, F., Bacour, C., Zarco-Tejada, P. J., Asner, G. P., François,
C., & Ustin, S. L. (2009). PROSPECT + SAIL models: A review of use for vegetation
characterization. Remote Sensing of Environment. http://dx.doi.org/10.1016/j.rse.
2008.01.026.
Jin, Y. J. Y., Gao, F. G. F., Schaaf, C. B., Li, X. L. X., Strahler, A. H., Bruegge, C. J., & Martonchik, J.
V. (2002). Improving MODIS surface BRDF/Albedo retrieval with MISR multiangle
observations. IEEE Transactions on Geoscience and Remote Sensing, 40. http://dx.doi.
org/10.1109/TGRS.2002.801145.
Kandji, S. T., Verchot, L., & Mackensen, J. (2006). Climate change and variability in the Sahel
region: impacts and adaptation strategies in the agricultural sector. Environment, 48.
Kimes, D. S. (1983). Dynamics of Directional Reflectance Factor Distributions for Vegetation
Canopies. Applied Optics, 22(9), 1364–1372.
Kimes, D. S. (1984). Modelling the directional reflectance from complete homogeneous
vegetation canopies with various leaf-orientation distributions. Journal of the Optical
Society of America A: Optics and Image Science, and Vision, 1(7), 725–737.
Latifovic, R., Cihlar, J., & Chen, J. C. J. (2003). A comparison of BRDF models for the normaliza-
tion of satellite optical data to a standard Sun-target-sensor geometry. IEEE Transactions
on Geoscience and Remote Sensing, 41. http://dx.doi.org/10.1109/TGRS.2003.811557.
Leuning, R., Hughes, D., Daniel, P., Coops, N. C., & Newnham, G. (2006). A multi-angle
spectrometer for automatic measurement of plant canopy reflectance spectra.
Remote Sensing of Environment, 103(3), 236–245. http://dx.doi.org/10.1016/j.rse.
2005.06.016.
Lucht, W., Schaaf, C. B., & Strahler, A. H. (2000). An algorithm for the retrieval of albedo
from space using semiempirical BRDF models. IEEE Transactions on Geoscience and
Remote Sensing, 38. http://dx.doi.org/10.1109/36.841980.
Nemani, R. R., Keeling, C. D., Hashimoto, H., Jolly, W. M., Piper, S. C., Tucker, C. J., &
Running, S. W. (2003). Climate-driven increases in global terrestrial net primary
production from 1982 to 1999. Science (New York, N.Y.), 300, 1560–1563. http://dx.
doi.org/10.1126/science.1082750.
Nicholson, S. E., Dezfuli, A. K., & Klotter, D. (2012). A Two-Century Precipitation Data Set
for the Continent of Africa. Bulletin of the American Meteorological Society. http://dx.
doi.org/10.1175/BAMS-D-11-00212.1.
Privette, J. L., & Vermote, E. (2004). The impact of atmospheric effects on directional
reflectance measurements. In M. v. Schoenermark, B. Geiger, & H. P. Roeser (Eds.),
Reflectance Properties of vegetaiton and Soil (pp. 225–241). Berlin: Wissenschaft und
Technik Verlag.
Ridder, N., Stroosnijder, L., Cisse, A. M., & van Kelulen, H. (1982). Productivity of Sahelian
rangeland, a study of the soils, the vegetation and the exploitation of the natural
resources: PPS course book. Wageningen, The Netherlands: Wageningen Agricultural
University, Dept. of Soil Science and Plant Nutrition.
Sandmeier, S., Muller, C., Hosgood, B., & Andreoli, G. (1998). Physical Mechanisms in
Hyperspectral BRDF Data of Grass and Watercress. Remote Sensing of Environment,
66(2), 222–233. http://dx.doi.org/10.1016/S0034-4257(98)00060-1.
TMCLTM
firmware manual (d). http://www.mocontronic.de/files/TMCM-1110_TMCL_
firmware_manual.pdf (accessed 22 March 2014)
Tucker, C. J. (1980). Remote-Sensing of Leaf Water-Content in the near-Infrared. Remote
Sensing of Environment, 10(1), 23–32.
Valenza, J., & Diallo, A. K. (1972). Etude des pâturages naturels du nord Sénégal. Rapport et
Cartes: Etude Agrostologique I.E.M.V.T.
Walthall, C., Roujean, J. L., & Morisette, J. (2000). Field and landscape BRDF optical
wavelength measurements: Experience, techniques and the future. Remote Sensing
Reviews, 18(2), 503–531.
Wang, L., & Qu, J. J. (2007). NMDI: A normalized multi-band drought index for monitoring
soil and vegetation moisture with satellite remote sensing. Geophysical Research
Letters. http://dx.doi.org/10.1029/2007GL031021.
Wang, L., Qu, J. J., Hao, X., & Zhu, Q. (2008). Sensitivity studies of the moisture effects on
MODIS SWIR reflectance and vegetation water indices. International Journal of Remote
Sensing. http://dx.doi.org/10.1080/01431160802226034.
Weyermann, J., Damm, A., Kneubühler, M., & Schaepman, M. E. (2013). Correction of
Reflectance Anisotropy Effects of Vegetation on Airborne Spectroscopy Data and
Derived Products. Geoscience and Remote Sensing, IEEE Transactions on, PP(99), 1–12.
http://dx.doi.org/10.1109/tgrs.2013.2242898.
Zarco-Tejada, P. J., Rueda, C. A., & Ustin, S. L. (2003). Water content estimation in
vegetation with MODIS reflectance data and model inversion methods. Remote
Sensing of Environment, 85(1), 109–124. http://dx.doi.org/10.1016/S0034-4257(02)
00197-9.
Zhao, S. H., Wang, Q., Zhang, F., Yao, Y. J., Qin, Q. M., You, L., & Li, Y. (2013). Drought
Mapping Using Two Shortwave Infrared Water Indices with MODIS Data under
Vegetated Season. Journal of Environmental Informatics, 21, 102–111.
556 S. Huber et al. / Remote Sensing of Environment 152 (2014) 547–556