2 florida safety effects of left exit on freeway jz
1. 1
Safety Effects of Left exit on Freeway: A Case Study in Florida, USA
J. Zhao H. Zhou
Abstract
The traffic flow at three left exits was recorded and data collected include vehicle speed, traffic volume, lane change
maneuver, traffic conflict and exit geometric configuration. The crash records for 11 left exits and 63 right exits were
collected as well. The data analysis results showed that speed deviations on optional lanes at the left exits were less
than 25 kph and will not cause a big safety issue. The observational study indicated that about 3% to 6% vehicles
made lane change maneuvers along the 1000 feet freeway segment before the left exits, and the traffic conflict rate on
the same freeway segment was approximately 10-13 per 1,000 vehicles, but it could not be concluded yet whether the
lane change maneuver or traffic conflict rate for left exits were significantly different with those for right exits. The
cross sectional before-and-after study indicated that the crash rate and annual average crash frequency for left exits
were higher than that for right exits. For one-lane exits, the percent of injury plus fatal crashes in total crashes for left
exits were also significantly higher than that for right exits. However, the differences between left and right exits
were not significant for two-lane exits. Future research on traffic sign for left exit and traffic conflict study on right
exit were also recommended at the end of the paper.
Keywords
Left exit, Lane change maneuver, Traffic conflict study, Cross sectional before-and-after study
1. Introduction
The abnormal left exits on freeways were commonly regarded to result in safety issues related to drivers’
expectancy. In the past eight years, three men have died after smashing into the barrier wall of the left exit
from I-275 to I-375 in St. Petersburg, Florida, USA. It was once criticized that left exits are outdated and
unsafe (Harwell, 2009). However, no conclusions have been drawn on the safety performance of the left
exit through systematic research activities yet.
Funded by the Florida Department of Transportation (FDOT), this research evaluated the safety
performances of several left exits and compared it with that of right exits through traffic conflict study
and cross sectional before-and-after study. Three left exits in Tampa, Florida were selected for the traffic
conflict study, which include the eastbound I-4@50th
St., the southbound I-275@I-375, and the
northbound I-275@31st
St., and 11 left exits and 63 nearby right exits were selected for the cross sectional
before-and-after study. This paper is to summarize the main findings and suggestions derived from this
research work.
2. Literature Review
Although some studies have discussed freeway exits during the past several decades, none of them
focused on the safety performance of left exits. To examine the impact of ramp locations on traffic safety,
Cirillo et al. (1969) did an innovative investigation of the traffic safety on the interstate highway system.
The study found that a relationship between crash frequency and geometric elements could be established.
About thirty years later, another research team (Garber & Fontaine, 1999) developed a guideline to search
the safety characteristics for the optimal ramp design. The newest instruction for exit design is the
“Freeway and Interchange Geometric Design Handbook” (Leisch, 2006) published by the Institute of
Transportation Engineers (ITE) in 2006. The handbook focuses on geometric and operational
characteristics of freeway and interchange, including entrance and exit. It also recognizes that geometric
design procedures for freeways and interchanges may vary.
A few past studies were found to examine the factors that affect freeway exit safety. Bared et al. (1999)
found that the crash frequency on freeway ramps increased with freeway Annual Average Daily Traffic
(AADT) volume. The results also indicated that exits suffered more from crashes as compared to
entrances. The statistical model, developed by Bauer and Harwood (1998), found that the ramp AADT
explained most of the variability in the crash data reported at selected sites. Other variables found to be
significant were area type (rural, urban), ramp type (on, off), ramp configuration, ramp length, and speed-
change lane (deceleration lane, acceleration lane). However, no left exits were included in these studies.
Yasuji & Takeshi (1991) established a mathematical method to compare the merging probability of right
entrances with left entrances on a Japanese urban expressway. Right entrances provided more comfortable
merging opportunities to drivers than the left entrances. It’s suggested that the merging-lane length for left
entrance should be 50% longer than that for right entrance, and to maintain large gaps, additional
attention should be given to operational countermeasures such as speed regulation and ramp metering.
Only entrances were examined in this study and no further conclusions for exits were made.
2. 2
McCartt et al. (2004) examined 1,150 crashes that occurred on heavily traveled urban interstate ramps in
northern Virginia. About half of all these crashes occurred when at-fault drivers were in the process of
exiting interstates, and the crash type most frequently associated with exits was run-off the road. It was
also found that the run-off the road crashes frequently occurred when vehicles were exiting interstates at
night, in bad weather, or on curved portions of ramps. No information about the location of the exits, that
is, left or right, was provided.
To identify the best design for a guide sign for the two-lane exit with an option lane, Upchurch et al.
(2005) examined the effect of different exit sign designs. Four candidate sign designs were evaluated
using 96 test subjects in a driving simulator. The number of missed exits and the number of unnecessary
lane changing maneuvers were adopted as measures of effectiveness. One design was recommended for
inclusion in the Manual on Uniform Traffic Control Devices (MUTCD) 2003. Only right exits were
considered in this study.
Some investigation reports have been published by national and local agencies on the traffic crashes
involving left exits. An investigation report released by the U.S. National Transportation Safety Board
(NTSB) determined that the probable cause for the traffic crash in Atlanta, Georgia on March2, 2007
which involved left exit was “the motorcoach driver’s mistaking the left exit for the southbound I-75
through lane”, and a contributing factor to the accident was “failure of the Georgia Department of
Transportation to install adequate traffic control devices to identify the separation and divergence of the
left exit from the southbound I-75 through lane” (Wikipedia, 2007). Another investigation report released
by the Florida Highway Patrol (FHP) stated that of all the three left exit crashes on southbound I-275@I-
375, two of them involved speeding. Although two overhead signs and yellow “LEFT” placards were
installed to notify drivers of the exit beforehand and two streetlights were installed there, it was still
blamed that low lighting and inadequate signage were also contributing factors for the traffic crashes
(Ringwald, 2009).
Another important issue with left exit is wrong-way driving. Copelan (1989) concluded that left exits
should be avoided in new construction because they appear to be entrances to the wrong-way driver. A
driver naturally expects to enter the freeway using a right turn. In a left exit scenario, the driver may
mistakenly make this turn and travel the wrong-way. Cooner et al. (2004) also recommended that left
exits should be avoided in new freeway construction to avoid wrong-way driving.
The thorough literature review indicated that there are currently no conclusions on safety performance of
left exits. No traffic conflict study or cross sectional study has been done for the left exits yet, and the
safety impacts of left exit are not clear.
3. Methodology
To evaluate the safety effects of left exits, a traffic conflict study was conducted at the three selected left
exits. A cross sectional before-and-after crash comparison was conducted at 11 left exits and 63 right-side
exits. The speed deviation on optional lane, the lane change maneuver along the 1,000 feet freeway
segment before the left exit and the traffic signs were also investigated.
3.1 Speed Deviation and Lane Change Maneuver
In this study, both the left exits of southbound I-275@I-375 and eastbound I-4@50th
St. have optional
lanes where drivers can select to stay on the freeway or drop to the exit. Two different movements, the
exit and through movement, coexist on the optional lane. Accordingly, the speed deviation there is larger
than that on the other lanes. A Transportation Research Board (TRB) study found that the likelihood of
traffic crashes on freeway increases as speed deviation increases, because the latter causes significant lane
changing maneuvers, which is a potential source of conflicts on freeway (TRB, 1984). The speed
deviation on the optional lane was used to evaluate the safety around left exit.
In addition to speed deviation, lane change maneuver along the 1,000 feet freeway segment before the left
exits was also monitored. The number of lane change maneuvers and the total traffic volume were
counted. The researchers even noticed from the field observation that to avoid exiting the freeway, some
through movements that stayed mistakenly on the dedicated exit lane parked at the painted gore area and
waited for a suitable gap to merge into the through movements. Due to lacking of adequate accelerating
distance, the vehicles reentered the traffic flow with low speeds and might cause severe traffic conflicts or
even collisions with other vehicles. This type of lane change maneuver was listed separately in this paper
and was named “aggressive lane change”.
3.2 Traffic Conflict Study
3. 3
A traffic conflict is defined as “an event involving two or more road users, in which the action of one user
causes the other user to make an evasive maneuver to avoid a collision” (Park & Zegeer, 1989). Evasive
maneuvers, such as applying brakes, swerving, or noticeably decelerating in order to avoid a collision can
be considered as conflicts. The conflict study is to evaluate whether there are any safety problems with
the three left exits. The conflict rate, defined by the number of conflicts per 1,000 vehicles, was used to
measure the safety performance based on the assumption that the conflict rate is correlated with the actual
crash frequency.
Four types of traffic conflicts were specifically defined in this study. The “type I conflict” is the merging
conflict from through traffic that occurs when it stays erroneously on the dedicated exit lane. To keep on
the freeway, it needs to switch from the dedicated exit lane to lanes for through movements. When the
distance between it and the following vehicle on the adjacent right lane is too close, the following vehicle
would have to slow down or swerve to avoid a collision. Figure 1 illustrated how the “type I conflict” is
produced. The “type II conflict” is merging conflict from exit traffic that occurs when it stays erroneously
on lanes only for through movements. The exit traffic stays on the wrong lane since it is assumed that the
exit is located on the right side, and at least one lane change maneuver needs to be accomplished before it
returns to the correct lane. Each time when the distance between it and the following vehicle on the
adjacent left lane is too short, a “type II conflict” will be produced, as illustrated in Figure 2. The “type III
conflict” is the diverging conflict that occurs between consecutive vehicles on the same lane when the
front vehicle slows down to change lane. It also occurs between the through and exit movements on the
optional lane when the exit traffic slows down to exit. Figure 3 illustrated the “type III conflict” on both
cases. The “type IV conflict” is the secondary traffic conflict arisen from the three traffic conflict
scenarios above, as illustrated in Figure 4.
3.3 Traffic Sign
Because road users might not expect a left exit beforehand, supplementary traffic signs were installed
based on the specifications in MUTCD to help convey the destination information. However, it was
complained that the traffic signs were still inadequate (Ringwald, 2009). In this study, the traffic signs
were investigated and compared with the specifications in MUTCD for consistency.
3.4 Cross Sectional Before-and-After Study
The safety effects of left exit could be evaluated with the traditional before-and-after study where the
exits are located on the left and right sides in the before and after period respectively. However, the safety
performance of the entities in the “after” period when the exits are located on the right sides is not
available in this study. A cross sectional before-and-after study was designed in this paper under this
circumstance. The cross sectional before-and-after study compares the safety performance of some
entities with certain special features to that of other entities without these special features. The cross
sectional before-and-after study requires that those entities should be similar except for the special
features and assumes that the differences are only contributed by the special features, which refer to the
exit locations in this study.
The left exits were classified into several groups based on their geometric configurations and traffic
volumes. And for each group, some right exits with similar geometric configurations and traffic volumes
were selected as the cross sectional parts. The crash frequency, crash rate and crash severity distribution
for left and right exits were examined. The crash frequency for a location or segment is the number of
crashes that occurred there in a limited time frame. The crash rate is defined as crashes per Million
Vehicle Kilometers Traveled (MVKT) in this study. The crash severity is classified into only two
categories: Property-Damage-Only (PDO) and Injury plus Fatal Crashes. A t-test was conducted to see
whether the crash rates for left and right exits were significantly different. The t-test was applied here
because the sample sizes were so small that a normality assumption and the associated z-test would lead
to incorrect inferences. A proportionality test was also applied to see whether the two proportions from
two independent samples were significantly different.
4. Data Collection
4.1 Site Selection
Three left exits with different geometric configurations in Tampa Bay area were selected: the southbound
I-275@I-375 and eastbound I-4@50th
St. were left exits with one dedicated lane plus one optional lane,
while the northbound I-275@31st
St. was a left exit with two dedicated exit lanes. Two hours of traffic
4. 4
flow in the peak hours (7 A.M. to 9 A.M. or 4 P.M. to 6 P.M.) on weekdays was recorded for each of the
three left exits where the camcorder was set up approximately 305 meters (1,000 ft) before the gore area.
4.2 Speed Deviation and Lane Change Maneuver
The traffic volume and the vehicle speed on the optional lane were collected from the videotape. The exit
and through volume were counted separately with electronic traffic counter. The vehicle speed on
optional lane was determined with the time it used to pass a given distance, where the beginning and
ending points could be identified from both the camcorder view and the Google Earth. The lane changing
maneuvers were identified and counted as well.
4.3 Traffic Conflict Data
The traffic conflicts at the three left exits were firstly identified from the videotape. Based on their
definitions in this paper, the traffic conflicts were further classified into four categories and counted
separately.
4.4 Traffic Sign
The MUTCD recommended that three advance guide signs should be placed 0.5 mile, 1 mile and 2 miles
respectively in advance of the left exit if spacing is permits, and at minor interchanges only one advance
guide sign should be located 0.5 to 1 mile from the left exit gore (FHWA, 2003). Other specifications on
traffic sign for left exit such as diagrammatic guide sign and LEFT placard were listed in the MUTCD as
well.
The traffic signs for the three left exits were checked for their consistency with the specifications in
MUTCD. The traffic signs for the three left exits including their contents and locations were collected.
Letters and diagrams on the traffic signs were recorded with photos, and their actual locations were
determined from Google Earth. The traffic sign installation method (that is, ground-mounted or overhead)
was also recorded.
4.5 Traffic Crash Data
Crash data from 74 freeway exits in Florida including 11 left exits and 63 right exits were collected.
Based on the exit location and the exit lane configuration, the exits were classified into four types, as
shown in Figure 5. Both type I and type II exits only have one optional exit lane. The difference between
type I and type II exits lies in that their exits are located on the right and left side respectively. Type III
and type IV exits both have one optional exit lane plus one dedicated exit lane, and similarly, the only
difference between them is their exit locations. The study area includes three subsections: the diverging
area and two influence segments, which are 457 meters (1500 feet) upstream and 305 meters (1000 feet)
downstream of the diverge area respectively. The influential area was determined mainly based on the
current design guidelines (TRB, 2000; FHWA, 2003), past research experiences (Bared et al. 1999; Bauer
& Harwood, 1998) and field observations from the research team.
Crash data was derived from the Florida Crash Analysis Reporting System (CARS) maintained by the
FDOT and a three-year time frame (2004-2006) was selected for crash data analysis. Variables including
site identification, traffic condition, geometry condition and detailed crash information such as location,
direction and severity were abstracted from the crash database for further analysis.
5. Data Analysis
5.1 Speed Deviation on Optional Lane
The average speeds and the speed standard deviations of the exit, through and total movements on the
optional lane were calculated respectively, as listed in Table 1. On neither exits the speed standard
deviations of the exit, through or total movement were beyond 25kph (15.5 mph). If the vehicle speed is
assumed to be normally distributed, this indicated that for more than 68.2% of vehicles (the percent of
vehicles which speeds are within from mean value) the difference between their speeds and the mean
speed were less than 25 kph. The curve in Figure 6 (West and Dunn, 1971) illustrated that the relative
crash involvement rate is approximately close to 1 when the difference between the vehicle’s speed and
the mean speed is within 25 kph. It can be concluded that for the three left exits the speed deviation on the
optional lane will not cause a big safety issue.
5.2 Lane Change Maneuver
5. 5
The number of lane change maneuvers was used as a supplementary index to measure the safety effects of
left exit. Table 2 listed the number of lane change maneuvers on the three left exits counted from the
videotape. The lane change maneuver rates were approximately 200 per hour, or 3% to 6% of the total
directional freeway traffic volumes near the left exits. One point is that approximately 15% of the total
lane change maneuvers were aggressive lane change maneuvers. The lane change maneuver rate for
northbound I-275@31st
St. was much higher than that for the other two left exits. As mentioned
previously, the northbound I-275@31st
St. is a left exit with only two dedicated exit lanes, while for the
rest two left exits both of them have one optional lane. As compared with left exit with only dedicated
exit lane, the left exit with optional exit lane has lower lane change maneuver rate.
The numbers of lane change maneuvers were not counted for right exits in this study, nor any threshold
values for lane change maneuver rates were found from previous studies. It’s therefore hard to conclude
whether the lane change maneuvers on left and right exits were significantly different, or whether the lane
change maneuver rates for left exits were still within the reasonable range.
5.3 Traffic Conflict Rate
Table 3 indicated that most traffic conflicts on the left exit area were type I and type III conflicts. The
amounts of traffic conflict increased with the increase on traffic volume, and the conflict rates for the
three left exits were between 10 to 13 conflicts per 1,000 vehicles. The conflict rate for northbound I-
275@31st
St. was slightly higher than that for the other two left exits. This is because that the northbound
I-275@31st
St. is a left exit with only two dedicated exit lane, while the other two left exits have one
dedicated exit lane and one optional lane. The conflict rate for left exit with optional lane was lower than
that for left exit without optional lane. However, since no conflict rates for right exit could be provided,
it’s hard to conclude whether the traffic conflict rate for left and right exits were significantly different.
It’s also uncertain whether the traffic conflict rates for the three left exits were within reasonable range
since no such criteria were found from the literature.
5.4 Traffic Sign
The recent MUTCD has made significant revisions on traffic signs for left exit (FHWA, 2003; FHWA,
2009). In MUTCD 2003, it was recommended that for left exit the diagrammatic guide sign should be
embodied on the advance guide signs since it has been shown to be superior to other conventional guide
signs; and in lane-drop situation, the EXIT ONLY panel should be used without a down arrow, as shown
in Figure 7. However, in MUTCD 2009, the diagrammatic guide sign was removed from the advance
guide signs because it has been shown to be less effective than other conventional or overhead arrow-per-
lane guide signs; and in lane-drop situation a down arrow was added to the center of the EXIT ONLY
panel. It has not been proven yet whether the newly updated traffic sign could help deliver the left exit
information to drivers more efficiently.
The installed traffic signs were also checked for consistency with the specifications in MUTCD. Table 4
listed detailed information on traffic signs for the three left exits, and many inconsistencies between
MUTCD and the real deployment were found. For example, LEFT placard was required in both MUTCD
2003 and MUTCD 2009. However, it was failed to be included on the traffic signs for the left exit I-
275@31st
St. It was also found that the diagrammatic guide signs were included in some cases while not
in the others. However, the performance of different traffic signs has not been compared in this study. A
study on traffic sign with driving simulation method is highly recommended to figure out the best traffic
sign configurations for left exit.
5.5 Traffic Crash Analysis
The annual crash frequency for the selected exits varied from 0 to 20 crashes per year. The safety
performance of different types of exits was summarized in Table 4. The annual average crash frequency
for type I, type II, type III and type IV exit was 5.14, 8.29, 5.93 and 6.00 crashes per year respectively.
The type II exits have the highest annual average crash frequency, which is 60% more than that for the
exits with the lowest annual average crash frequency. Geometric configurations also affect the annual
average crash frequency of freeway exits. For exits with one optional lane, the annual average crash
frequency for right exits (type I exits) was lower than that for left exits (type II exits). However, for exits
with one optional lane and one dedicated exit lane, the annual average crash frequency for left exits (type
IV exits) and right exits (type III exits) was very close.
The average crash rates for different exits were also compared. Right exits have lower average crash rates
than left exits, no matter they have one or two exit lanes. However, t-test indicated that the differences
6. 6
between them were not statistically significant at the significance level of 0.1, partly because of the small
sample size of the left exits.
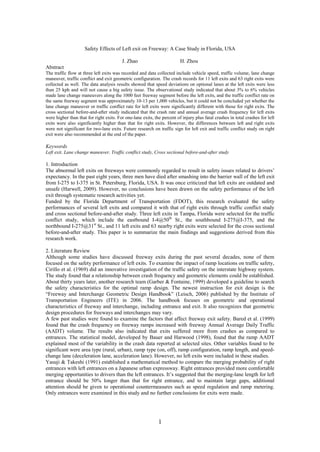
The crash severity distribution for different exits, which is the percentage of injury plus fatal crashes in
total crashes, was compared, as shown in Figure 8. Statistical tests indicated that at the significance level
of 0.1, the difference on crash severity distribution was significant between exits with one exit lane.
However, it was not significant between exits with two exit lanes.
6. Conclusions and Recommendations
To evaluate the safety effects of left exit, the vehicle speed, traffic volume, lane change maneuver and
traffic conflict at three left exits in Tampa Bay area were collected. The speed deviations on optional lane
were less than 25 kph (15.5 mph) and will not cause a big safety issue. Approximately 3% to 6% vehicles
on the left exit area made lane change maneuvers, and the average conflict rates were 10 to 13 vehicles
per 1,000 vehicles. However, it could not be concluded whether the number of lane change maneuvers
and average conflict rates for left exits were significantly different with that for right exits, or whether
they were still within reasonable range. The cross sectional before-and-after study indicated that the
annual average crash frequency and average crash rate for left exit were higher than that for right exit.
However, none of the differences were significant. Although for one-lane exits the crash severity
distributions of left and right exits were significant different, it’s not the case for two-lane exits. Although
the left exit is not recommended for new construction because of the wrong-way driving issue, it still
could not be concluded whether left exit is unsafe. Additional traffic operational studies on right exits are
recommended to see whether the conflict rates and number of lane change maneuvers on left and right
exits are significantly different.
7. 7
References
Bared, J., Giering L.G. & Warren L.D., 1999. Safety of evaluation of acceleration and deceleration lane lengths. ITE
Journal, pp. 50-54.
Bauer K.M., Harwood D.W., 1998. Statistical models of accidents on interchange ramps and speed-change lanes.
Midwest Research Institute, Report No. FHWA-RD-97-106.
Cooner, S., Cothron, S. & Ranft, S., 2004. Countermeasures for wrong-way movement on freeways: overview of
project activities and findings. Texas Transportation Institute, Report No. FHWA/TX-04/4128-1.
Copelan, J., 1989. Prevention of wrong-way accidents on freeways. California Department of Transportation, Traffic
Operation Division, Report No. FHWA/CA-TE-89-2.
Cirillo J.A., Dietz S.K. & Beatty R.L., 1969. Analysis and modeling of relationships between accidents and the
geometric and traffic characteristics of the interstate system. Federal Highway Administration.
Garber N., Fontaine M., 1999. Guidelines for Preliminary Selection of the Optimum Interchange Type for a Specific
Location. Virginia Transportation Research Council , Report No. VTRC-99-r15.
Federal Highway Administration, 2003. Manual on uniform traffic control devices for streets and highway.
Washington D. C.: Federal Highway Administration.
Federal Highway Administration, 2009. Manual on uniform traffic control devices for streets and highway.
Washington D. C.: Federal Highway Administration.
Harwell, D., 2009. Critics say I-375 exit ramp where three men have died is outdated and unsafe. [Online] (Updated
12 Mar. 2009) Available at: http://www.tampabay.com/news/transportation/roads/article981504.ece.
[Accessed 23 Feb. 2010].
Leisch, J., 2006. Freeway and Interchange Geometric Design Handbook. Washington D. C.: Institute of
Transportation Engineering.
McCartt A.T., Northrup V.S. & Retting R.A., 2004. Types and Characteristics of Ramp-Related Motor Vehicle
Crashes on Urban Interstate Roadways in Northern Virginia. Journal of Safety Research, 35, pp. 107–114.
Park M. R. Jr., Zegeer C. V., 1989. Traffic conflict techniques for safety and operations: Observer’s manual. Turner-
FairbankHighway Research Center, Report No. FHWA-IP-88-027.
Ringwald, E., 2009. The Interstate 275 Florida blog. [Online] (Updated 3 Mar. 2009) Available at:
http://interstate275florida.blogspot.com/2009/03/another-tragic-accident-at-interstate.html. [Accessed 23
February 2010].
Transportation Research Board, 1984. Special Report 204: 55-A Decade of Experience. Washington, D. C.: National
Research Council.
Transportation Research Board, 2000. Highway Capacity Manual. Washington, D.C.: Transportation Research Board
of the National Academies.
Upchurch J., Fisher D. & Waraich B., 2005. Guide signing for two-lane exits with an option lane: evaluation of
human factors. Transportation Research Record, 1918, pp. 35-45.
West L. B. Jr., Dunn J. W., 1971. Accidents, speed deviation and speed limits. Journal of Traffic Engineering, 41(10),
pp. 5255-5261.
Wikipedia, 2007. Bluffton University bus accident. [Online] (Updated 22 Feb. 2010) Available at:
http://en.wikipedia.org/wiki/Bluffton_University_bus_accident. [Accessed 23 February 2010].
Yasuji M., Takeshi M., 1991. Evaluation of outside and inside expressway ramps based on merging probability.
Journal of Transportation Engineering, 117 (1), pp. 57-70.
8. 8
Table 1 Vehicle Speed on Optional Lane
Exit location I-275@I-375 I-4@50th
St.
Movement type Exit Through Exit Through
Average speed (kph) 101.0 115.7 130.4 119.0
Speed standard deviation (kph)
13.4 24.3 11.0 12.2
24.6 19.5
9. 9
Table 2 Lane Change Maneuvers at Left Exits
Exit location Lane change maneuver Aggressive lane change maneuver Traffic volume %1
%2
I-275@I-375 210 30 4,945 4.2 14.3
I-275@31st
St. 205 24 3,494 5.8 11.7
I-4@50th
St. 194 29 5,781 3.3 14.9
Note: 1 is the percent of lane change maneuvers in total traffic volume;
2 is the percent of aggressive lane change maneuvers in lane change maneuvers.
10. 10
Table 3 Traffic Conflict at Left Exits
Exit location
Conflict type
Total Traffic volume
Conflict rate
(conflicts per 1,000 vehicles)I II III IV
I-275@I-375 40 4 10 5 59 4,945 11.9
I-275@31st
St. 16 1 23 3 43 3,494 12.3
I-4@50th
St. 22 8 27 4 61 5,781 10.5
11. 11
Table 4 Traffic Signs for Left Exit on Freeway
Sequence Item
Exit location
I-275@I-375 I-275@31st
St. I-4@50th
St.
First advance guide sign
Distance to the exit (mile) 0.36 1 1
Distance illustration No Yes Yes
Diagrammatic guide sign Yes No Yes
EXIT ONLY placard No Yes Yes
Arrow-per-lane guide sign No Yes No
LEFT placard Yes No Yes
Street name Yes Yes Yes
Exit number Yes Yes Yes
Installation method Overhead Overhead Overhead
Second advance guide sign
Distance to the exit (mile) 0.06 0.25 0.5
Distance illustration No Yes Yes
Diagrammatic guide sign No No Yes
EXIT ONLY placard No Yes Yes
Arrow-per-lane guide sign Yes Yes No
LEFT placard Yes No Yes
Street name Yes Yes Yes
Exit number Yes Yes Yes
Installation method Overhead Overhead Overhead
Third advance guide sign
Distance to the exit (mile) N/A 0.08 0.2
Distance illustration N/A No No
Diagrammatic guide sign N/A No No
EXIT ONLY placard N/A Yes Yes
Arrow-per-lane guide sign N/A Yes Yes
LEFT placard N/A No Yes
Street name N/A Yes Yes
Exit number N/A Yes Yes
Installation method N/A Overhead Overhead
12. 12
Table 5 Descriptive Statistics of Traffic Crashes by Exit Types
Annual average crash frequency (crashes per year per site)
Exit type Number of sites Mean Standard deviation Maximum Minimum
I 53 5.14 3.18 14.67 1.67
II 7 8.29 7.52 19.67 1.33
III 10 5.93 5.76 16.67 0.00
IV 4 6.00 4.55 12.67 2.67
Average crash rate (crash per Million Vehicle Kilometers Traveled (MVKT))
Exit type Number of sites Mean Standard deviation Maximum Minimum
I 53 0.19 0.08 0.41 0.05
II 7 0.24 0.14 0.47 0.09
III 10 0.20 0.10 0.59 0.00
IV 4 0.22 0.06 0.27 0.12
13. 13
Exit Lane
Left Exit without Optional Lane
Through Lane
Through Lane
Through Lane
Exit Lane
Left Exit with Optional Lane
Optional Lane
Through Lane
Exit Lane
Through Lane
First vehicle at first location
Second vehicle at first location
First vehicle at second location
Second vehicle at second location
Figure 1 Type I Traffic Conflict on Left exit
Exit Lane
Left Exit without Optional Lane
Through Lane
Through Lane
Through Lane
Exit Lane
Left Exit with Optional Lane
Optional Lane
Through Lane
Exit Lane
Through Lane
First vehicle at first location
Second vehicle at first location
First vehicle at second location
Second vehicle at second location
Figure 2 Type II Traffic Conflict on Left exit
14. 14
Exit Lane
Left Exit without Optional Lane
Through Lane
Through Lane
Through Lane
Exit Lane
Left Exit with Optional Lane
Optional Lane
Through Lane
Exit Lane
Through Lane
Figure 3 Type III Traffic Conflict on Left exit
Exit Lane
Left Exit without Optional Lane
Through Lane
Through Lane
Through Lane
Exit Lane
Left Exit with Optional Lane
Optional Lane
Through Lane
Exit Lane
Through Lane
Vehicle 1 at first location
Vehicle 2 at first location
Vehicle 1 at second location
Vehicle 2 at second location
Vehicle 3 at first location Vehicle 3 at second location
Figure 4 Type IV Traffic Conflict on Left exit
15. 15
Through Lane
Through Lane
Optional Lane
Type I Right Exit with Optional Lane
Optional Lane
Type II Left Exit with Optional Lane
Through Lane
Through Lane
Through Lane
Optional Lane
Exit Lane
Type III Right Exit with Optional Lane plus Dedicated Exit Lane
Exit Lane
Type VI Left Exit with Optional Lane plus Dedicated Exit Lane
Optional Lane
Through Lane
Figure 5 Geometric Configurations for Freeway Exits
16. 16
Figure 6 Relationship between Speed and Relative Crash Involvement Rate (West and Dunn, 1971)
0
5
10
15
20
Less than -25 -25 to -9 -9 to 9 9 to 25 Greater than 25
RelativeInvolvementRate
Deviation fromMeanSpeed(kmh)
With turningaccidents
Exclude turningaccidents
17. 17
MUTCD 2003 MUTCD 2009
Figure 7 Traffic Sign Configurations for Left Exit in MUTCD 2003 and MUTCD 2009
18. 18
Figure 8 Crash Severity Distributions for Different Exit Types
64%
36%
32%
68%
62%
38%
32%
68%
0%
25%
50%
75%
100%
PDO Injury plus Fatal
Type I Type II
Type III Type VI